

PM2.5 on the London Underground
- PMID: 31787325
- PMCID: PMC6902242
- DOI: 10.1016/j.envint.2019.105188
PM2.5 on the London Underground
Abstract
Introduction: Despite the London Underground (LU) handling on average 2.8 million passenger journeys per day, the characteristics and potential health effects of the elevated concentrations of metal-rich PM2.5 found in this subway system are not well understood.
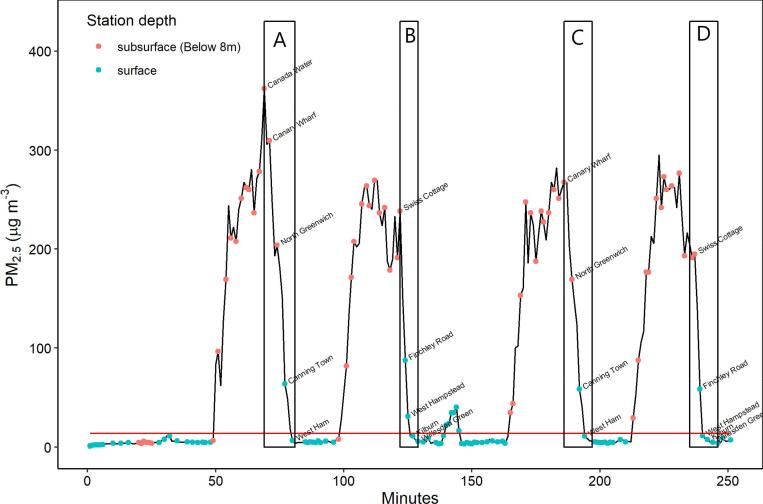
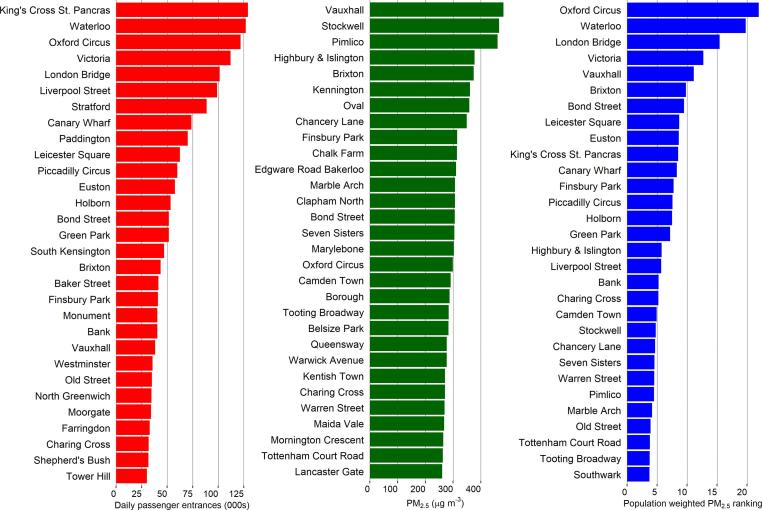
Methods: Spatial monitoring campaigns were carried out to characterise the health-relevant chemical and physical properties of PM2.5 across the LU network, including diurnal and day-to-day variability and spatial distribution (above ground, depth below ground and subway line). Population-weighted station PM2.5 rankings were produced to understand the relative importance of concentrations at different stations and on different lines.
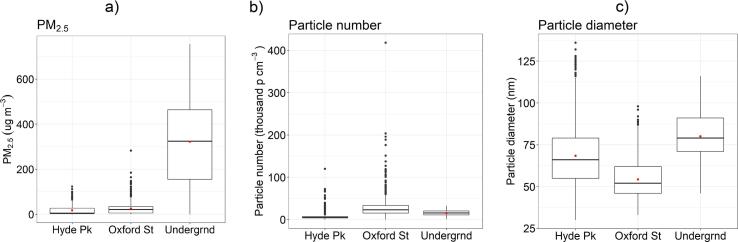
Results: The PM2.5 mass in the LU (mean 88 μg m-3, median 28 μg m-3) was greater than at ambient background locations (mean 19 μg m-3, median 14 μg m-3) and roadside environments in central London (mean 22 μg m-3, median 14 μg m-3). Concentrations varied between lines and locations, with the deepest and shallowest submerged lines being the District (median 4 μg m-3) and Victoria (median 361 μg m-3 but up to 885 μg m-3). Broadly in agreement with other subway systems around the world, sampled LU PM2.5 comprised 47% iron oxide, 7% elemental carbon, 11% organic carbon, and 14% metallic and mineral oxides. Although a relationship between line depth and air quality inside the tube trains was evident, there were clear influences relating to the distance from cleaner outside air and the exchange with cabin air when the doors open. The passenger population-weighted exposure analysis demonstrated a method to identify stations that should be prioritised for remediation to improve air quality.
Conclusion: PM2.5 concentrations in the LU are many times higher than in other London transport Environments. Failure to include this environment in epidemiological studies of the relationship between PM2.5 and health in London is therefore likely to lead to a large exposure misclassification error. Given the significant contribution of underground PM2.5 to daily exposure, and the differences in composition compared to urban PM2.5, there is a clear need for well-designed studies to better understand the health effects of underground exposure.
Keywords: Composition; Exposure; Metro; PM(2.5); Subway.
Copyright © 2019 The Authors. Published by Elsevier Ltd.. All rights reserved.
Conflict of interest statement
The authors declare that they have no known competing financial interests or personal relationships that could have appeared to influence the work reported in this paper.
Figures


References
-
- Aarnio P., Yli-Tuomi T., Kousa A., Mäkelä T., Hirsikko A., Hämeri K., Räisänen M., Hillamo R., Koskentalo T., Jantunen M. The concentrations and composition of and exposure to fine particles (PM2.5) in the Helsinki subway system. Atmos. Environ. 2005;39:5059–5066.
-
- Adams H., Nieuwenhuijsen M., Colvile R., McMullen M.A., Khandelwal P. Fine particle (PM2.5) personal exposure levels in transport microenvironments, London, UK. Sci. Total Environ. 2001;279(1–3):29–44. - PubMed
-
- Beddows D.C.S., Dall’osto M., Harrison R.M. An enhanced procedure for the merging of atmospheric particle size distribution data measured using electrical mobility and time-of-flight analysers. Aerosol Sci. Technol. 2010;44(11):930–938.
-
- Bigi A., Harrison R.M. Analysis of the air pollution climate at a central urban background site. Atmos. Environ. 2010;44(16):2004–2012. - PubMed
Publication types
MeSH terms
Substances
Grants and funding
LinkOut - more resources
Full Text Sources
Other Literature Sources
Medical
Miscellaneous
