. 2019 Dec:50:274-289.
doi: 10.1016/j.ebiom.2019.11.026. Epub 2019 Nov 29.

Human iPSC-derived astrocytes from ALS patients with mutated C9ORF72 show increased oxidative stress and neurotoxicity

Affiliations

Human iPSC-derived astrocytes from ALS patients with mutated C9ORF72 show increased oxidative stress and neurotoxicity

Anastasya Birger et al. EBioMedicine. 2019 Dec.

Abstract

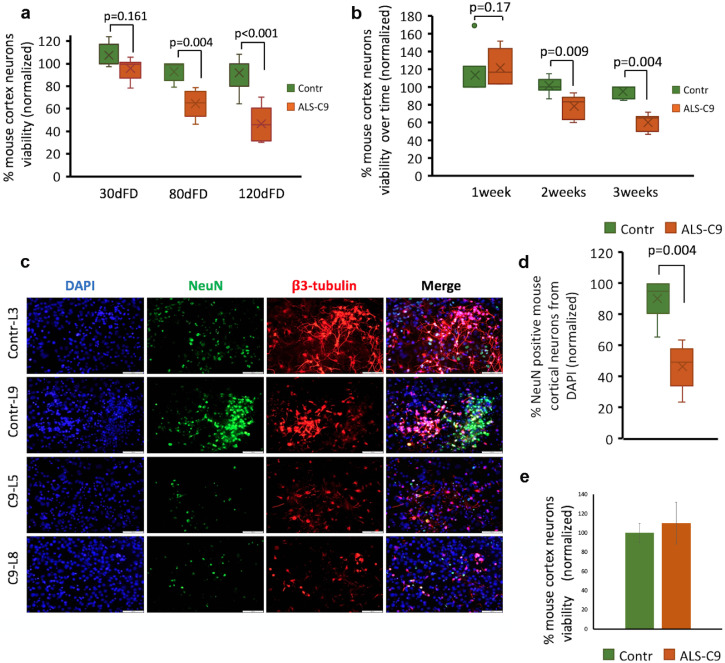
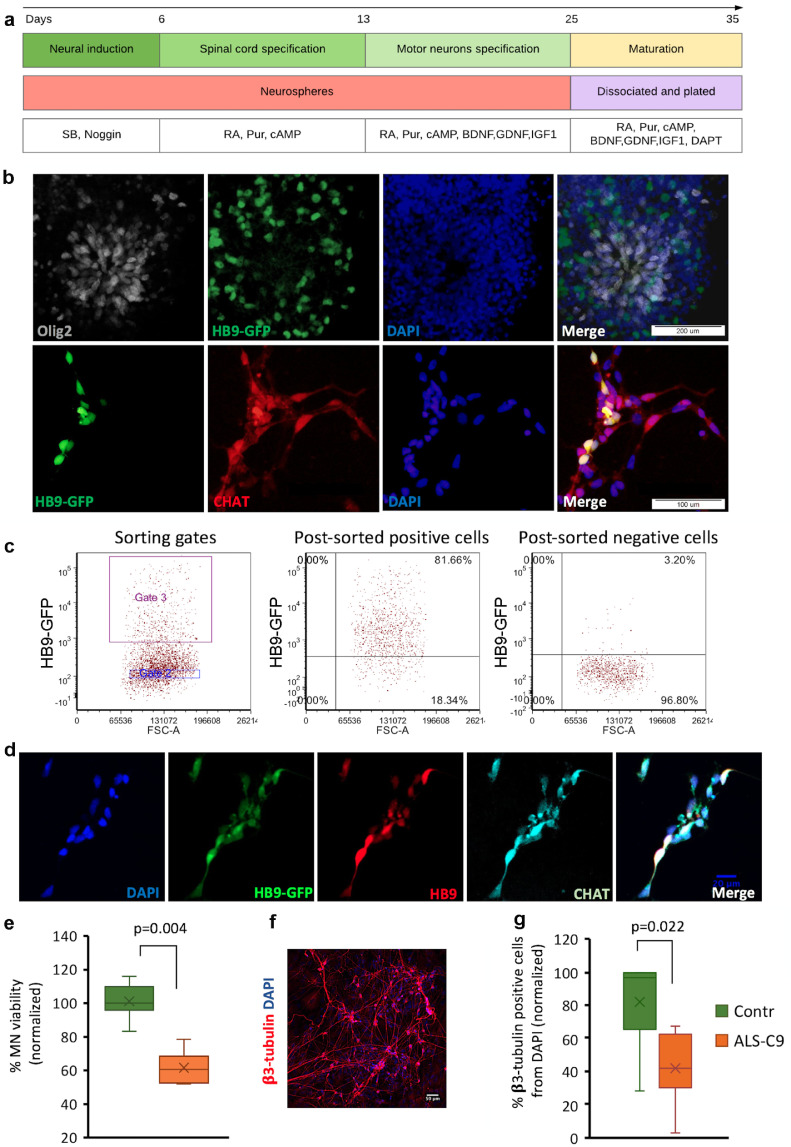
Background: Amyotrophic lateral sclerosis (ALS) is a progressive neurodegenerative disease that affects motor neurons (MNs). It was shown that human astrocytes with mutations in genes associated with ALS, like C9orf72 (C9) or SOD1, reduce survival of MNs. Astrocyte toxicity may be related to their dysfunction or the release of neurotoxic factors.

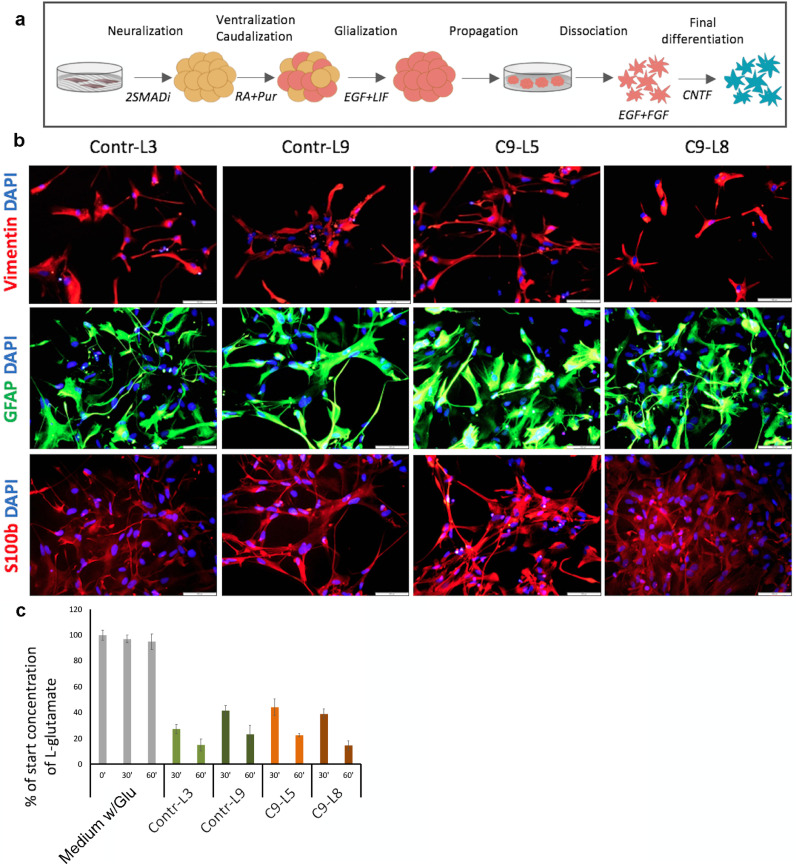
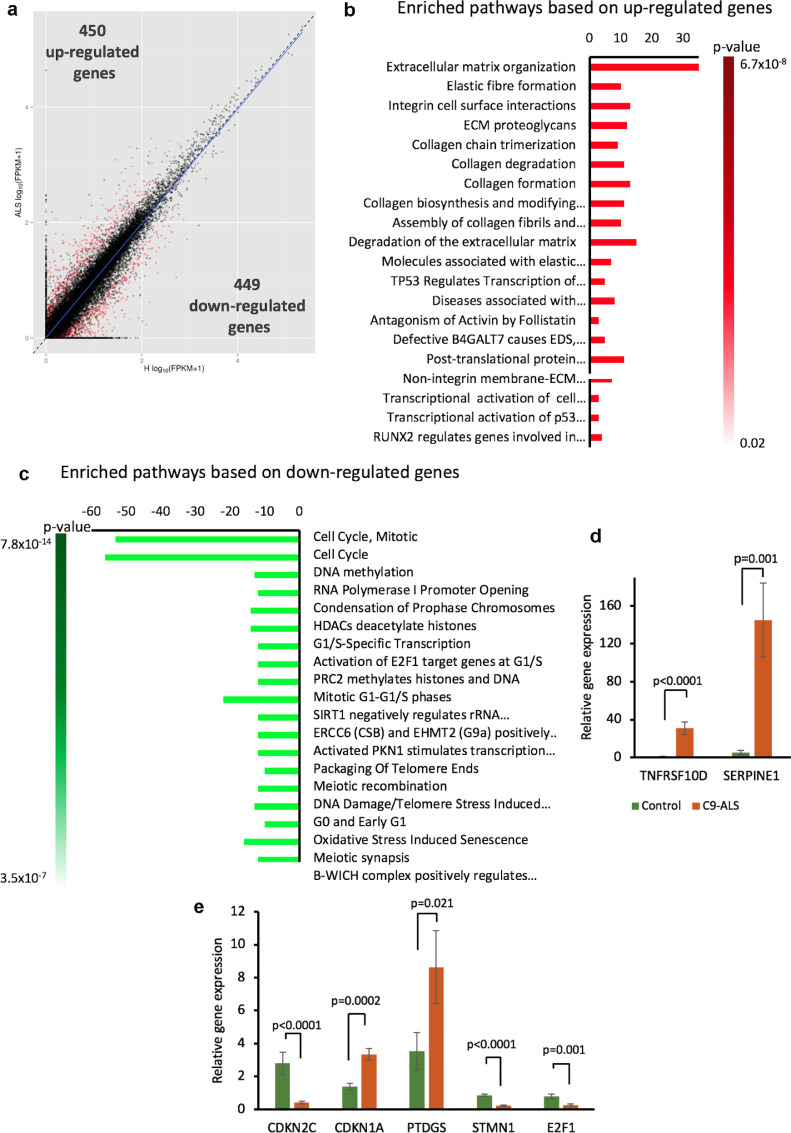
Methods: We used human induced pluripotent stem cell-derived astrocytes from ALS patients carrying C9orf72 mutations and non-affected donors. We utilized these cells to investigate astrocytic induced neuronal toxicity, changes in astrocyte transcription profile as well as changes in secretome profiles.

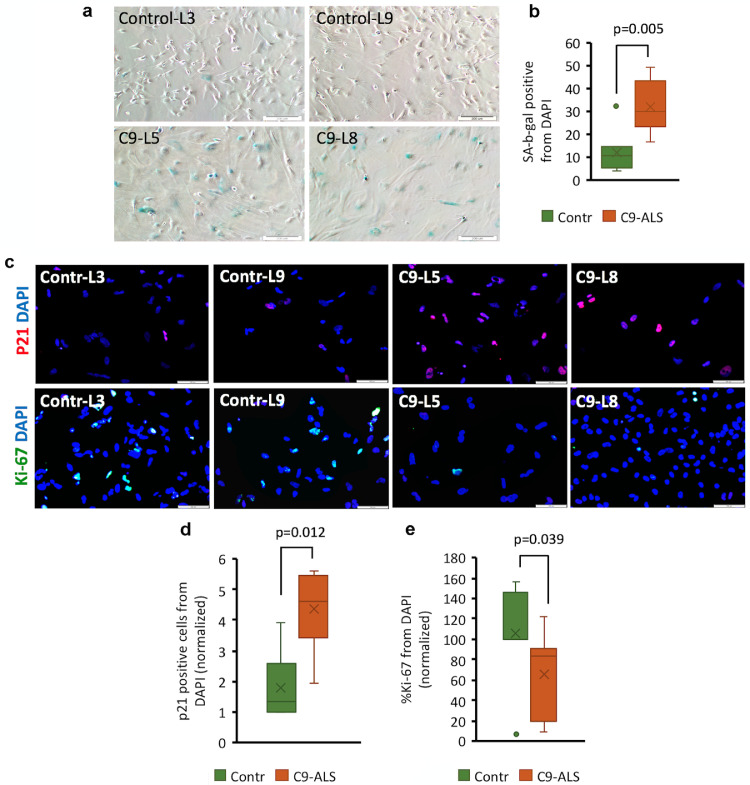
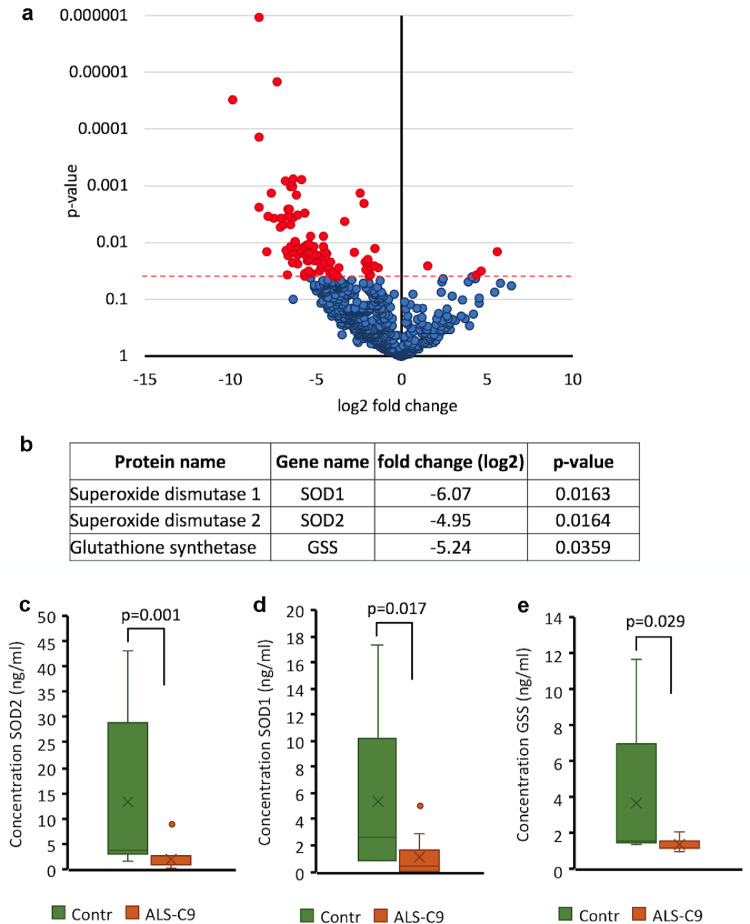
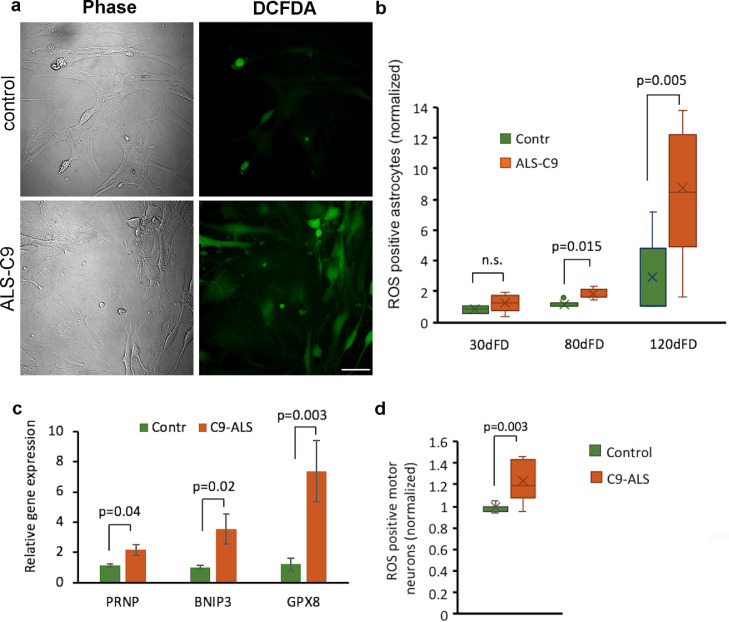
Findings: We report that C9-mutated astrocytes are toxic to MNs via soluble factors. The toxic effects of astrocytes are positively correlated with the length of astrocyte propagation in culture, consistent with the age-related nature of ALS. We show that C9-mutated astrocytes downregulate the secretion of several antioxidant proteins. In line with these findings, we show increased astrocytic oxidative stress and senescence. Importantly, media conditioned by C9-astrocytes increased oxidative stress in wild type MNs.

Interpretation: Our results suggest that dysfunction of C9-astrocytes leads to oxidative stress of themselves and MNs, which probably contributes to neurodegeneration. Our findings suggest that therapeutic strategies in familial ALS must not only target MNs but also focus on astrocytes to abrogate nervous system injury.

Keywords: Amyotrophic lateral sclerosis; Astrocytes; Neurotoxicity; Oxidative stress; Senescence; iPSC.


Conflict of interest statement

Benjamin Reubinoff is a member of the scientific advisory board of Kadimastem Ltd. and holds options in the company. A major focus of the company is the development of hESC-derived astrocytes for transplantation therapy in ALS. Michal Izrael is an employee of Kadimastem Ltd. and holds options in the company.

Figures

Fig 1
Fig. 1
Generation of functional astrocytes from C9-mutated and control iPSC lines. (a) Schematic presentation of the protocol for induction of astrocyte differentiation. iPSC colonies cultured on feeders were detached for further differentiation as floating spheres in non-adherent plates. Initial neuralization was induced by dual SMAD inhibitors (2SMADi) SB431542 and Dorsomorphin. Further caudalization of the neural progenitor spheres was promoted by retinoic acid (RA) and ventralization by Purmorphamine (Pur). Enrichment for glial progenitors was induced by culture in the presence of epidermal growth factor (EGF) and leukemia inhibitory factor (LIF). The neural spheres were then dissociated, and the cells were plated and further cultured as a monolayer in the presence of EGF and basic fibroblast growth factor (bFGF). Final differentiation to astrocytes was induced in the presence of ciliary neurotrophic factor (CNTF). Please see details in the Methods. (b) Representative immunofluorescence images of C9-mutated (C9-L5, C9-L8) and control (Contr-L3, Contr-L9) astrocytes decorated with anti-Vimentin (red), glial fibrillary acid protein, (GFAP; green), S100β (green) at day 30 of final differentiation (dFD). Nuclei (blue) are counterstained with DAPI. Scale bars: 100 µm. These experiments were repeated 5 independent times with similar results. c. Histogram presentation of glutamate uptake assay showing that control (Contr-L3, Contr-L9, green bars) and mutated (C9-L5, C9-L8, orange bars) astrocytes uptake l-glutamate from the media at the same rate after 30 and 60 min. The results are normalized to the initial concentration of l-glutamate (50 µM). Data are represented as mean ± SEM of 3 independent experiments with astrocytes at 30–40 dFD. (For interpretation of the references to colour in this figure legend, the reader is referred to the web version of this article.)
Fig 2
Fig. 2
Toxicity to neurons of media conditioned by C9-mutated astrocytes - its dependence on the astrocyte age in culture. (a) Alamar blue cell viability analysis of mouse cortical neurons showing the toxic effect of media conditioned by C9-mutated astrocytes at 30, 80 and 120 dFD (orange boxes) compared with media conditioned by non-mutated astrocytes (green boxes). Neuronal viability was evaluated after 3 weeks' culture in the conditioned media. Data are represented as a range of values from 3 independent experiments for each time point normalized to Contr-L3 (independent derivations of mouse cortical neurons for each experiment). (b) Analysis of mouse cortical neuron viability was performed as in (a) using media conditioned by C9-mutated (orange boxes) and control (green boxes) astrocytes at 80 dFD. Cell viability was assayed weekly during 3 weeks of culture in the conditioned media. (The data represent 3 independent experiments. Mouse cortical neurons were independently derived for each experiment). (c) Representative fluorescence images of mouse cortical neurons co-immunostained for NeuN (green) and β3-tubulin (red) after 3 weeks of culture in media conditioned by astrocytes at 80 dFD treatment. Nuclei were counterstained by DAPI (blue). Scale bar: 100 μm. (d) Quantitative analysis of the percentage of cells immunoreactive with anti-NeuN after 3 weeks of culture in media conditioned by astrocytes. 16 fields were scored from each condition (n = =3). Data are represented as a range of values from 3 experiments normalized to Contr-L3 (independent derivations of mouse cortical neurons for each experiment). e. Analysis of mouse cortical neuron viability after incubation in C9-astrocyte conditioned medium that was concentrated and further diluted in control medium. Astrocytes at 80 dFD were used to prepare the conditioned medium. Conditioned media pooled from two control (C-L3, C-L9) and pooled from two mutated C9 lines (C9-L5, C9-L8) were concentrated 10-fold. The concentrated media were diluted back into non-mutated astrocytes-conditioned media. These reconstituted conditioned media were used for testing mouse cortical neuron viability as in (a). (For interpretation of the references to colour in this figure legend, the reader is referred to the web version of this article.)
Fig 3
Fig. 3
Toxicity of media conditioned by C9-mutated astrocytes to human iPSC-derived motor neurons. (a) Schematic presentation of the protocol of induction of differentiation of hESC into MNs. (b) Immunostaining of hESC-derived spinal cord MNs showing the expression of the early MN markers Olig2 (white) and GFP under the promoter of HB9 (HB9-GFP) at day 15 of the differentiation protocol (upper panel, scale bars: 200 µm). Co-expression of HB9-GFP and the mature MN marker CHAT (red) is shown at day 30 of MN differentiation (lower panel, scale bars: 100 µm). Nuclei were counterstained with DAPI (blue). The experiment was repeated 3 times with similar results. (c) HB9-GFP expressing MNs were sorted by GFP signal by Aria II BD FACS sorter. Dot plots present sorting gates and post-sorting analysis. (d) Fluorescence images of sorted MNs after plating and 6 days in culture. The MNs express HB9-GFP (green), and are immunoreactive with both anti-HB9 (red) and anti-CHAT (cyan). Nuclei (blue) are counterstained with DAPI. Scale bar: 20 µm. (e) Alamar blue viability analysis of sorted human MNs after 2 weeks in culture in media conditioned by C9-mutated astrocytes (orange box) and non-mutated astrocytes (green box) at 80–90dFD. Data are presented as a range of values from 3 independent experiments normalized to Contr-L3 (independent derivations of MNs for each experiment). (f) Representative fluorescence image of sorted MNs immunostained for β3-tubulin after 2 weeks in culture in media conditioned by C9-mutated astrocytes. Scale bar: 50 µm. g. Immunostaining analysis of the percent of β3-tubulin-expressing cells from total DAPI+ nuclei within cultures of sorted MNs after 2 weeks in culture in media conditioned by C9-mutated (orange box) and non-mutated (green box) astrocytes. 10 fields were scored per each media condition in each experiment. Data are presented as a range of values from 3 independent experiments normalized to Contr-L3 (independent derivations of MNs for each experiment). (For interpretation of the references to colour in this figure legend, the reader is referred to the web version of this article.)
Fig 4
Fig. 4
Transcriptome analysis of C9-mutated and non-mutated astrocytes derived from iPSC. (a) RNA-seq analysis was performed on two C9-mutated (C9-L5, C9-L8) and two un-mutated (Contr-L3, Contr-L9) astrocyte lines. Scatter plot of gene expression expressed as log10 (FPKM  + + 1).  Each dot represents a gene. Genes displaying a variability of expression above the specified cut-off (qvalue <0.05, FPKM >0.03 in at least one of the conditions) were defined as differentially expressed and are shown in red. (H, healthy non-mutated lines; ALS, C9-mutated lines). (b and c) The most altered pathways were identified by analysis of upregulated and downregulated genes respectively using the Reactome database. X axis represents number of genes in a pathway. Gradient column represents the significance of recognized pathways. (d and e) qRT-PCR was used to validate the differential expression of selected genes observed by RNA-seq. Validation was performed on RNA from four C9-mutated (C9-L5, C9-L8, C9-L1, C9-L37) and two unmutated (Contr-L3, Contr-L9) astrocyte lines. Data are presented as mean ± SEM of 3 independent experiments (independent differentiations of astrocytes and RNA extractions for each experiment).
Fig 5
Fig. 5
C9 mutated astrocytes acquire senescence phenotype at higher rates than non-mutated astrocytes. (a) Representative phase-contrast images of mutated (C9-L5, C9-L8) and control (Contr-L3, Contr-L9) astrocytes stained for Sa-β-gal activity. Four independent experiments were performed at 90–100 dFD. Scale bar: 200 µm. (b) Percentage of Sa-β-gal positive astrocytes within C9-mutated (C9-L5, C9-L8, orange box) and control (Contr-L3, Contr-L9, green box) cultures. Ten fields were quantified from each condition. Results are expressed as the percentage of Sa-β-gal positive cells from DAPI counterstained and nuclei normalized to Contr-L3. Data are presented as a range of values from 4 independent experiments (independent differentiations of astrocytes for each experiment). (c) Representative images of C9-mutated (C9-L5, C9-L8) and control (Contr-L3, Contr-L9) astrocytes immunostained for p21 (red, upper panel) and Ki-67 (green, lower panel). Nuclei are counterstained with DAPI (blue). Experiments were performed at 90–100 dFD. Scale bars: 100 µm. d-e. Percentage of p21- and Ki-67-positive cells. Ten fields with about 40 cells per field of immunostained cultures (shown in C) were scored per each condition for the percentage of p21- and Ki-67- positive cells from DAPI normalized to Contr-L3. Data are presented as a range of values from 3 experiments. (For interpretation of the references to colour in this figure legend, the reader is referred to the web version of this article.)
Fig 6
Fig. 6
Secretome analysis of C9 mutated astrocytes. a. Mass spectrometry analysis of control (Contr-L3, Contr-L9) and C9-mutated (C9-L5, C9-L8) astrocyte secretome. 3 biological replicates of media conditioned by each line were analyzed. Conditioned media was collected during toxicity experiments at 70–90 dFD of astrocytes. The results are presented by a volcano plot where each point represents an identified protein. The log2 difference intensity is plotted against the t-test p-value for each protein. The proteins with significantly (p <  < 0.05) different levels between C9- and non-mutated secretome samples are in red. b. Proteins related to oxidative stress were significantly down-regulated in the C9-mutated secretome. (c–e) Down-regulation of SOD1, SOD2, and GSS in the C9-mutated secretome was validated by ELISA. 3 biological replicates of conditioned media from C9-mutated (C9-L5, C9-L8) and control (Contr-L3, Contr-L9) astrocytes were analyzed by ELISA assay. Data are presented as a range of values from 3 independent experiments.
Fig 7
Fig. 7
C9 mutated astrocytes show higher percentage of ROS-positive cells and their secretome can induce higher ROS levels in MNs. (a) Representative phase-contrast and florescence images of control (Contr-L9) and mutated (C9-L8) astrocytes at 90 dFD stained with DCFDA Cellular Reactive Oxygen Species Detection Assay Kit. Scale bar 50 μM. (b) FACS analysis of ROS-positive astrocytes from C9-mutated (C9-L5, C9-L8, C9-L1) and control (Contr-L3, Contr-L9) lines at different time points of FD (30, 80 and 120 dFD). ROS-positive cells were detected by using the DCFDA Cellular Reactive Oxygen Species Detection Assay Kit. Only live cells were counted by exclusion of PI-positive cells. The relative number of ROS-positive cells is presented relative to Contr-L3. Data are presented as a range of values from 3 independent experiments for each time point. (c) qRT-PCR validation of RNA-seq analysis that showed the altered expression of genes related to cellular oxidative stress. RNA was extracted from 4 C9-mutated (C9-L5, C9-L8, C9-L37, C9-L1) and 2 non-mutated (Contr-L3, Contr-L9) astrocyte lines at 80–100 days of FD. Data are presented as mean ± SEM of 3 independent experiments. (d) Oxidative stress of FACS sorted hMNs was analyzed after 8 days in culture in media conditioned by 4 C9-mutated (C9-L5, C9-L8, C9-L37, C9-L1) and 2 non-mutated (Contr-L3, Contr-L9) astrocyte lines at 80–90dFD by using CellROX™ Deep Red Flow Cytometry Assay Kit. Results are expressed as the percent of ROS-positive MNs from live GFP-positive MNs which were gated using PI. Data are presented as a range of values from 4 independent experiments normalized to Contr-L3.

References

    1. Gros-Louis F., Gaspar C., Rouleau G.A. Genetics of familial and sporadic amyotrophic lateral sclerosis. Biochim Biophys Acta. 2006;1762:956–972. doi: 10.1016/j.bbadis.2006.01.004. - DOI - PubMed
    1. Volk A.E., Weishaupt J.H., Andersen P.M., Ludolph A.C., Kubisch C. Current knowledge and recent insights into the genetic basis of amyotrophic lateral sclerosis. Med Genet. 2018;30:252–258. doi: 10.1007/s11825-018-0185-3. - DOI - PMC - PubMed
    1. De Jesus-Hernandez M, Mackenzie IR, Boeve BF, Boxer AL, Baker M, Rutherford NJ. Expanded GGGGCC hexanucleotide repeat in noncoding region of C9ORF72 causes chromosome 9p-linked FTD and ALS. Neuron. 2011;72:245–256. doi: 10.1016/j.neuron.2011.09.011. - DOI - PMC - PubMed
    1. Renton AE, Majounie E, Waite A, Simón-Sánchez J, Rollinson S, Gibbs JR. A hexanucleotide repeat expansion in C9ORF72 is the cause of chromosome 9p21-linked ALS-FTD. Neuron. 2011;72:257–268. doi: 10.1016/j.neuron.2011.09.010. - DOI - PMC - PubMed
    1. Fernandez-Fernandez S., Almeida A., Bolaños J.P. Antioxidant and bioenergetic coupling between neurons and astrocytes. Biochem J. 2012;443:3–11. doi: 10.1042/BJ20111943. - DOI - PubMed

MeSH terms