

Structural brain imaging correlates of general intelligence in UK Biobank
- PMID: 31787788
- PMCID: PMC6876667
- DOI: 10.1016/j.intell.2019.101376
Structural brain imaging correlates of general intelligence in UK Biobank
Abstract
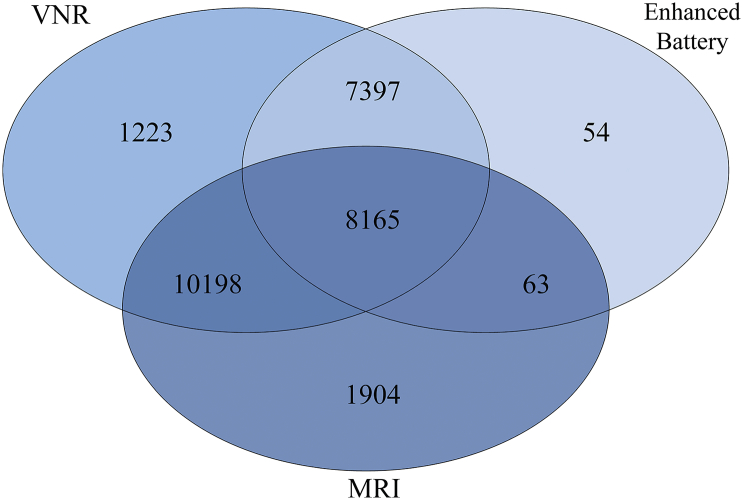
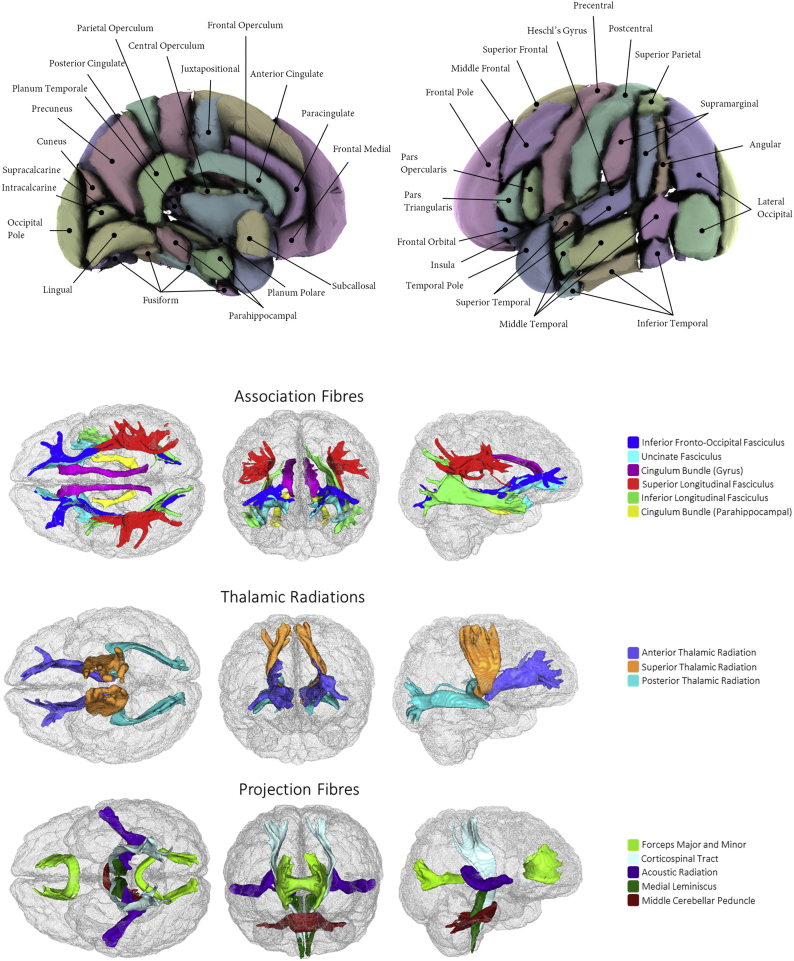
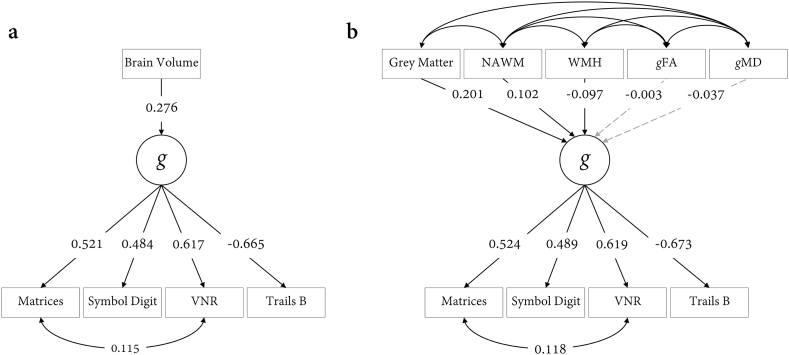
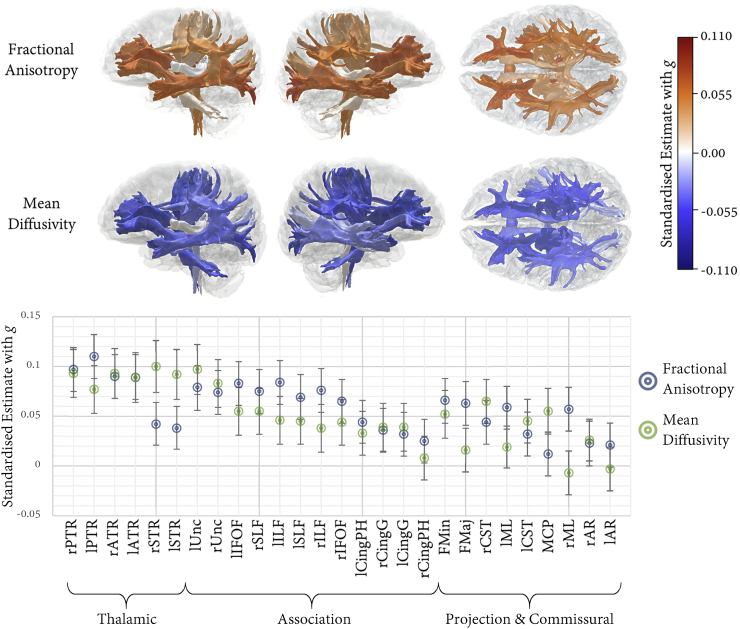
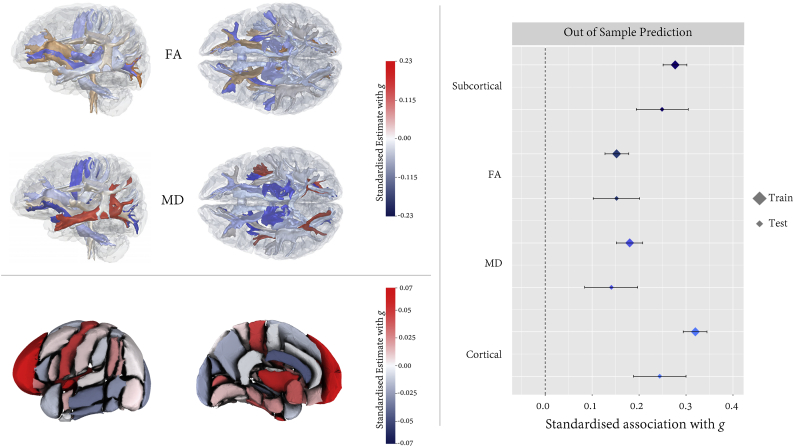
The associations between indices of brain structure and measured intelligence are unclear. This is partly because the evidence to-date comes from mostly small and heterogeneous studies. Here, we report brain structure-intelligence associations on a large sample from the UK Biobank study. The overall N = 29,004, with N = 18,426 participants providing both brain MRI and at least one cognitive test, and a complete four-test battery with MRI data available in a minimum N = 7201, depending upon the MRI measure. Participants' age range was 44-81 years (M = 63.13, SD = 7.48). A general factor of intelligence (g) was derived from four varied cognitive tests, accounting for one third of the variance in the cognitive test scores. The association between (age- and sex- corrected) total brain volume and a latent factor of general intelligence is r = 0.276, 95% C.I. = [0.252, 0.300]. A model that incorporated multiple global measures of grey and white matter macro- and microstructure accounted for more than double the g variance in older participants compared to those in middle-age (13.6% and 5. 4%, respectively). There were no sex differences in the magnitude of associations between g and total brain volume or other global aspects of brain structure. The largest brain regional correlates of g were volumes of the insula, frontal, anterior/superior and medial temporal, posterior and paracingulate, lateral occipital cortices, thalamic volume, and the white matter microstructure of thalamic and association fibres, and of the forceps minor. Many of these regions exhibited unique contributions to intelligence, and showed highly stable out of sample prediction.
Keywords: Brain; Cortex; Intelligence; Subcortical; White matter.
© 2019 The Authors.
Figures

References
-
- Basten U., Hilger K., Fiebach C.J. Where smart brains are different: A quantitative meta-analysis of functional and structural brain imaging studies on intelligence. Intelligence. 2015;51:10–27.
-
- Behrens T.E.J., Johansen-Berg H., Woolrich M.W., Smith S.M., Wheeler-Kingshot C.A., Boulby P.A.…Matthews P.M. Non-invasive mapping of connections between human thalamus and cortex using diffusion imaging. Nature Neuroscience. 2003;6:750–757. - PubMed
-
- Benjamini Y., Hochberg Y. Controlling the false discovery rate: A practical and powerful approach to multiple testing. Journal of the Royal Statistical Society B. 1995;57:289–300.
Grants and funding
- MC_QA137853/MRC_/Medical Research Council/United Kingdom
- R01 AG054628/AG/NIA NIH HHS/United States
- MR/K026992/1/MRC_/Medical Research Council/United Kingdom
- R01 HD083613/HD/NICHD NIH HHS/United States
- MC_PC_12028/MRC_/Medical Research Council/United Kingdom
- MC_PC_17228/MRC_/Medical Research Council/United Kingdom
- MR/L023784/2/MRC_/Medical Research Council/United Kingdom
- MR/M013111/1/MRC_/Medical Research Council/United Kingdom
- G1001245/MRC_/Medical Research Council/United Kingdom
- MR/R024065/1/MRC_/Medical Research Council/United Kingdom
- P2C HD042849/HD/NICHD NIH HHS/United States
LinkOut - more resources
Full Text Sources
Other Literature Sources