

The Indispensable Role of Histone Methyltransferase Po Dot1 in Extracellular Glycoside Hydrolase Biosynthesis of Penicillium oxalicum
- PMID: 31787956
- PMCID: PMC6853848
- DOI: 10.3389/fmicb.2019.02566
The Indispensable Role of Histone Methyltransferase Po Dot1 in Extracellular Glycoside Hydrolase Biosynthesis of Penicillium oxalicum
Abstract
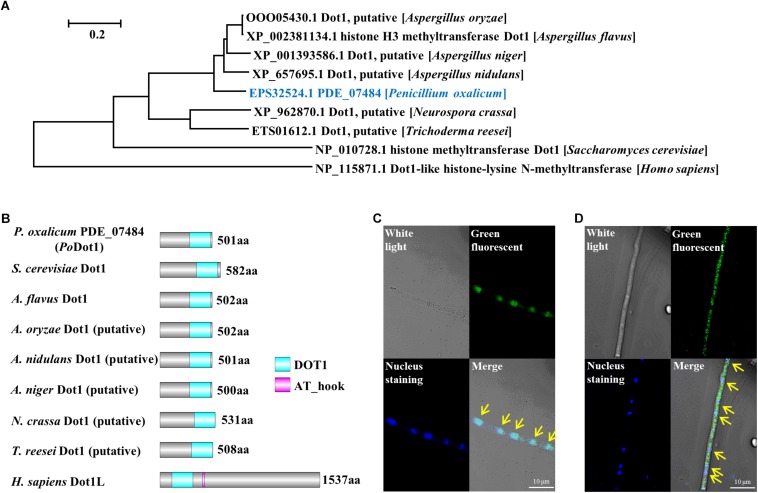
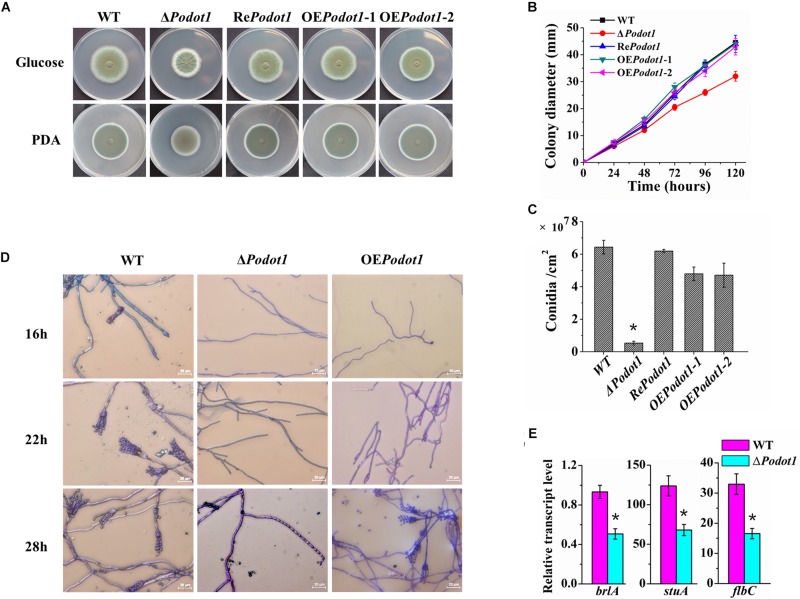
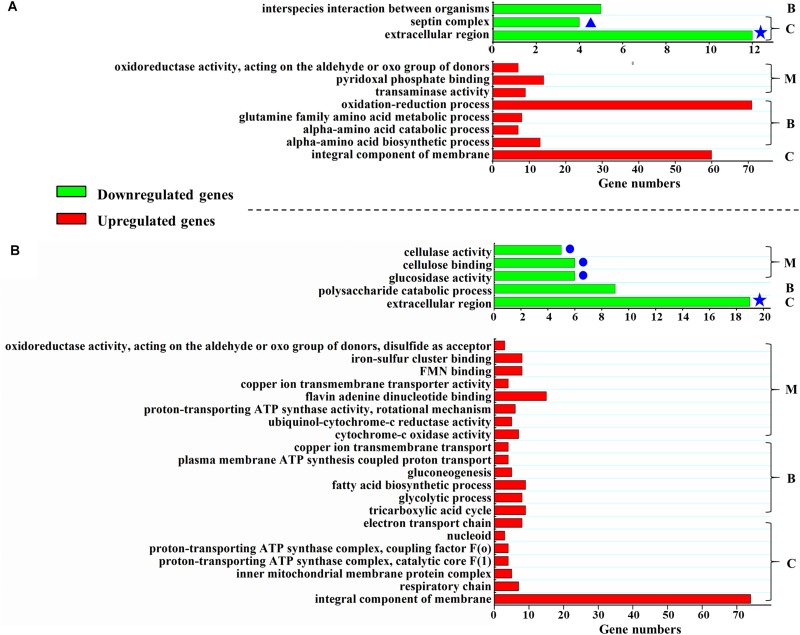
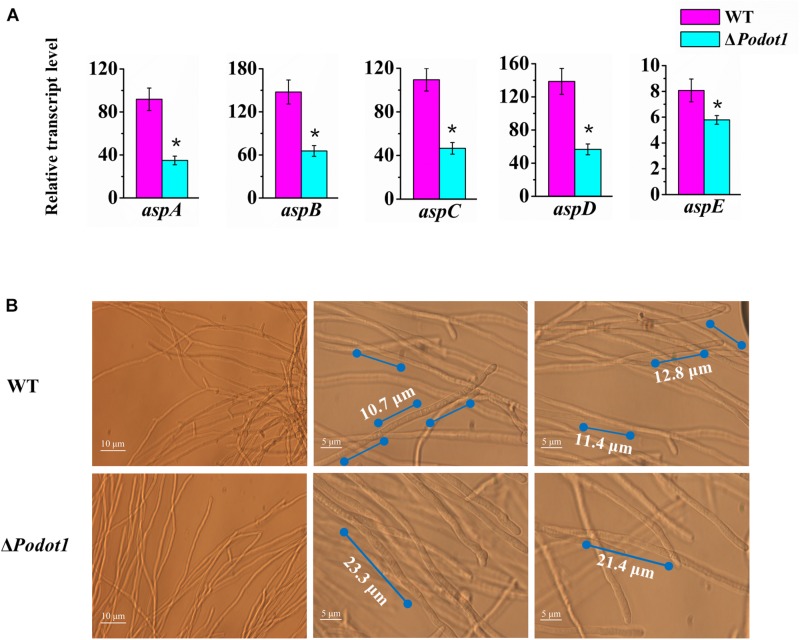
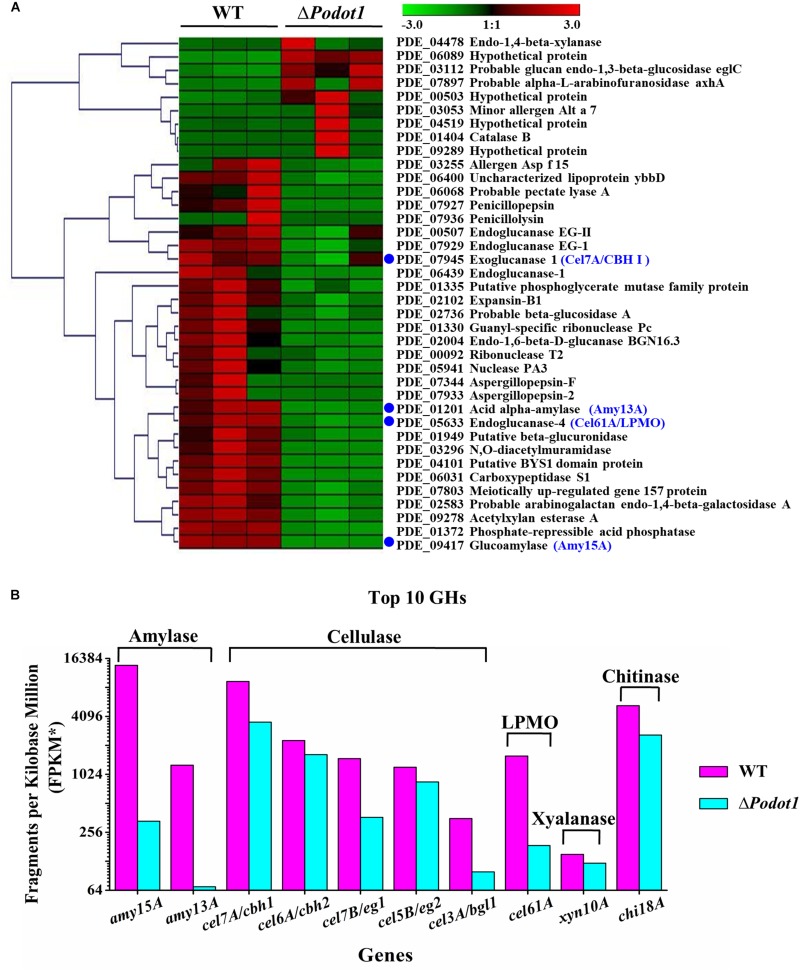
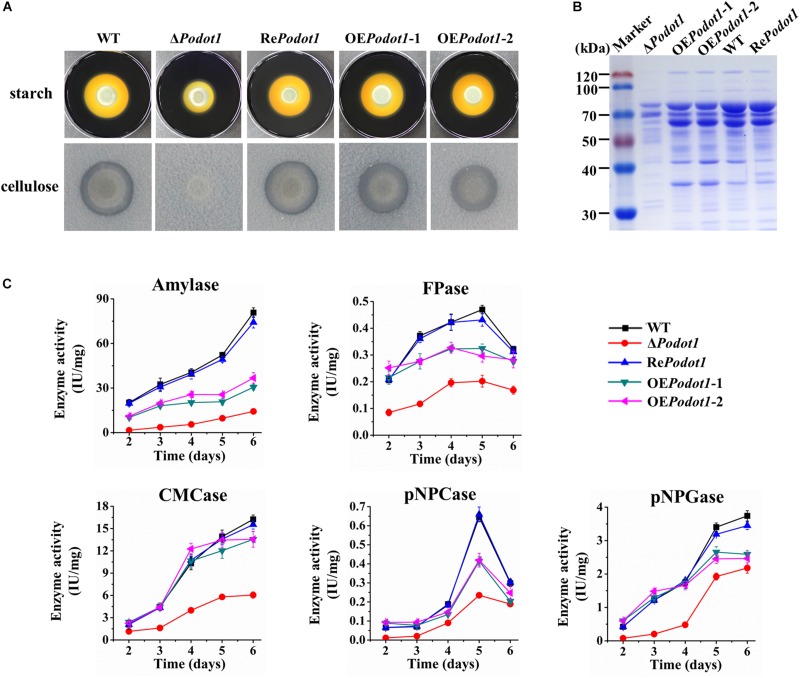
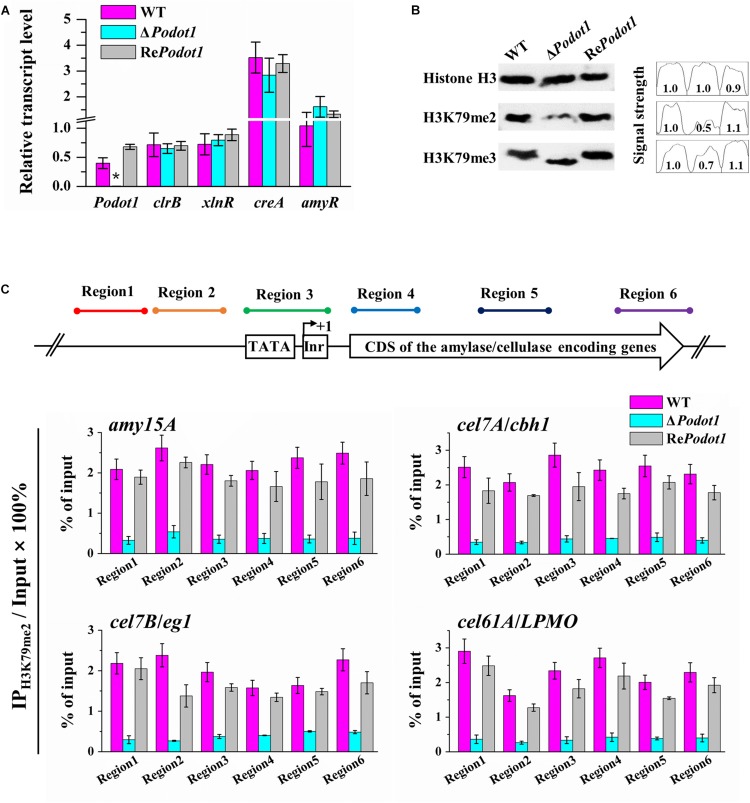
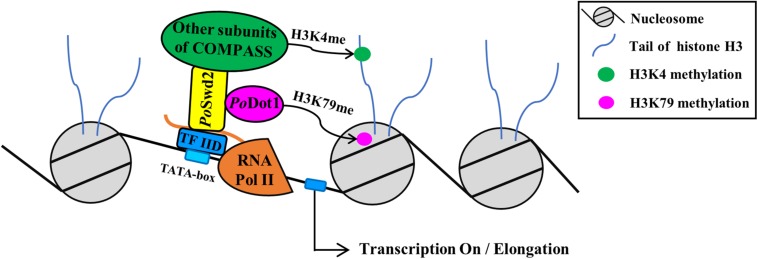
Histone methylation is associated with transcription regulation, but its role for glycoside hydrolase (GH) biosynthesis is still poorly understood. We identified the histone H3 lysine 79 (H3K79)-specific methyltransferase PoDot1 in Penicillium oxalicum. PoDot1 affects conidiation by regulating the transcription of key regulators (BrlA, FlbC, and StuA) of asexual development and is required in normal hyphae septum and branch formation by regulating the transcription of five septin-encoding genes, namely, aspA, aspB, aspC, aspD, and aspE. Tandem affinity purification/mass spectrometry showed that PoDot1 has no direct interaction with transcription machinery, but it affects the expressions of extracellular GH genes extensively. The expression of genes (amy15A, amy13A, cel7A/cbh1, cel61A, chi18A, cel3A/bgl1, xyn10A, cel7B/eg1, cel5B/eg2, and cel6A/cbh2) that encode the top 10 GHs was remarkably downregulated by Podot1 deletion (ΔPodot1). Consistent with the decrease in gene transcription level, the activities of amylases and cellulases were significantly decreased in ΔPodot1 mutants in agar (solid) and fermentation (liquid) media. The repression of GH gene expressions caused by PoDot1 deletion was not mediated by key transcription factors, such as AmyR, ClrB, CreA, and XlnR, but was accompanied by defects in global demethylated H3K79 (H3K79me2) and trimethylated H3K79 (H3K79me3). The impairment of H3K79me2 on specific GH gene loci was observed due to PoDot1 deletion. The results implies that defects of H3K79 methylation is the key reason of the downregulated transcription level of GH-encoding genes and reveals the indispensable role of PoDot1 in extracellular GH biosynthesis.
Keywords: Dot1; Penicillium oxalicum; glycoside hydrolases; histone methyltransferase; regulation.
Copyright © 2019 Li, Hu, Zhao, Pan, Qu, Zhao and Qin.
Figures
Similar articles
-
Expression and chromatin structures of cellulolytic enzyme gene regulated by heterochromatin protein 1.Biotechnol Biofuels. 2016 Oct 3;9:206. doi: 10.1186/s13068-016-0624-9. eCollection 2016. Biotechnol Biofuels. 2016. PMID: 27729944 Free PMC article.
-
Histone H2B lysine 122 and lysine 130, as the putative targets of Penicillium oxalicum LaeA, play important roles in asexual development, expression of secondary metabolite gene clusters, and extracellular glycoside hydrolase synthesis.World J Microbiol Biotechnol. 2024 Apr 26;40(6):179. doi: 10.1007/s11274-024-03978-0. World J Microbiol Biotechnol. 2024. PMID: 38668807
-
Functional characterization of protein kinase CK2 regulatory subunits regulating Penicillium oxalicum asexual development and hydrolytic enzyme production.Fungal Genet Biol. 2014 May;66:44-53. doi: 10.1016/j.fgb.2014.02.007. Epub 2014 Mar 5. Fungal Genet Biol. 2014. PMID: 24613994
-
[DOT1: a distinct class of histone lysine methyltransferase].Yi Chuan. 2007 Dec;29(12):1449-54. Yi Chuan. 2007. PMID: 18065378 Review. Chinese.
-
The many faces of histone H3K79 methylation.Mutat Res Rev Mutat Res. 2016 Apr-Jun;768:46-52. doi: 10.1016/j.mrrev.2016.03.005. Epub 2016 Mar 31. Mutat Res Rev Mutat Res. 2016. PMID: 27234562 Free PMC article. Review.
Cited by
-
Regulatory Roles of Histone Modifications in Filamentous Fungal Pathogens.J Fungi (Basel). 2022 May 25;8(6):565. doi: 10.3390/jof8060565. J Fungi (Basel). 2022. PMID: 35736048 Free PMC article. Review.
-
Enhanced oxidative stress resistance in Ustilago maydis and its implications on the virulence.Int Microbiol. 2024 Oct;27(5):1501-1511. doi: 10.1007/s10123-024-00489-8. Epub 2024 Feb 24. Int Microbiol. 2024. PMID: 38401003 Free PMC article.
-
Carbon catabolite repression involves physical interaction of the transcription factor CRE1/CreA and the Tup1-Cyc8 complex in Penicillium oxalicum and Trichoderma reesei.Biotechnol Biofuels. 2021 Dec 24;14(1):244. doi: 10.1186/s13068-021-02092-9. Biotechnol Biofuels. 2021. PMID: 34952627 Free PMC article.
-
Quantitative Proteome Profiling Reveals Cellobiose-Dependent Protein Processing and Export Pathways for the Lignocellulolytic Response in Neurospora crassa.Appl Environ Microbiol. 2020 Jul 20;86(15):e00653-20. doi: 10.1128/AEM.00653-20. Print 2020 Jul 20. Appl Environ Microbiol. 2020. PMID: 32471912 Free PMC article.
-
A Homeodomain-Containing Transcriptional Factor PoHtf1 Regulated the Development and Cellulase Expression in Penicillium oxalicum.Front Microbiol. 2021 Jun 10;12:671089. doi: 10.3389/fmicb.2021.671089. eCollection 2021. Front Microbiol. 2021. PMID: 34177850 Free PMC article.
References
-
- Arora D. K. (2004). Handbook of Fungal Biotechnology, Second Edition, Revised and Expanded. New York, NY: Marcel Dekker, Inc; 10.1201/9780203027356 - DOI
LinkOut - more resources
Full Text Sources
Other Literature Sources
Molecular Biology Databases