. 2019 Nov 7:10:2566.
doi: 10.3389/fimmu.2019.02566. eCollection 2019.

Soluble CD137 Ameliorates Acute Type 1 Diabetes by Inducing T Cell Anergy

Affiliations

Soluble CD137 Ameliorates Acute Type 1 Diabetes by Inducing T Cell Anergy

Arata Itoh et al. Front Immunol. .

Abstract

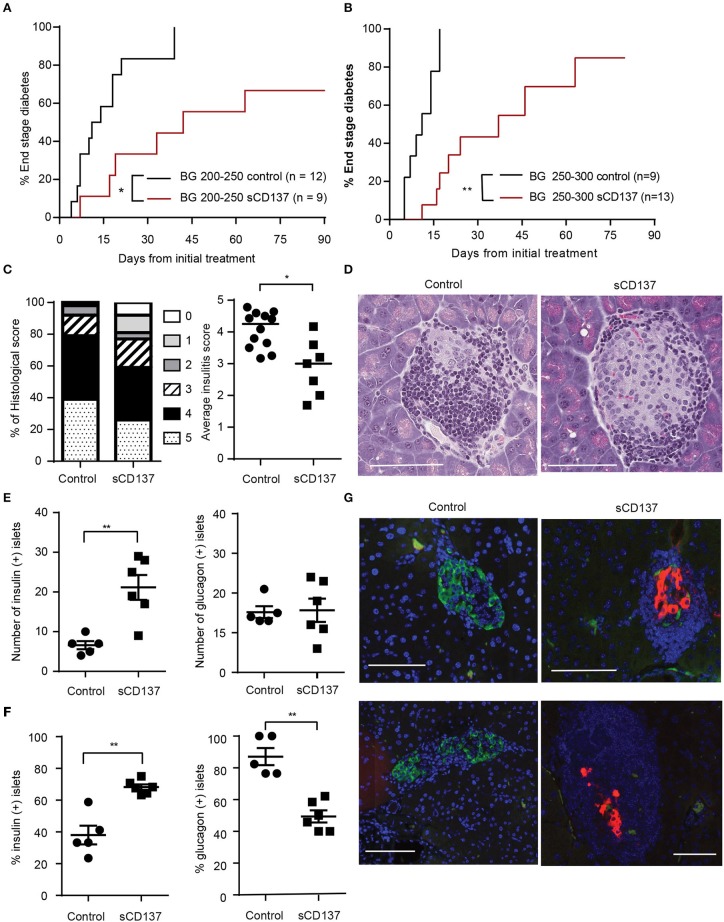
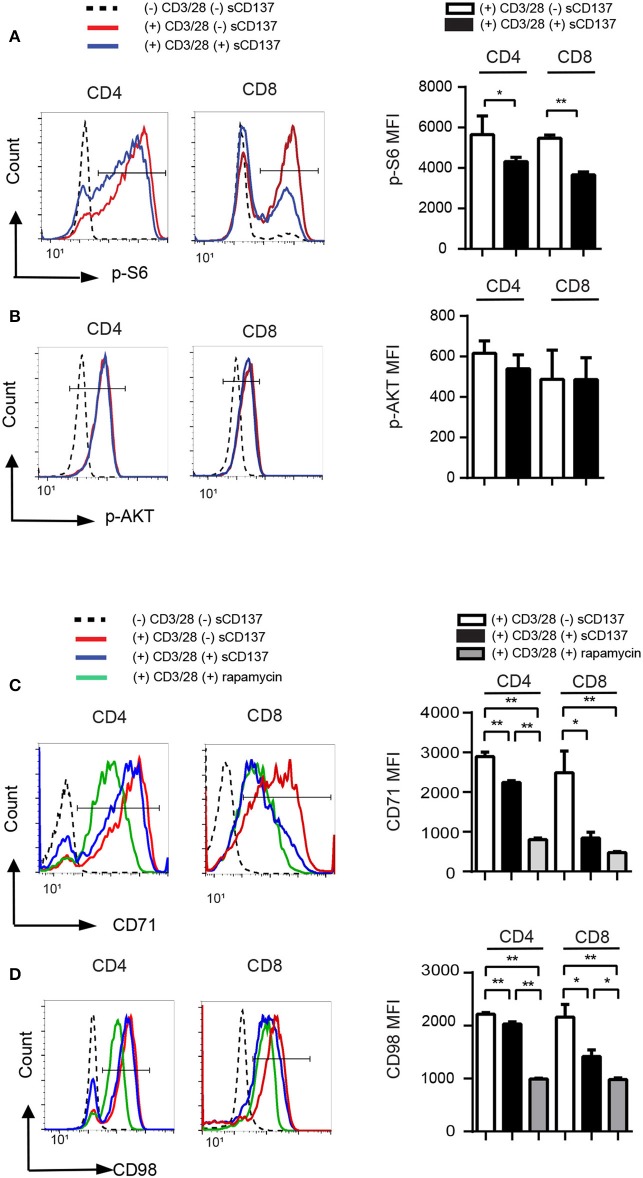
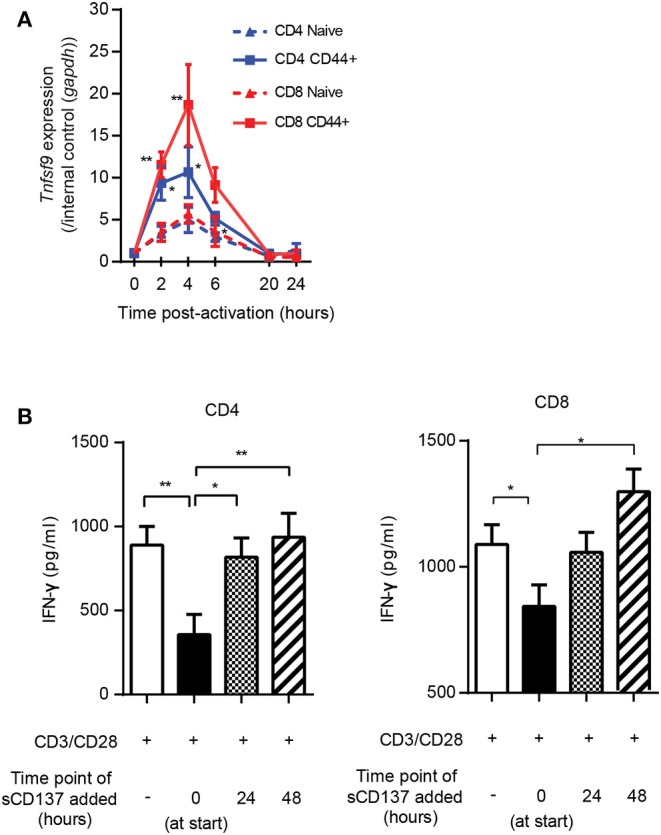
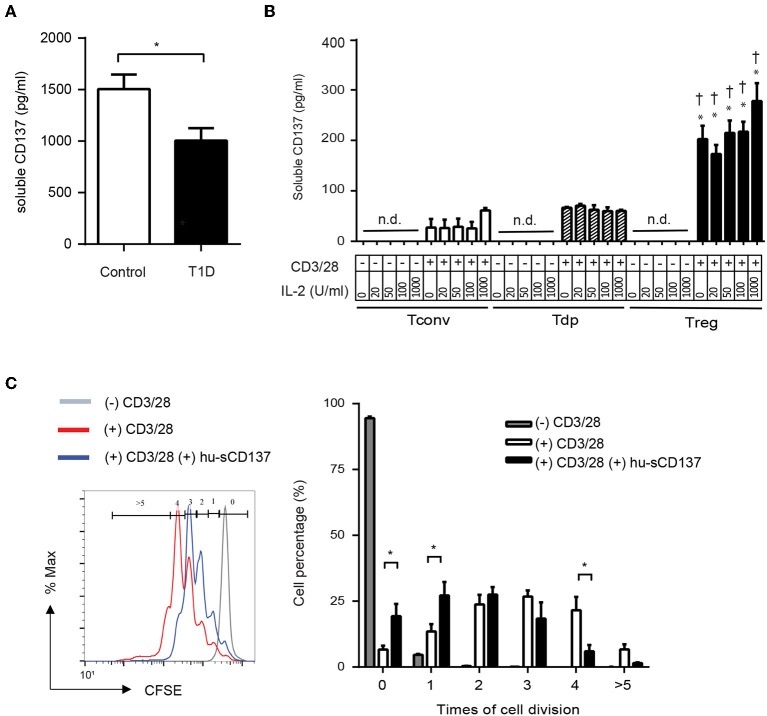
We show here that soluble CD137 (sCD137), the alternately spliced gene product of Tnfsfr9, effectively treats acute type 1 diabetes (T1D) in nonobese diabetic (NOD) mice. sCD137 significantly delayed development of end-stage disease, preserved insulin+ islet beta cells, and prevented progression to end-stage T1D in some mice. We demonstrate that sCD137 induces CD4+ T cell anergy, suppressing antigen-specific T cell proliferation and IL-2/IFN-γ secretion. Exogenous IL-2 reversed the sCD137 anergy effect. sCD137 greatly reduces inflammatory cytokine production by CD8 effector memory T cells, critical mediators of beta cell damage. We demonstrate that human T1D patients have decreased serum sCD137 compared to age-matched controls (as do NOD mice compared to NOD congenic mice expressing a protective Tnfsfr9 allele), that human sCD137 is secreted by regulatory T cells (Tregs; as in mice), and that human sCD137 induces T cell suppression in human T cells. These findings provide a rationale for further investigation of sCD137 as a treatment for T1D and other T cell-mediated autoimmune diseases.

Keywords: T cell anergy; T cells; autoimmunity; soluble CD137; type 1 diabetes.


Figures

Figure 1
Figure 1
Soluble CD137 (sCD137) ameliorates acute type 1 diabetes (T1D) in nonobese diabetic (NOD) mice. (A,B) Survival curves of acutely diabetic mice treated with sCD137 vs. controls. Female NOD mice were monitored until they became diabetic [blood glucose of (A) 200–250 mg/dl or (B) 250–300 mg/dl], and were then treated with sCD137 vs. untreated (A) or treated with PBS (B) (see methods). *p < 0.05, **p < 0.01, Mantel–Cox log-rank test. (C) Insulitis severity (see methods) in sCD137-treated mice (n = 7) that did not progress to end-stage T1D and control mice (n = 12) with end-stage diabetes. *p < 0.05, Mann–Whitney U-test. (D) Representative H&E-stained islets from each group. (E–G) The pancreatic islet was stained for insulin (red), glucagon (green), and nucleus (blue) and imaged by dual immunofluorescence in sCD137-treated mice (n = 6) compared to PBS-treated, end-stage diabetic mice (n = 5). The number (E) and percentages (F) of insulin- (E,F, left) and glucagon- (E,F, right) positive islets per section are shown. **p < 0.01, Mann–Whitney U-test (E) and unpaired t-test (F). (G) Representative islets from two independent sCD137- vs. PBS-treated mice showing insulin preservation in sCD137-treated mice. White bars = 100 μm.
Figure 2
Figure 2
sCD137 induces T cell anergy: IL-2 prevents and reverses sCD137 suppressive effect on antigen-specific T cell activation. (A,B) CD4+CD25– T cells and CD4-negative splenic antigen-presenting cells purified from non-diabetic NOD BDC2.5 transgenic mice were co-cultured with BDC2.5 peptide in the presence or absence of sCD137. In some wells, 25 U/ml of recombinant mouse IL-2 was added at the start (A) or 24 h (B) after starting cell culture. Cell proliferation was counted on a β-scintillation counter. Data expressed as mean/SEM from n = 3 (A) and n = 5 (B) independent samples in three independent experiments. *p < 0.05, **p < 0.01, unpaired t-test. (C) Magnetically isolated CD4 T cells were cultured with CD3/CD28 beads and sCD137 for 48 h, and cell cycle phases were analyzed by flow cytometry. Data expressed as mean/SEM, n = 4 mice. *p < 0.05, **p < 0.01, Mann–Whitney U-test. (D,E) MACS-bead-purified splenic NOD CD4+CD25– or CD8 T cells were stimulated with CD3/28 in the presence/absence of sCD137 for 24 h. After 24 h, supernatant was collected, and IL-2 (D) and IFN-ɤ (E) concentration was measured by ELISA. Data expressed as mean/SEM from three biologically independent experimental samples. (F) Differentiated Th1 cells (1 × 10⁶) were stimulated for 24 h with CD3/28 beads, in the presence and absence of sCD137, with or without IL-2. Cells were then washed and rested in fresh cell culture media without IL-2 for 48 h, and then 0.5 × 10⁵ rested living cells were restimulated for 24 h with plate-bound aCD3Ab (0.5 μg/ml) and soluble CD28 Ab (0.5 μg/ml). IL-2 in supernatant was measured by ELISA. Data expressed as mean and standard errors of mean from three independent experiments. **p < 0.01, unpaired t-test.
Figure 3
Figure 3
sCD137-mediated suppression associated with reduced mTORC1 pathway activation; no effect on Akt pathway. NOD CD4+CD25– or CD8 T cells were stimulated with CD3/28 beads in the presence of sCD137 or rapamycin for 24 h. After 24 h culture, cells were harvested, and intracellular or cell-surface proteins were stained and analyzed as described in the Materials and Methods section. One representative histogram of intracellular p-S6 (A), p-AKT (B), cell-surface CD71 (C), and CD98 (D) expression in CD4+CD25– and CD8+ cells is shown. Geometric MFI (far right) of the indicated populations is shown as mean/SEM from three to four biologically independent experimental samples. *p < 0.05, **p < 0.01, unpaired t-test.
Figure 4
Figure 4
Kinetics of CD137L upregulation; sCD137 suppresses T cell cytokine production only when administered within 24 h of T cell activation. (A) The kinetic profile of Tnfsf9 gene expression in naïve (CD44–) and memory (CD44+) T cells stimulated with CD3/28 beads from three independent experiments. RT-PCR data were normalized based on the expression in each subset at 0 h (baseline). *p < 0.05 vs. naïve CD4, **p < 0.05 vs. naïve CD8, ANOVA. (B) NOD CD4+ or CD8+ T cells were stimulated with CD3/CD28 dynabeads and cultured with sCD137 added at indicated time points. After a total of 72 h culture, supernatant was collected and IFN-ɤ concentration measured by ELISA. Data expressed as mean and standard errors of mean from three biologically independent experiments and analyzed by ANOVA. *p < 0.05, **p < 0.01.
Figure 5
Figure 5
Differential effect of sCD137 on cytokine production; CD8 effector memory T cells have the greatest reduction in cytokine expression. (A,B) Naïve (CD62LhighCD44low), central memory (CD62LhighCD44high), and effector memory (CD62Llow CD44high) subsets were sorted from NOD CD4 or CD8 T cells and cultured with CD3/CD28 beads and sCD137 for 24 h. IL-2 (A) and IFN-ɤ (B) concentrations were measured by ELISA. Overall reduction of IL-2 or IFN-ɤ was calculated by subtraction of total cytokine in the sCD137-treated group from the cytokine level in the CD3/28 group in each individual experiment (n = 3 experiments). *p < 0.05, **p < 0.01, unpaired t-test. CM, central memory subset; EM, effector memory subset.
Figure 6
Figure 6
Human T1D patients have decreased serum sCD137 levels, and sCD137 is secreted from human regulatory T cells. Human sCD137 suppresses human T cell proliferation. (A) sCD137 concentration in serum from pediatric type 1 diabetic patients (n = 11) or age-matched controls without T1D (n = 10) (all subjects were ages 2–18 years) was measured by ELISA. *p = 0.03, unpaired t-test. (B) Human CD4+CD25lowCD127high conventional T cells (Tconvs), CD4+CD25highCD127high double positive T cells (Tdps), and CD4+CD25highCD127low regulatory T cells (Tregs) from healthy donors were stimulated as indicated for 72 h. Supernatant was collected and human sCD137 concentration measured by ELISA. Data were expressed as mean/SEM from four subjects. *p < 0.01 vs. Tconv in each dose of IL-2, p < 0.01 vs. Tdp in each dose of IL-2, unpaired t-test. n.d., not detected. (C) carboxyfluorescein succinimidyl ester (CFSE)–labeled human CD4+ Tconv cells were stimulated with CD3/28 dynabeads in the presence or absence of hu-sCD137 for 3 days. CFSE dilution was analyzed on FACSCanto. One representative histogram (left panel) of CFSE is shown. Percentages of cells with the indicated number of cell divisions (gated as shown in the histogram) are shown in the right bar graph. Data expressed as average/SEM of n = 5 independent samples *p < 0.01, unpaired t-test.

References

    1. Bach JF. Insulin-dependent diabetes mellitus as an autoimmune disease. Endocr Rev. (1994) 15:516–42. 10.1210/edrv-15-4-516 - DOI - PubMed
    1. Atkinson MA, Eisenbarth GS, Michels AW. Type 1 diabetes. Lancet. (2014) 383:69–82. 10.1016/S0140-6736(13)60591-7 - DOI - PMC - PubMed
    1. Ridgway WM. Dissecting genetic control of autoimmunity in NOD congenic mice. Immunol Res. (2006) 36:189–95. 10.1385/IR:36:1:189 - DOI - PMC - PubMed
    1. Aoki CA, Borchers AT, Ridgway WM, Keen CL, Ansari AA, Gershwin ME. NOD mice and autoimmunity. Autoimmun Rev. (2005) 4:373–9. 10.1016/j.autrev.2005.02.002 - DOI - PubMed
    1. Yoon JW, Jun HS. Cellular and molecular pathogenic mechanisms of insulin-dependent diabetes mellitus. Ann N Y Acad Sci. (2001) 928:200–11. 10.1111/j.1749-6632.2001.tb05650.x - DOI - PubMed

Publication types

MeSH terms

Substances