

Assaying Homodimers of NF-κB in Live Single Cells
- PMID: 31787981
- PMCID: PMC6853996
- DOI: 10.3389/fimmu.2019.02609
Assaying Homodimers of NF-κB in Live Single Cells
Abstract
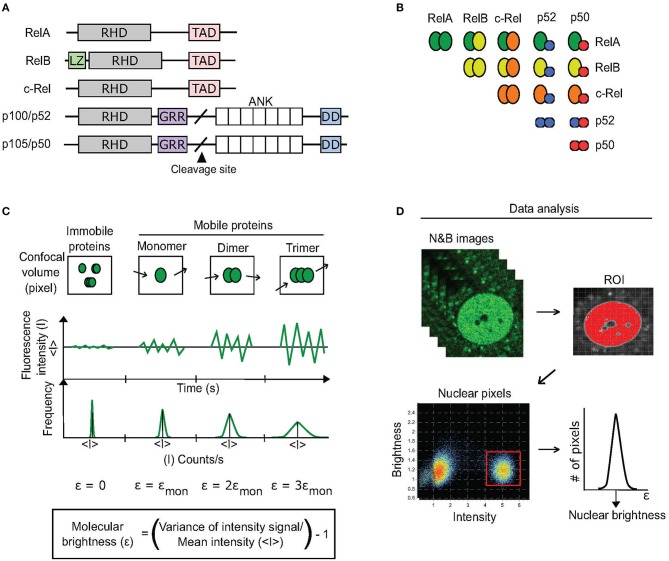
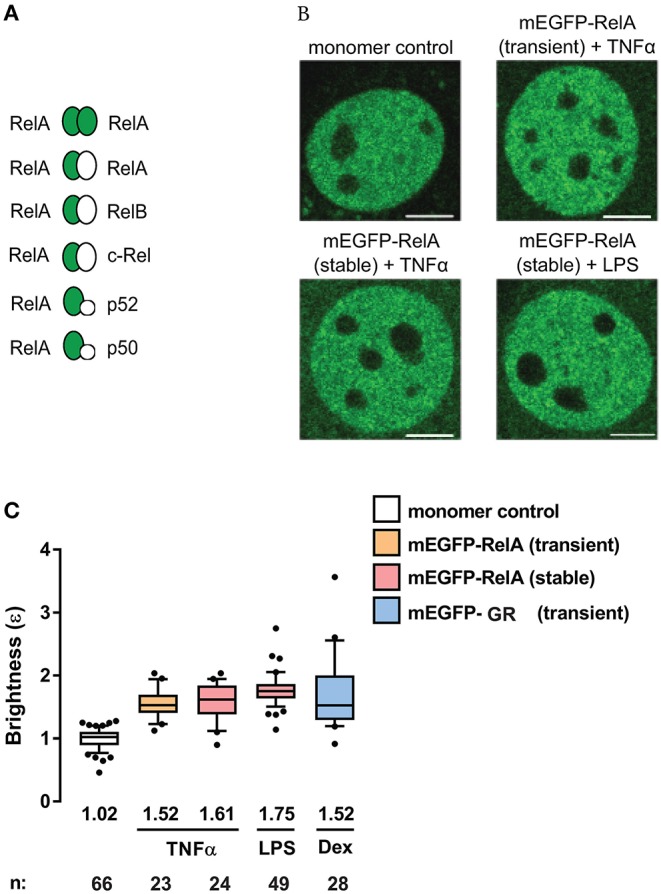
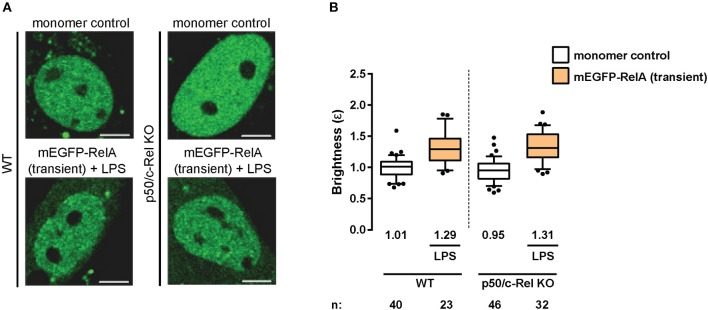
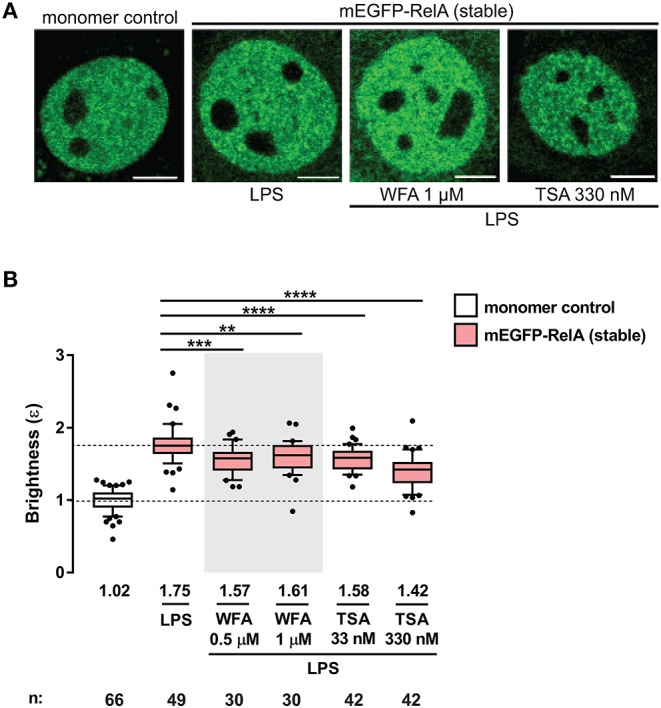
NF-κB is a family of heterodimers and homodimers which are generated from subunits encoded by five genes. The predominant classical dimer RelA:p50 is presumed to operate as "NF-κB" in many contexts. However, there are several other dimer species which exist and may even be more functionally relevant in specific cell types. Accurate characterization of stimulus-specific and tissue-specific dimer repertoires is fundamentally important for understanding the downstream gene regulation by NF-κB proteins. In vitro assays such as immunoprecipitation have been widely used to analyze subunit composition, but these methods do not provide information about dimerization status within the natural intracellular environment of intact live cells. Here we apply a live single cell microscopy technique termed Number and Brightness to examine dimers translocating to the nucleus in fibroblasts after pro-inflammatory stimulation. This quantitative assay suggests that RelA:RelA homodimers are more prevalent than might be expected. We also found that the relative proportion of RelA:RelA homodimers can be perturbed by small molecule inhibitors known to disrupt the NF-κB pathway. Our findings show that Number and Brightness is a useful method for investigating NF-κB dimer species in live cells. This approach may help identify the relevant targets in pathophysiological contexts where the dimer specificity of NF-κB intervention is desired.
Keywords: NF-κB; RelA; dimerization; microscopy; number and brightness; oligomerization; transcription factor.
Copyright © 2019 Martin, Chakraborty, Presman, Tomassoni Ardori, Oh, Kaileh, Tessarollo and Sung.
Figures
Similar articles
-
Domain Stability Regulated through the Dimer Interface Controls the Formation Kinetics of a Specific NF-κB Dimer.Biochemistry. 2021 Feb 23;60(7):513-523. doi: 10.1021/acs.biochem.0c00837. Epub 2021 Feb 8. Biochemistry. 2021. PMID: 33555182
-
Activation of RelA homodimers by tumour necrosis factor alpha: a possible transcriptional activator in human vascular endothelial cells.Biochem J. 2005 Aug 15;390(Pt 1):317-24. doi: 10.1042/BJ20041659. Biochem J. 2005. PMID: 15876188 Free PMC article.
-
Immortalized embryonic mouse fibroblasts lacking the RelA subunit of transcription factor NF-kappaB have a malignantly transformed phenotype.Oncogene. 2002 Apr 11;21(16):2484-92. doi: 10.1038/sj.onc.1205333. Oncogene. 2002. PMID: 11971183
-
[The structure of NF- kappaB family proteins and their role in apoptosis].Postepy Hig Med Dosw (Online). 2008 Feb 15;62:64-74. Postepy Hig Med Dosw (Online). 2008. PMID: 18283237 Review. Polish.
-
Regulation of DNA binding by Rel/NF-kappaB transcription factors: structural views.Oncogene. 1999 Nov 22;18(49):6845-52. doi: 10.1038/sj.onc.1203224. Oncogene. 1999. PMID: 10602460 Review.
Cited by
-
Double knockin mice show NF-κB trajectories in immune signaling and aging.Cell Rep. 2022 Nov 22;41(8):111682. doi: 10.1016/j.celrep.2022.111682. Cell Rep. 2022. PMID: 36417863 Free PMC article.
-
NF-κB, a culprit of both inflamm-ageing and declining immunity?Immun Ageing. 2022 May 17;19(1):20. doi: 10.1186/s12979-022-00277-w. Immun Ageing. 2022. PMID: 35581646 Free PMC article. Review.
-
Whole genome sequencing of CRISPR/Cas9-engineered NF-κB reporter mice for validation and variant discovery.Sci Data. 2024 Nov 13;11(1):1225. doi: 10.1038/s41597-024-04064-8. Sci Data. 2024. PMID: 39537647 Free PMC article.
-
NF-κB dynamics in the language of immune cells.Trends Immunol. 2023 Jan;44(1):32-43. doi: 10.1016/j.it.2022.11.005. Epub 2022 Dec 3. Trends Immunol. 2023. PMID: 36473794 Free PMC article. Review.
-
Aberrant expression and localization of the RAP1 shelterin protein contribute to age-related phenotypes.PLoS Genet. 2022 Nov 28;18(11):e1010506. doi: 10.1371/journal.pgen.1010506. eCollection 2022 Nov. PLoS Genet. 2022. PMID: 36441670 Free PMC article.
References
Publication types
MeSH terms
Substances
LinkOut - more resources
Full Text Sources
Molecular Biology Databases
Research Materials