

Identification of biomarkers and construction of a microRNA-mRNA regulatory network for ependymoma using integrated bioinformatics analysis
- PMID: 31788082
- PMCID: PMC6865127
- DOI: 10.3892/ol.2019.10941
Identification of biomarkers and construction of a microRNA-mRNA regulatory network for ependymoma using integrated bioinformatics analysis
Abstract
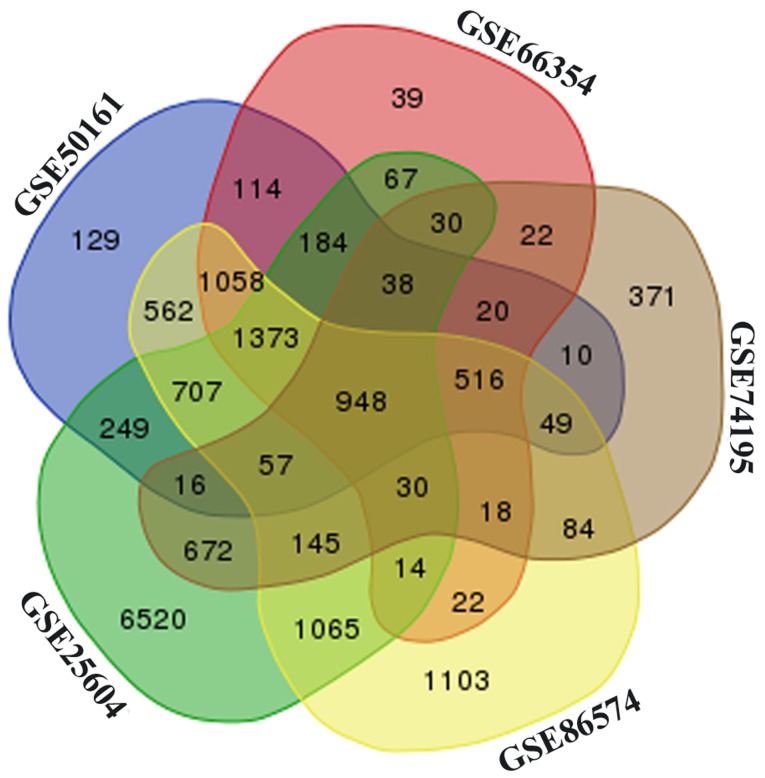
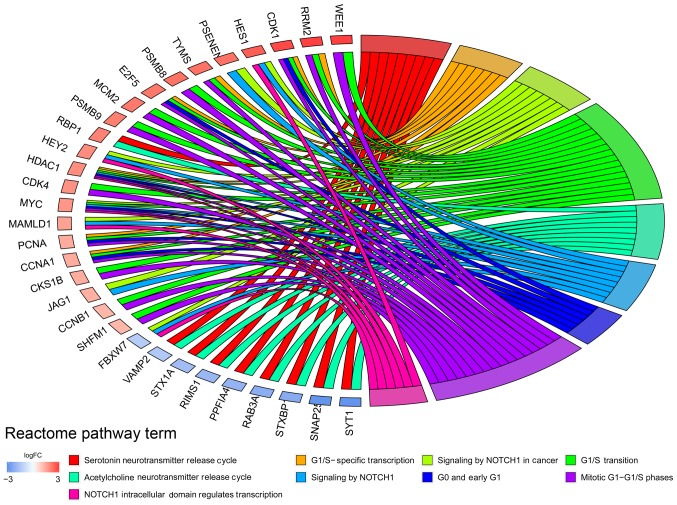
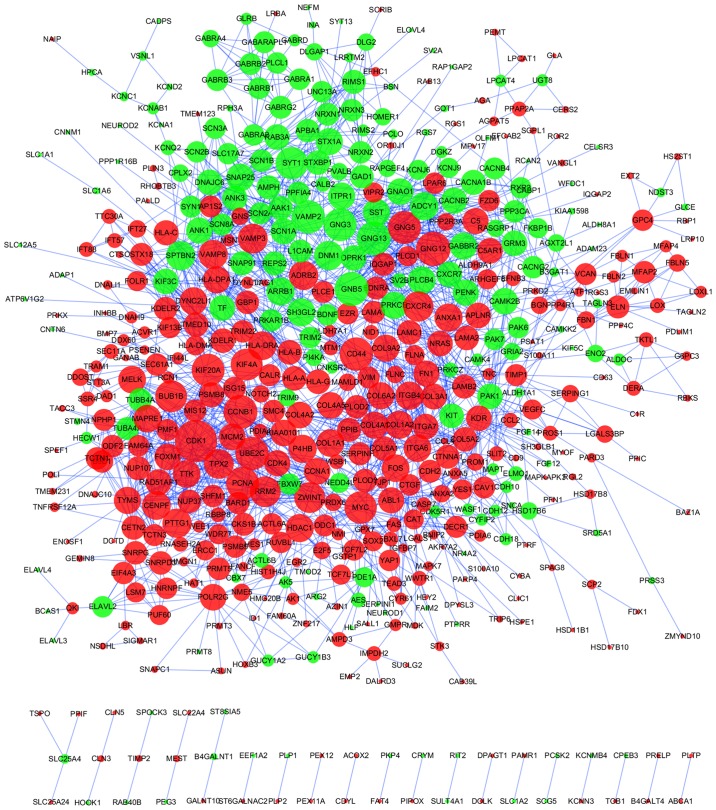
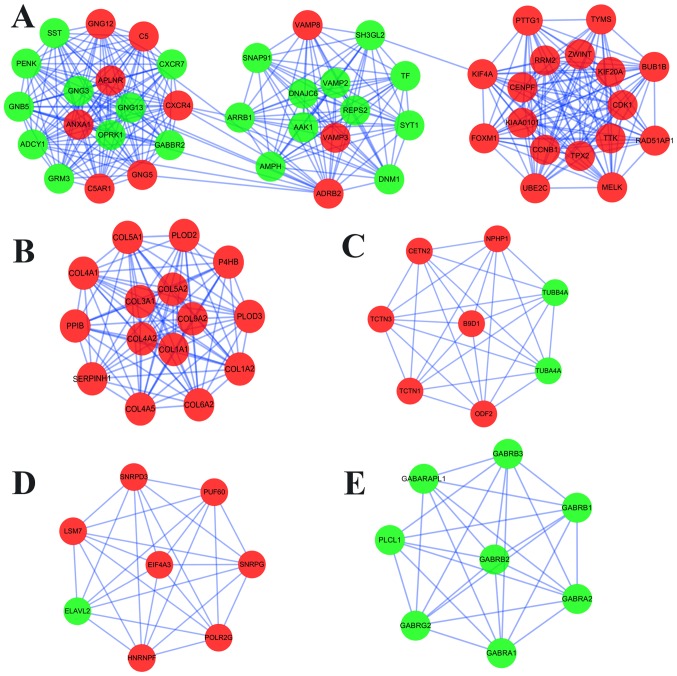
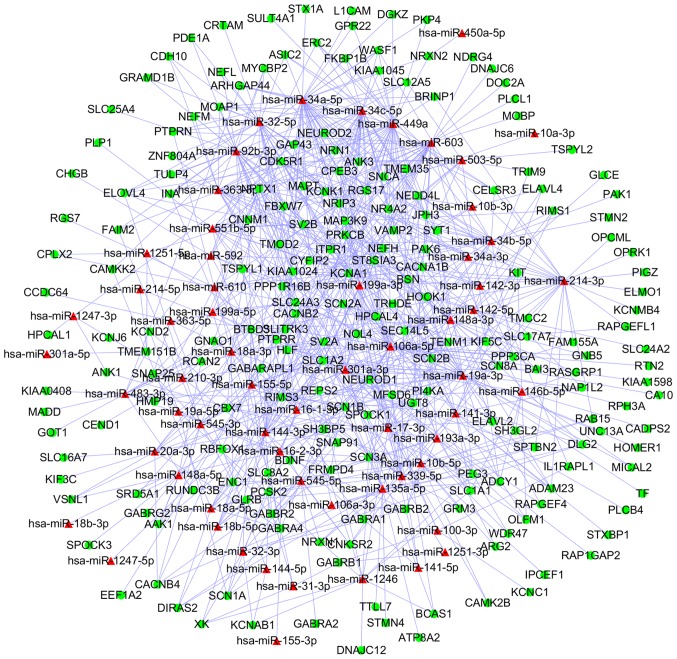
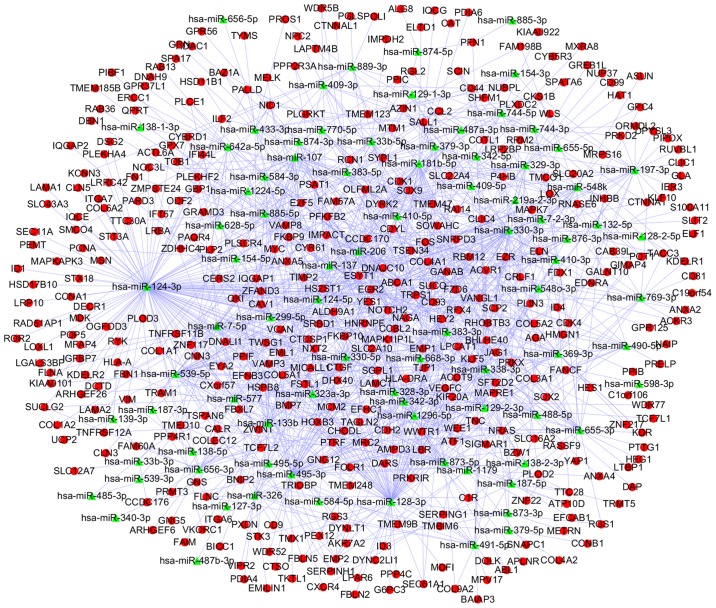
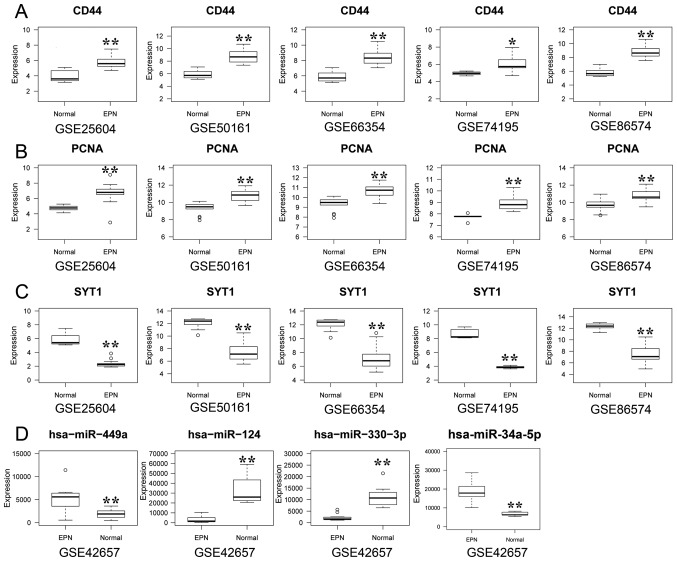
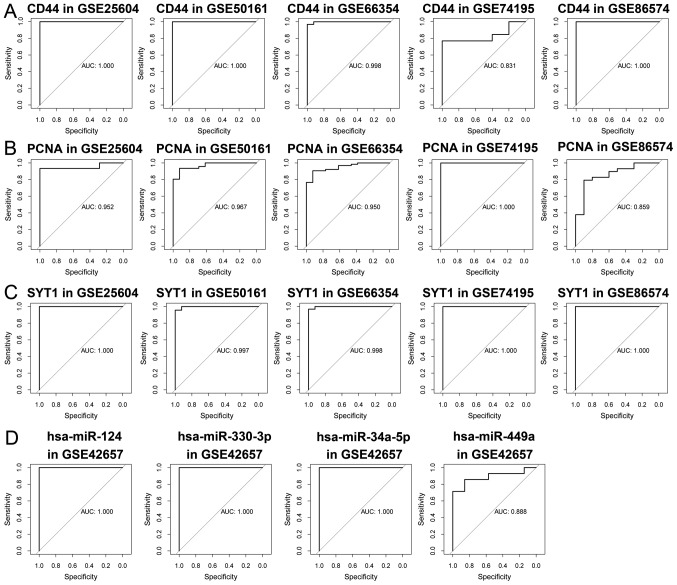
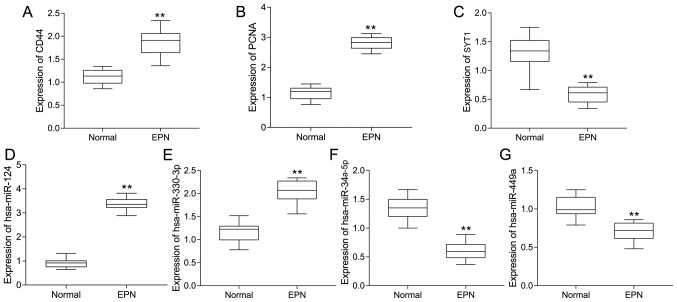
Ependymomas (EPNs) are one of the most common types of malignant neuroepithelial tumors. In an effort to identify potential biomarkers involved in the pathogenesis of EPN, the mRNA expression profiles of the GSE25604, GSE50161, GSE66354, GSE74195 and GSE86574 datasets, in addition to the microRNA (miRNA/miR) expression profiles of GSE42657 were downloaded from the Gene Expression Omnibus (GEO) database. Differentially expressed genes (DEGs) and differentially expressed miRNAs (DEMs) between EPN and normal brain tissue samples were identified using the Limma package in R and GEO2R, respectively. Functional and pathway enrichment analyses were conducted using the Database for Annotation, Visualization and Integrated Discovery. A protein-protein interaction network was constructed using the Search Tool for Retrieval of Interacting Genes database, which was visualized using Cytoscape. The targeted genes of DEMs were predicted using miRWalk2.0 and a miRNA-mRNA regulatory network was constructed. Following analysis, a total of 948 DEGs and 129 DEMs were identified. Functional enrichment analysis revealed that 609 upregulated DEGs were significantly enriched in 'PI3K-Akt signaling pathway', while 339 downregulated DEGs were primarily involved in 'cell junction' and 'retrograde endocannabinoid signaling'. In addition, 6 hub genes [cyclin dependent kinase 1, CD44 molecule (Indian blood group) (CD44), proliferating cell nuclear antigen (PCNA), MYC, synaptotagmin 1 (SYT1) and kinesin family member 4A] and 6 crucial miRNAs [homo sapiens (hsa)-miR-34a-5p, hsa-miR-449a, hsa-miR-106a-5p, hsa-miR-124-3p, hsa-miR-128-3p and hsa-miR-330-3p] were identified as biomarkers and potential therapeutic targets for EPN. Furthermore, a microRNA-mRNA regulatory network was constructed to highlight the interactions between DEMs and their target DEGs; this included the hsa-miR-449a-SYT1, hsa-miR-34a-5p-SYT1, hsa-miR-330-3p-CD44 and hsa-miR-124-3p-PCNA pairs, whose expression levels were confirmed using reverse transcription-quantitative polymerase chain reaction. In conclusion, the present study may provide important data for the investigation of the molecular mechanisms of EPN pathogenesis.
Keywords: differentially expressed gene; differentially expressed miRNA; ependymoma; module; regulatory network.
Copyright: © Yang et al.
Figures
Similar articles
-
Integrative analysis of gene and microRNA expression profiles reveals candidate biomarkers and regulatory networks in psoriasis.Medicine (Baltimore). 2024 Jul 19;103(29):e39002. doi: 10.1097/MD.0000000000039002. Medicine (Baltimore). 2024. PMID: 39028999 Free PMC article.
-
Using biological information to analyze potential miRNA-mRNA regulatory networks in the plasma of patients with non-small cell lung cancer.BMC Cancer. 2022 Mar 21;22(1):299. doi: 10.1186/s12885-022-09281-1. BMC Cancer. 2022. PMID: 35313857 Free PMC article.
-
Identification of miRNA-target gene regulatory networks in liver fibrosis based on bioinformatics analysis.PeerJ. 2021 Aug 6;9:e11910. doi: 10.7717/peerj.11910. eCollection 2021. PeerJ. 2021. PMID: 34434654 Free PMC article.
-
MicroRNA expression in male infertility.Reprod Fertil Dev. 2022 Jul;34(12):805-818. doi: 10.1071/RD21131. Reprod Fertil Dev. 2022. PMID: 35760398 Review.
-
Meta-Analysis of Differential miRNA Expression after Bariatric Surgery.J Clin Med. 2019 Aug 15;8(8):1220. doi: 10.3390/jcm8081220. J Clin Med. 2019. PMID: 31443156 Free PMC article. Review.
Cited by
-
MicroRNA (miR)-124: A Promising Therapeutic Gateway for Oncology.Biology (Basel). 2023 Jun 28;12(7):922. doi: 10.3390/biology12070922. Biology (Basel). 2023. PMID: 37508353 Free PMC article. Review.
-
Noncoding RNAs in pediatric brain tumors: Molecular functions and pathological implications.Mol Ther Nucleic Acids. 2021 Aug 8;26:417-431. doi: 10.1016/j.omtn.2021.07.024. eCollection 2021 Dec 3. Mol Ther Nucleic Acids. 2021. PMID: 34552822 Free PMC article. Review.
-
Human Patient-Derived Brain Tumor Models to Recapitulate Ependymoma Tumor Vasculature.Bioengineering (Basel). 2023 Jul 15;10(7):840. doi: 10.3390/bioengineering10070840. Bioengineering (Basel). 2023. PMID: 37508868 Free PMC article.
-
MicroRNA‑449a regulates the progression of brain aging by targeting SCN2B in SAMP8 mice.Int J Mol Med. 2020 Apr;45(4):1091-1102. doi: 10.3892/ijmm.2020.4502. Epub 2020 Feb 13. Int J Mol Med. 2020. PMID: 32124967 Free PMC article.
-
Identification of key genes unique to the luminal a and basal-like breast cancer subtypes via bioinformatic analysis.World J Surg Oncol. 2020 Oct 16;18(1):268. doi: 10.1186/s12957-020-02042-z. World J Surg Oncol. 2020. PMID: 33066779 Free PMC article.
References
-
- Ostrom QT, Gittleman H, de Blank PM, Finlay JL, Gurney JG, McKean-Cowdin R, Stearns DS, Wolff JE, Liu M, Wolinsky Y, et al. American brain tumor association adolescent and young adult primary brain and central nervous system tumors diagnosed in the united states in 2008–2012. Neuro Oncol. 2016;18(Suppl 1):i1–i50. doi: 10.1093/neuonc/nov297. - DOI - PMC - PubMed
-
- Li AM, Dunham C, Tabori U, Carret AS, McNeely PD, Johnston D, Lafay-Cousin L, Wilson B, Eisenstat DD, Jabado N, et al. EZH2 expression is a prognostic factor in childhood intracranial ependymoma: A Canadian Pediatric Brain Tumor Consortium study. Cancer. 2015;121:1499–1507. doi: 10.1002/cncr.29198. - DOI - PubMed
-
- Louis DN, Perry A, Reifenberger G, von Deimling A, Figarella-Branger D, Cavenee WK, Ohgaki H, Wiestler OD, Kleihues P, Ellison DW. The 2016 world health organization classification of tumors of the central nervous system: A summary. Acta neuropathol. 2016;131:803–820. doi: 10.1007/s00401-016-1545-1. - DOI - PubMed
LinkOut - more resources
Full Text Sources
Miscellaneous