

Mutant-allele tumor heterogeneity in malignant glioma effectively predicts neoplastic recurrence
- PMID: 31788085
- PMCID: PMC6865645
- DOI: 10.3892/ol.2019.10978
Mutant-allele tumor heterogeneity in malignant glioma effectively predicts neoplastic recurrence
Abstract
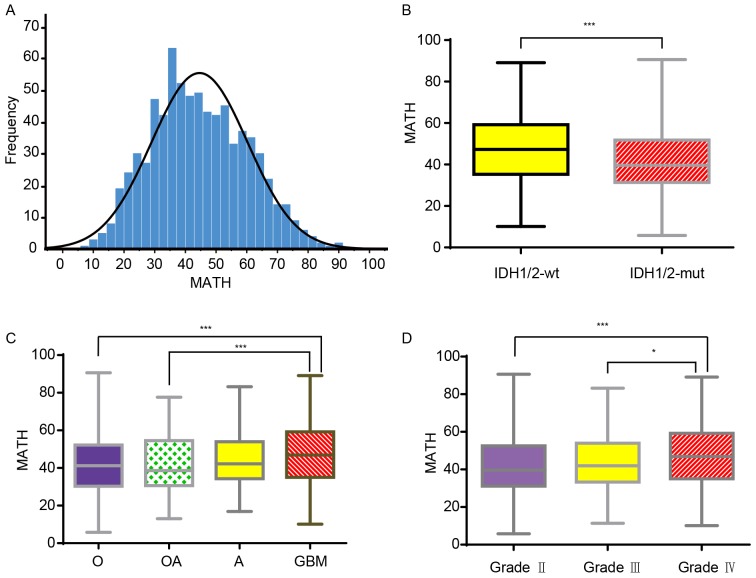
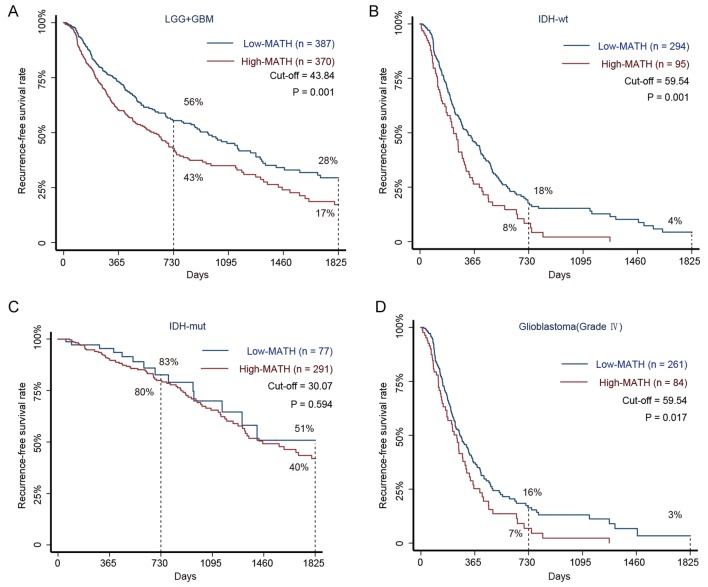
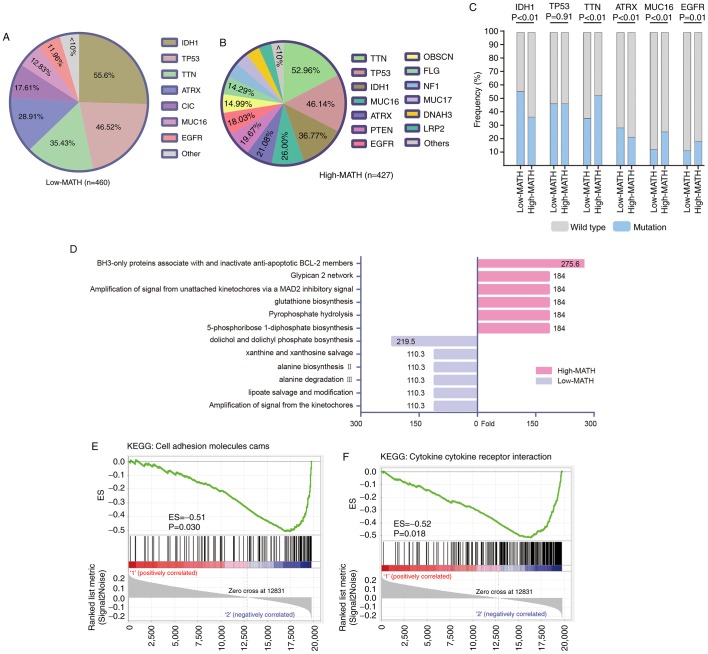
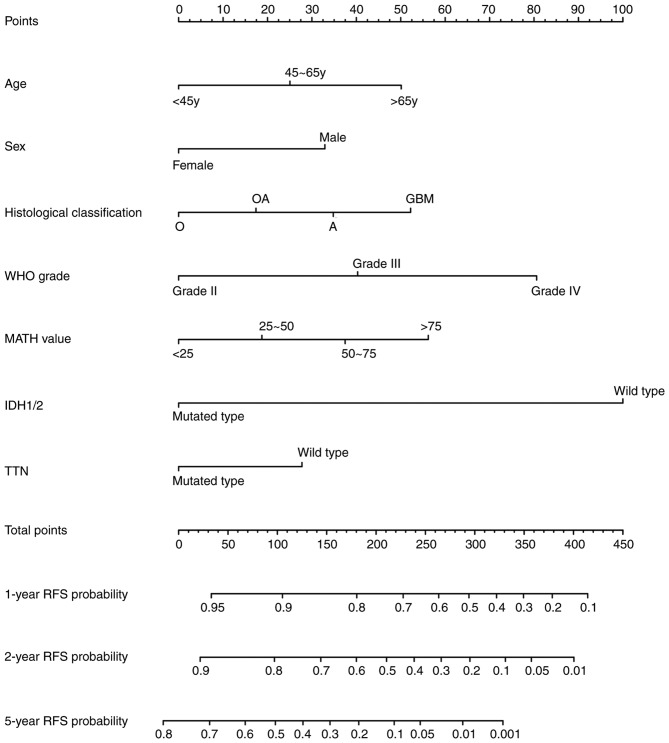
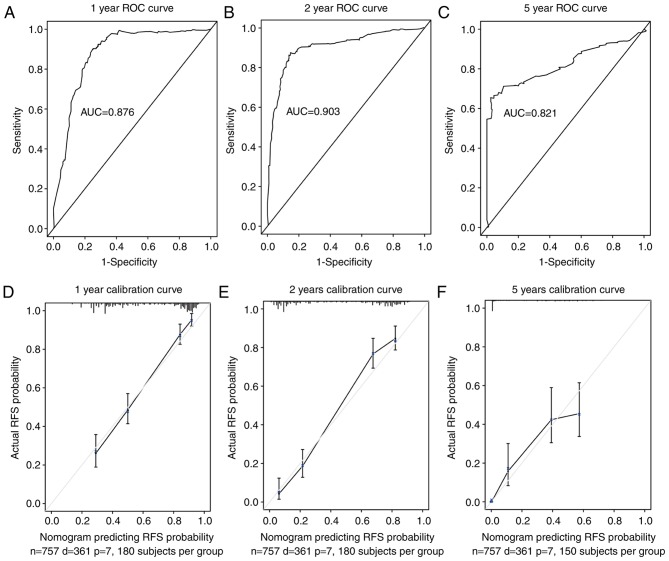
Intra-tumor heterogeneity (ITH) is one of the most important causes of therapy resistance, which eventually leads to the poor outcomes observed in patients with glioma. Mutant-allele tumor heterogeneity (MATH) values are based on whole-exon sequencing and precisely reflect genetic ITH. However, the significance of MATH values in predicting glioma recurrence remains unclear. Information of patients with glioma was obtained from The Cancer Genome Atlas database. The present study calculated the MATH value for each patient, analyzed the distributions of MATH values in different subtypes and investigated the rates of clinical recurrence in patients with different MATH values. Gene enrichment and Cox regression analyses were performed to determine which factors influenced recurrence. A nomogram table was established to predict 1-, 2- and 5-year recurrence probabilities. MATH values were increased in patients with glioma with the wild-type isocitrate dehydrogenase (NADP(+)) (IDH)1/2 (IDH-wt) gene (P=0.001) and glioblastoma (GBM; P=0.001). MATH values were negatively associated with the 2- and 5-year recurrence-free survival (RFS) rates in patients with glioma, particularly in the IDH1/2-wt and GBM cohorts (P=0.001 and P=0.017, respectively). Furthermore, glioma cases with different MATH levels had distinct patterns of gene mutation frequencies and gene expression enrichment. Finally, a nomogram table that contained MATH values could be used to accurately predict the probabilities of the 1-, 2- and 5-year RFS of patients with glioma. In conclusion, the MATH value of a patient may be an independent predictor that influences glioma recurrence. The nomogram model presented in the current study was an appropriate method to predict 1-, 2- and 5-year RFS probabilities in patients with glioma.
Keywords: glioma; intra-tumor heterogeneity; mutant-allele tumor heterogeneity; prediction; recurrence.
Copyright: © Wu et al.
Figures
Similar articles
-
Clinical and molecular relevance of mutant-allele tumor heterogeneity in breast cancer.Breast Cancer Res Treat. 2017 Feb;162(1):39-48. doi: 10.1007/s10549-017-4113-z. Epub 2017 Jan 16. Breast Cancer Res Treat. 2017. PMID: 28093659
-
Clinical relevance of mutant-allele tumor heterogeneity and lung adenocarcinoma.Ann Transl Med. 2019 Sep;7(18):432. doi: 10.21037/atm.2019.08.112. Ann Transl Med. 2019. PMID: 31700868 Free PMC article.
-
Mutant-Allele Tumor Heterogeneity, a Favorable Biomarker to Assess Intra-Tumor Heterogeneity, in Advanced Lung Adenocarcinoma.Front Oncol. 2022 Jul 1;12:888951. doi: 10.3389/fonc.2022.888951. eCollection 2022. Front Oncol. 2022. PMID: 35847947 Free PMC article.
-
TERT promoter mutation and its interaction with IDH mutations in glioma: Combined TERT promoter and IDH mutations stratifies lower-grade glioma into distinct survival subgroups-A meta-analysis of aggregate data.Crit Rev Oncol Hematol. 2017 Dec;120:1-9. doi: 10.1016/j.critrevonc.2017.09.013. Epub 2017 Oct 3. Crit Rev Oncol Hematol. 2017. PMID: 29198322 Review.
-
Isocitrate dehydrogenase-mutant glioma: Evolving clinical and therapeutic implications.Cancer. 2017 Dec 1;123(23):4535-4546. doi: 10.1002/cncr.31039. Epub 2017 Oct 5. Cancer. 2017. PMID: 28980701 Review.
Cited by
-
Obscurin: A multitasking giant in the fight against cancer.Biochim Biophys Acta Rev Cancer. 2021 Aug;1876(1):188567. doi: 10.1016/j.bbcan.2021.188567. Epub 2021 May 18. Biochim Biophys Acta Rev Cancer. 2021. PMID: 34015411 Free PMC article. Review.
-
Intratumor Heterogeneity as a Prognostic Factor in Solid Tumors: A Systematic Review and Meta-Analysis.Front Oncol. 2021 Oct 15;11:744064. doi: 10.3389/fonc.2021.744064. eCollection 2021. Front Oncol. 2021. PMID: 34722299 Free PMC article.
-
Bivalent Genes Targeting of Glioma Heterogeneity and Plasticity.Int J Mol Sci. 2021 Jan 7;22(2):540. doi: 10.3390/ijms22020540. Int J Mol Sci. 2021. PMID: 33430434 Free PMC article. Review.
-
Pleiotropy of PP2A Phosphatases in Cancer with a Focus on Glioblastoma IDH Wildtype.Cancers (Basel). 2022 Oct 25;14(21):5227. doi: 10.3390/cancers14215227. Cancers (Basel). 2022. PMID: 36358647 Free PMC article. Review.
-
Prognostic and immunomodulatory roles of schizophrenia-associated genes HTR2A, COMT, and PRODH in pan-cancer analysis and glioma survival prediction model.Front Immunol. 2023 Jul 26;14:1201252. doi: 10.3389/fimmu.2023.1201252. eCollection 2023. Front Immunol. 2023. PMID: 37564635 Free PMC article.
References
-
- Freese C, Takiar V, Fouladi M, DeWire M, Breneman J, Pater L. Radiation and subsequent reirradiation outcomes in the treatment of diffuse intrinsic pontine glioma and a systematic review of the reirradiation literature. Pract Radiat Oncol. 2017;7:86–92. doi: 10.1016/j.prro.2016.11.005. - DOI - PubMed
LinkOut - more resources
Full Text Sources
Miscellaneous