. 2019 Nov 17:6:1253-1262.
doi: 10.1016/j.toxrep.2019.11.012. eCollection 2019.

Oral exposure to low dose bisphenol A aggravates allergic airway inflammation in mice

Affiliations

Oral exposure to low dose bisphenol A aggravates allergic airway inflammation in mice

Rie Yanagisawa et al. Toxicol Rep. .

Abstract

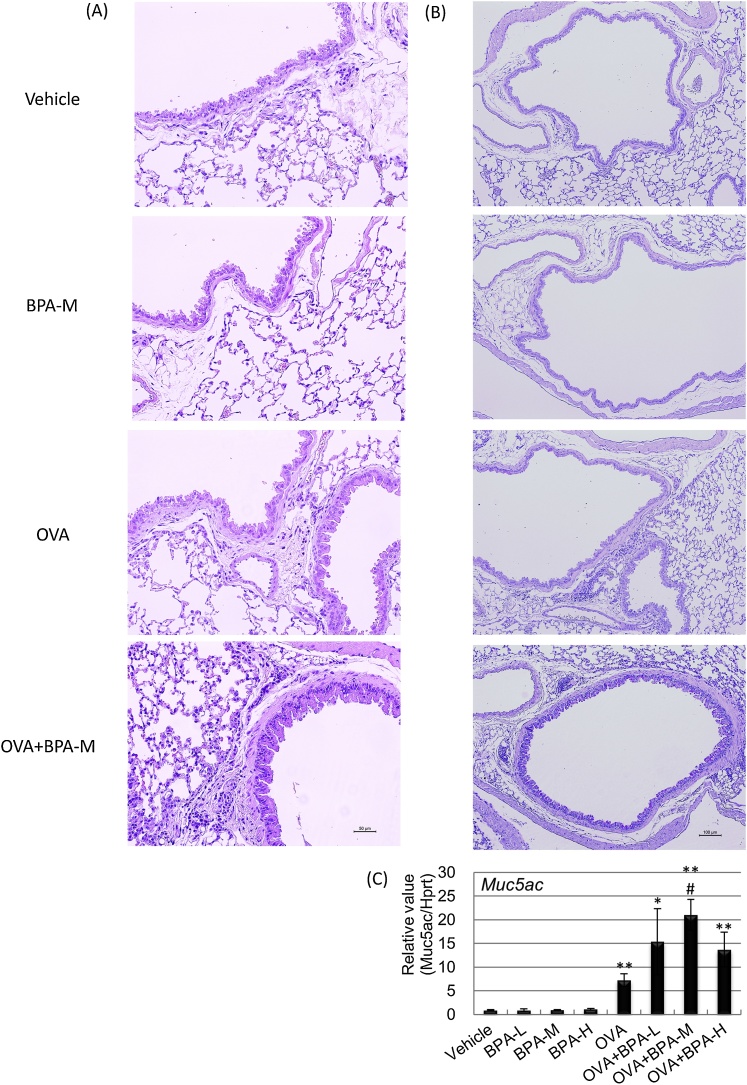
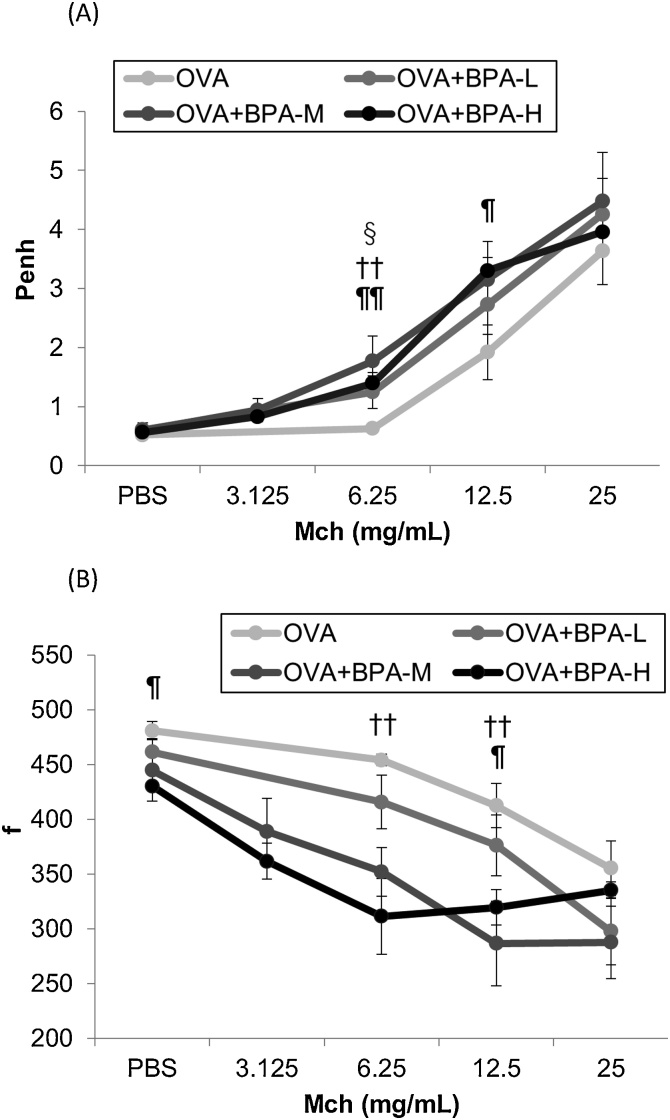
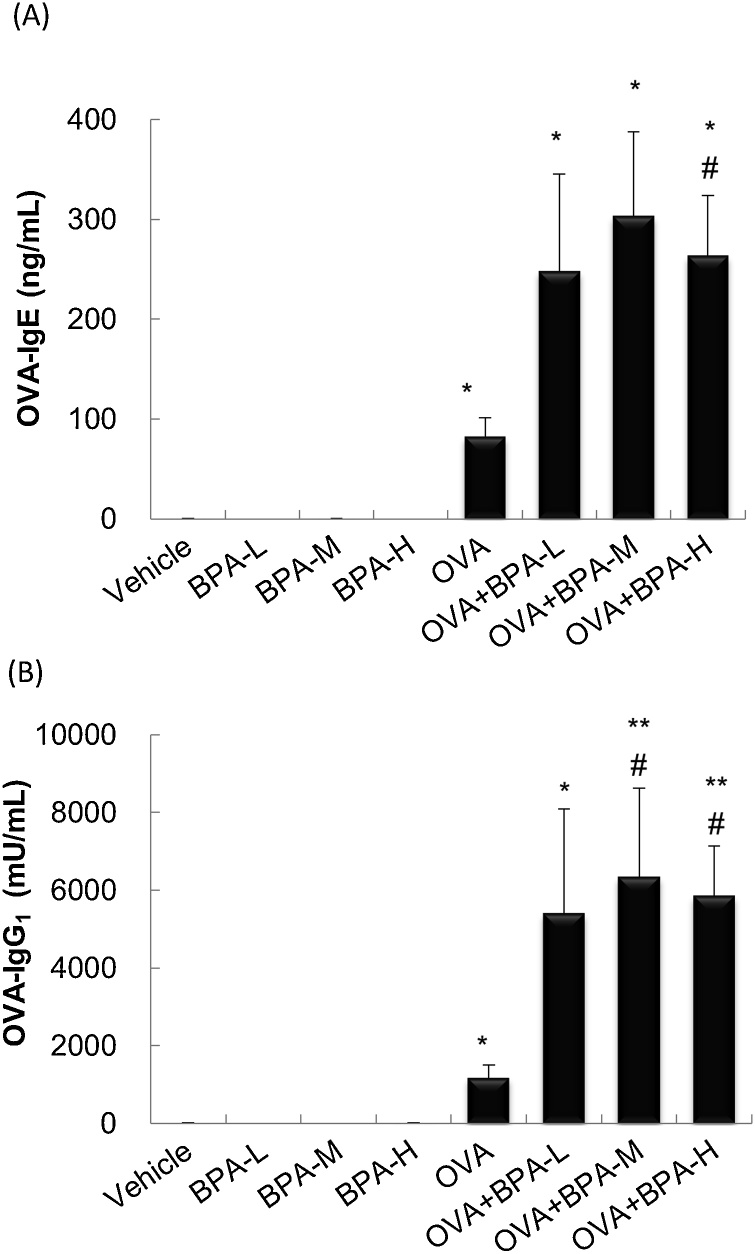
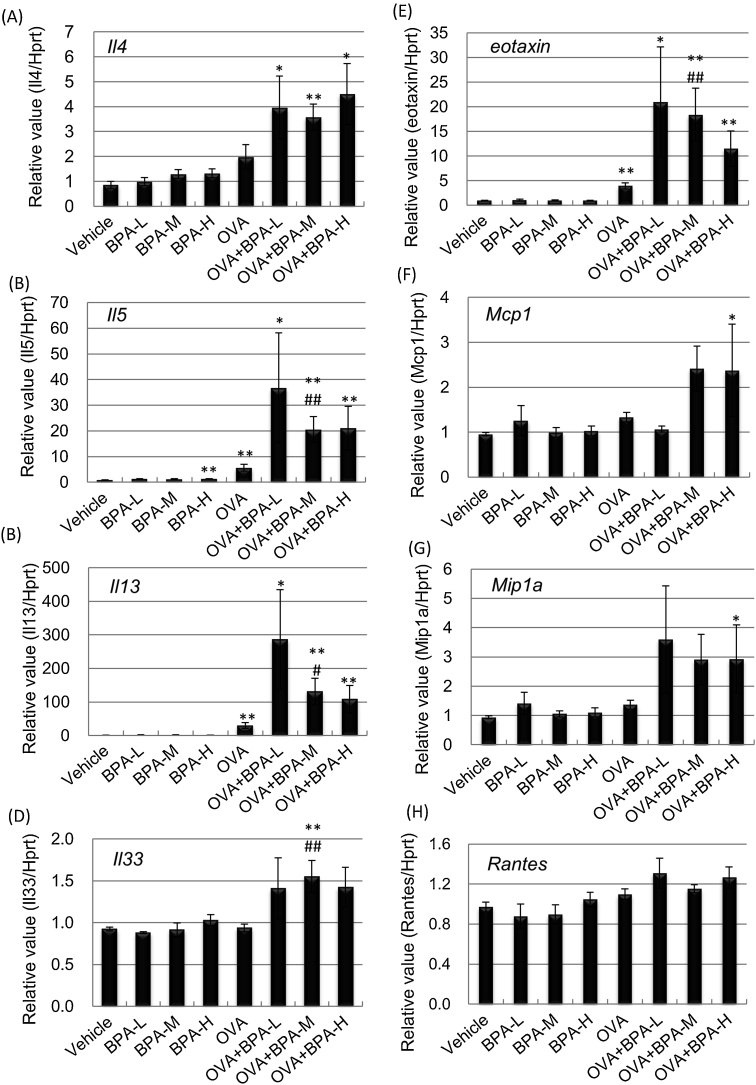
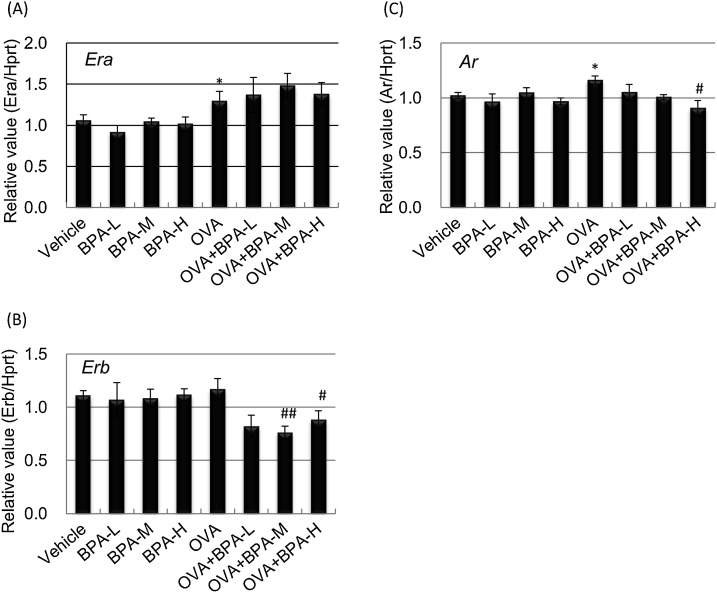
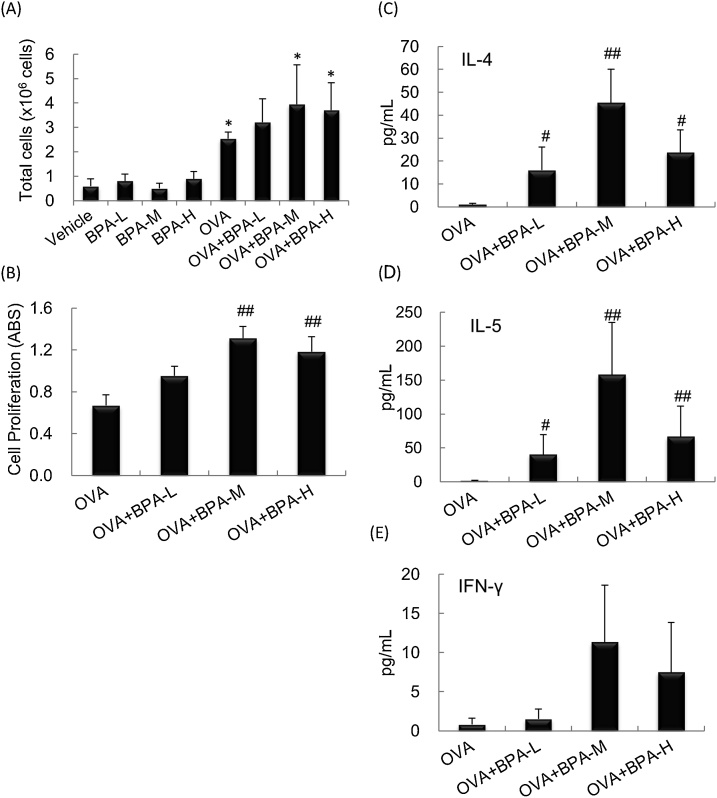
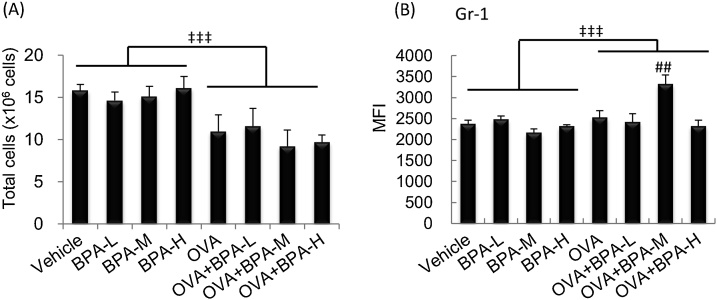
Bisphenol A (BPA) is widely used in many consumer products and has adverse effects on human health including allergic diseases. We investigated the effects of low dose BPA, comparable to actual human oral exposure, on allergic asthma in mice. C3H/HeJ male mice were fed a chow diet containing BPA (equivalent to 0.09, 0.90, or 9.01 μg/kg/day) and were intratracheally administered ovalbumin (OVA, 1 μg/animal) every two weeks from 5-11 weeks of age. All doses of BPA plus OVA enhanced pulmonary inflammation and airway hyperresponsiveness, and increased lung mRNA levels of Th2 cytokine/chemokine, and serum OVA-specific IgE and IgG1 compared to OVA alone, with greater effects observed in the middle- and high-dose BPA plus OVA groups. Furthermore, high-dose BPA with OVA decreased lung mRNA levels of ERβ and AR compared with OVA. Furthermore, BPA enhanced OVA-restimulated cell proliferation and protein levels of IL-4 and IL-5 in mediastinal lymph node (MLN) cells in OVA-sensitized mice. In bone marrow (BM) cells, middle-dose BPA with OVA increased Gr-1 expression. In conclusion, oral exposure to low-dose BPA at levels equivalent to human exposure can aggravate allergic asthmatic responses through enhancement of Th2-skewed responses, lung hormone receptor downregulation, and MLN and BM microenvironment change.

Keywords: AhR, aryl hydrocarbon receptor; Allergic asthma; Ar, androgen receptor; BM, bone marrow; BPA, bisphenol a; Bisphenol A; ER, estrogen receptor; Endocrine disruptor; FACS, fluorescence-activated cell-sorting; GR, glucocorticoid receptor; Gr-1, granulocyte-differentiation antigen; Hormone receptor; Hprt1, hypoxanthine phosphoribosyltransferase 1; IFN-γ, interferon-gamma; IL, interleukin; Ig, immunoglobulin; Low dose effects; MCP-1, monocyte chemoattractant protein-1; MIP-1α, macrophage inflammatory protein 1-alpha; MLN, mediastinal lymph node; OVA, ovalbumin; RANTES, normal T cell expressed and secreted; SDF-1α, stromal cell derived factor 1 alpha; Th, T helper; Th2 response.


Figures

Fig. 1
Fig. 1
Histological findings and mRNA Muc5ac levels in the lung. Histological changes using H&E- and PAS-staining and gene expression using RT-PCR analysis in the lung were examined 48 h after the final intratracheal administration. (A) H&E staining. (B) PAS staining. (C) Muc5ac mRNA level. Data were expressed as mean ± SE for 3 animals per group for histological findings and for 3–7 animals per group for RT-PCR analysis, respectively. * P <  0.05 versus vehicle group, ** P <  0.01 versus vehicle group, # P <  0.05 versus OVA group.
Fig. 2
Fig. 2
Changes in airway responsiveness to methacholine in OVA-sensitized mice. They were performed 24 h after the final OVA intratracheal administration using whole body plethysmography in a noninvasive fashion. (A) Enhanced pause values (Penh). (B) Airway frequency (f). § P <  0.05 OVA+BPA-L group versus OVA group, †† P <  0.01 OVA+BPA-M group versus OVA group, ¶ P <  0.05 OVA+BPA-H group versus OVA group, ¶¶ P <  0.01 OVA+BPA-H group versus OVA group.
Fig. 3
Fig. 3
Serum levels of OVA-specific Ig antibodies. OVA-specific IgE and IgG1 in serum were measured 48 h after the last intratracheal administration by ELISA. (A) OVA-IgE. (B) OVA-IgG1. Data were expressed as mean ± SE for 5–6 animals per group. ** P <  0.01 versus vehicle group. * P <  0.05 versus vehicle group, ** P <  0.01 versus vehicle group, # P <  0.05 versus OVA group, ## P <  0.01 versus OVA group.
Fig. 4
Fig. 4
Cytokine and chemokine mRNA levels in the lung. Gene expression in the lung was examined 48 h after the last intratracheal administration by RT-PCR analysis. (A) Il4. (B) Il5. (C) Il13. (D) Il33. (E) eotaxin. (F) Mcp1, (G) Mip1a. (H) Rantes. The relative intensity was normalized to Hprt1. Data were expressed as mean ± SE for 3–7 animals per group. ** P <  0.01 versus vehicle group. * P <  0.05 versus vehicle group, ** P <  0.01 versus vehicle group, # P <  0.05 versus OVA group, ## P <  0.01 versus OVA group.
Fig. 5
Fig. 5
Hormone receptor mRNA levels in the lung. Gene expression in the lung was examined 48 h after the last intratracheal administration by RT-PCR analysis. (A) Era. (B) Erb. (C) Ar. Data were expressed as mean ± SE for 3–7 animals per group. The relative intensity was normalized to Hprt1. ** P <  0.01 versus vehicle group. * P <  0.05 versus vehicle group, ** P <  0.01 versus vehicle group, # P <  0.05 versus OVA group, ## P <  0.01 versus OVA group.
Fig. 6
Fig. 6
Changes in cell number and activation in MLN cells. MLN cells were prepared 48 h after the final OVA intratracheal administration and the total cell number was counted. Cell proliferation and cytokine expression in culture supernatants were examined after 67 h of culture in the presence of OVA. (A) Total cell number. (B) Cell proliferation (Abs). (C) IL-4. (D) IL-5. (E) IFN-γ. Data were expressed as mean ± SEM of 6 animals per group. *; P <  0.05 versus Vehicle group, # P <  0.05 versus OVA group, ## P <  0.01 versus OVA group.
Fig. 7
Fig. 7
Changes in cell number and Gr-1 expression in BM cells. BM cells were prepared 48 h after the final intratracheal administration and the total cell number was counted. Cell surface molecule expression was determined by FACS analysis. (A) Total cell number. (B) MFI of Gr-1+ cells. Data were expressed as mean ± SE for 6 animals per group. ## P <  0.01 versus OVA group, ‡‡‡ P <  0.001 OVA groups versus PBS groups.

References

    1. Konieczna A., Rutkowska A., Rachon D. Health risk of exposure to Bisphenol A (BPA) Rocz. Panstw. Zakl. Hig. 2015;66(1):5–11. - PubMed
    1. Tzatzarakis M.N., Karzi V., Vakonaki E., Goumenou M., Kavvalakis M., Stivaktakis P., Tsitsimpikou C., Tsakiris I., Rizos A.K., Tsatsakis A.M. Bisphenol A in soft drinks and canned foods and data evaluation. Food Addit. Contam. Part B Surveill. 2017;10(2):85–90. - PubMed
    1. Vandenberg L.N., Hauser R., Marcus M., Olea N., Welshons W.V. Human exposure to bisphenol A (BPA) Reprod. Toxicol. 2007;24(2):139–177. - PubMed
    1. Kang J.H., Kondo F., Katayama Y. Human exposure to bisphenol A. Toxicology. 2006;226(2-3):79–89. - PubMed
    1. Calafat A.M., Kuklenyik Z., Reidy J.A., Caudill S.P., Ekong J., Needham L.L. Urinary concentrations of bisphenol A and 4-nonylphenol in a human reference population. Environ. Health Perspect. 2005;113(4):391–395. - PMC - PubMed