. 2020 Mar;117(3):886-893.
doi: 10.1002/bit.27234. Epub 2019 Dec 18.

A yeast optogenetic toolkit (yOTK) for gene expression control in Saccharomyces cerevisiae

Affiliations

A yeast optogenetic toolkit (yOTK) for gene expression control in Saccharomyces cerevisiae

Jidapas My An-Adirekkun et al. Biotechnol Bioeng. 2020 Mar.

Abstract

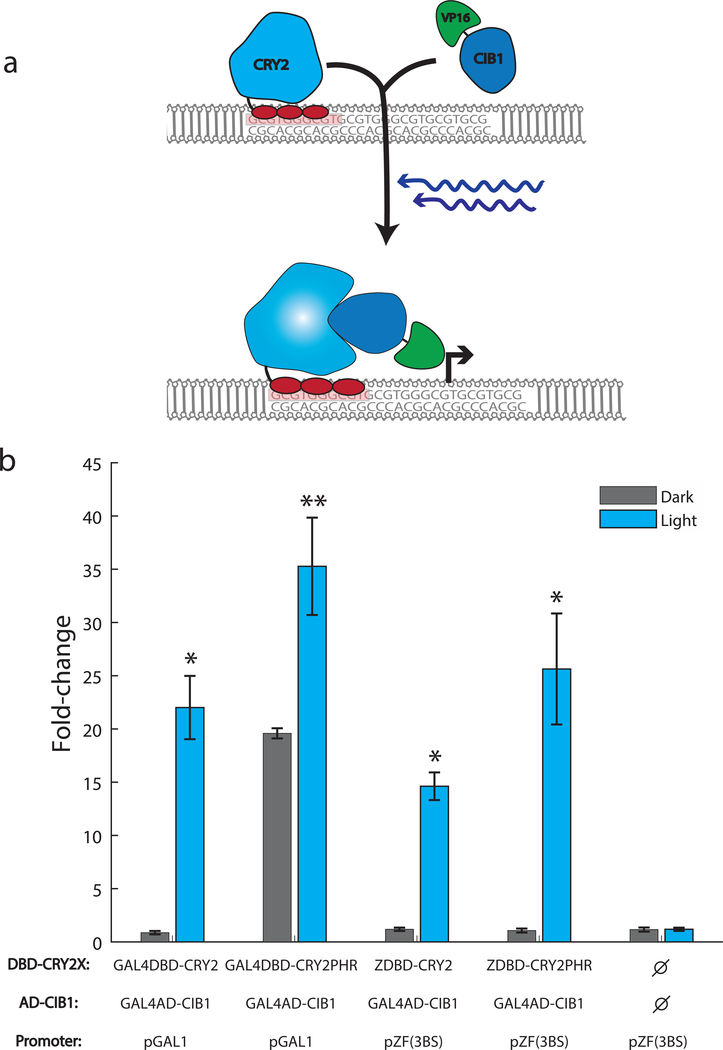
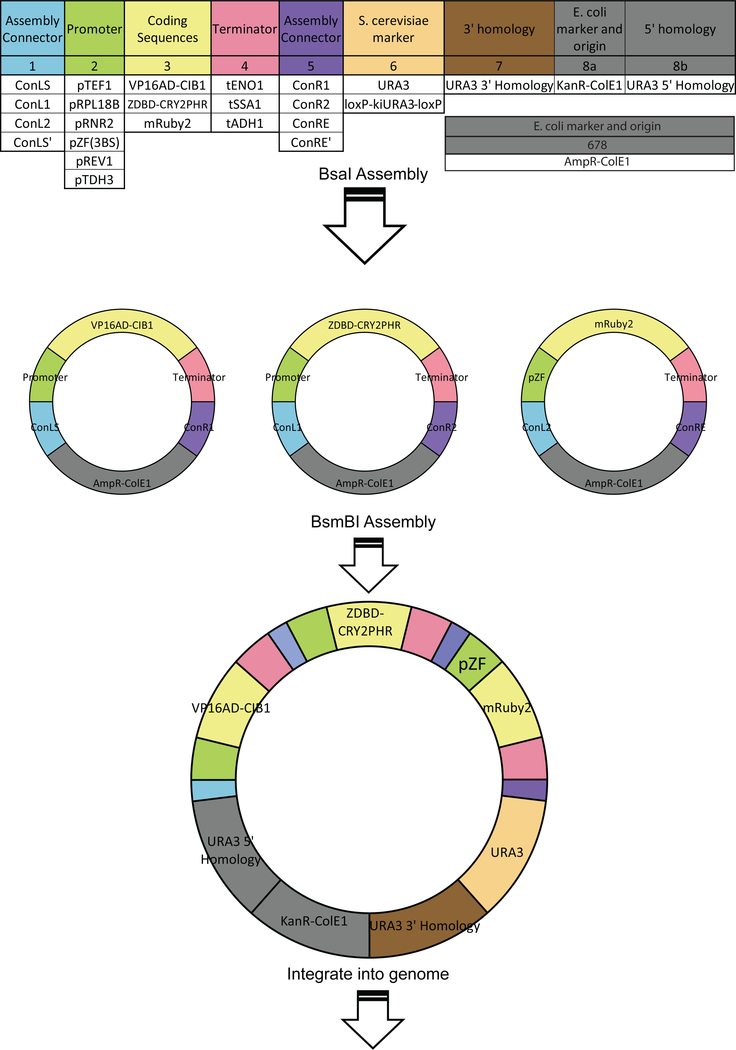
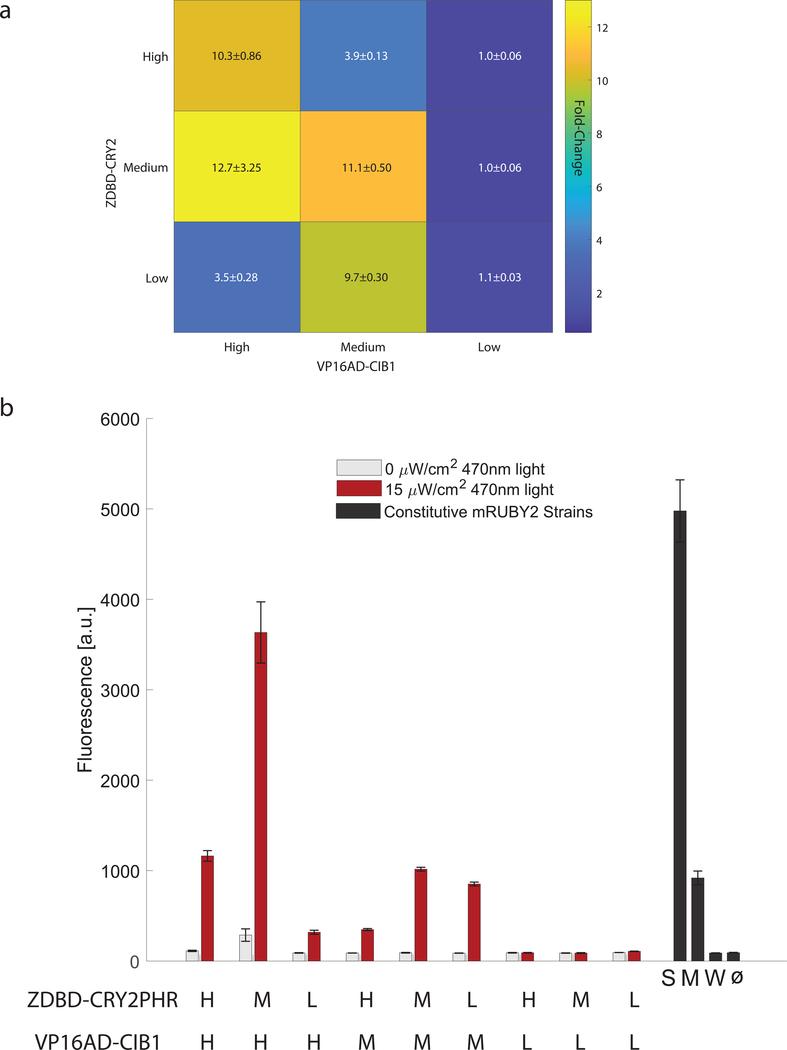
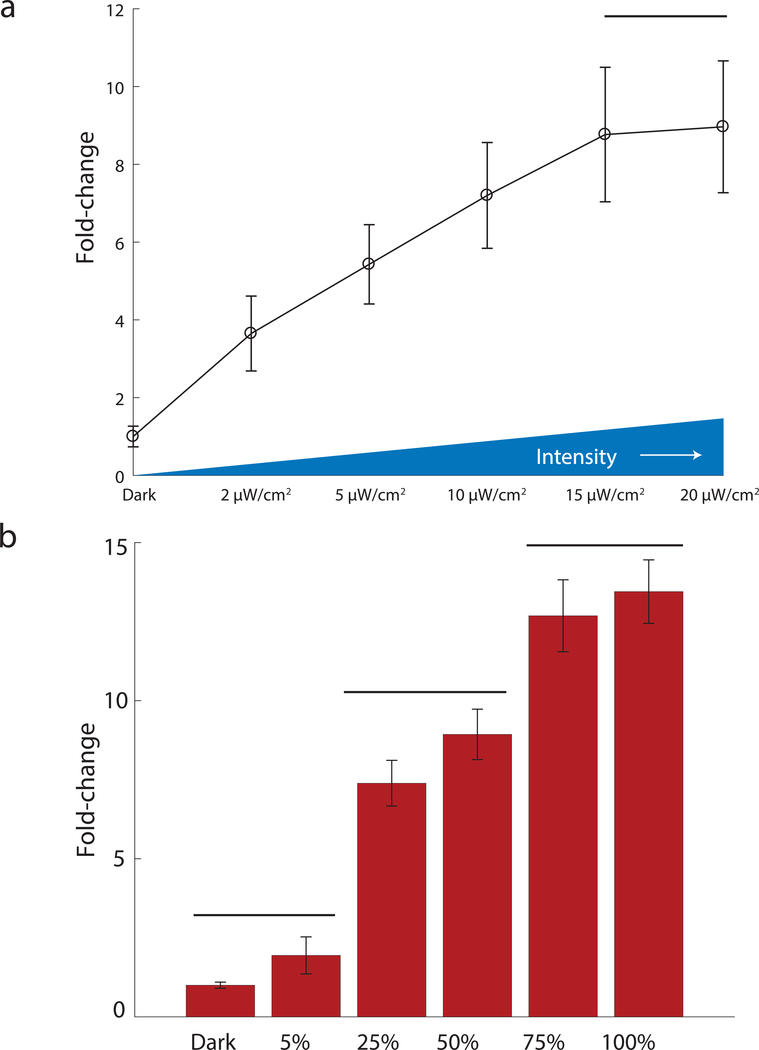
Optogenetic tools for controlling gene expression are ideal for tuning synthetic biological networks due to the exquisite spatiotemporal control available with light. Here we develop an optogenetic system for gene expression control integrated with an existing yeast toolkit allowing for rapid, modular assembly of light-controlled circuits in the important chassis organism Saccharomyces cerevisiae. We reconstitute activity of a split synthetic zinc-finger transcription factor (TF) using light-induced dimerization mediated by the proteins CRY2 and CIB1. We optimize function of this split TF and demonstrate the utility of the toolkit workflow by assembling cassettes expressing the TF activation domain and DNA-binding domain at different levels. Utilizing this TF and a synthetic promoter we demonstrate that light intensity and duty cycle can be used to modulate gene expression over the range currently available from natural yeast promoters. This study allows for rapid generation and prototyping of optogenetic circuits to control gene expression in S. cerevisiae.

Keywords: MoClo; Saccharomyces cerevisiae; light-inducible promoter; optogenetics; yeast.


Figures

Figure 1
Figure 1. DBD-CRY2 AD-CIB1 optogenetic system:
(A) Schematic of the ZDBD-CRY2 and VP16AD-CIB1 optogenetic system. In response to blue light, CRY2 undergoes a conformational change that allows CIB1 to bind CRY2. This recruits the activation domain to a promoter containing Zif268 binding sites (GCG-TGG-GCG). (B) Yeast cells were transformed with the following DBD-CRY2 or DBD-CRY2PHR, AD-CIB1, and reporter plasmids: GAL4DBD-CRY2/GAL4AD-CIB1/pGAL1-yEVenus, GAL4DBD-CRY2PHR/GAL4AD-CIB1/pGAL1-yEVenus, ZDBD-CRY2/GAL4AD-CIB1/pZF(3BS)-yEVenus, or ZDBD-CRY2PHR/GAL4AD-CIB1/pZF(3BS)-yEVenus. The control sample contains pZF(3BS)-yEVenus and empty vector controls only. Cultures were grown for 12 hours in 15 μW/cm2 470nm blue-light. No light controls were grown in identical conditions without illumination. Induction at T=12 hours is displayed as fold-change relative to the same sample at T=0 hours. Data is presented as the average ±SEM. Samples indicated with a * (p<0.05) or ** (p<0.0.1) were significantly induced at T=12 hours relative to T=0 hours (Welch’s t-test). ANOVA followed by Tukey’s-HSD indicated that the GAL4DBD split transcription factors do not induce significantly better that the ZDBD transcription factors (F(3,8)=5.4, p=0.0252, Groups: GAL4DBD-CRY2/GAL4AD-CIB1-ab, GAL4DBD-CRY2PHR/GAL4AD-CIB1-b, ZDBD-CRY2/GAL4AD-CIB1-a, and ZDBD-CRY2PHR/GAL4AD-CIB1/pZF(3BS)-ab).
Figure 2
Figure 2. Circuit construction using the Yeast Toolkit scheme:
Part plasmids contain unique upstream and downstream BsaI-generated overhangs to assemble into the appropriate position in “cassette” plasmids. Cassette plasmids are fully functional transcriptional units that are further assembled into multigene plasmids using BsmBI assembly and appropriate Assembly Connectors. This figure utilizes the color scheme and organization from Lee, et al 2015 to illustrate how the new optogenetic components integrate with an existing yeast toolkit.
Figure 3
Figure 3. Optimization of the split transcription factor
(A) Fold-induction in gene expression in response to 17 hours of 470nm 15μW/cm2 blue-light from the pZF(3BS)-mRuby2 reporter was measured in nine strains expressing different ratios of the DNA-binding domain (ZDBD-CRY2PHR) and the activation domain (VP16AD-CIB1) under High (pTEF1), Medium (pRPL18B), or Low (pRNR2) strength promoters to create ZDBD-CRY2high/med/low/VP16AD-CIB1high/med/low strains. Data is presented as mean±SEM. A one-way ANOVA (F(8,45)=30.04, p=1.35X10⁻¹⁵), followed by Tukey’s-HSD shows that the fold-changes are significantly different with the following groups (ZDBD-CRY2high/med/low/VP16AD-CIB1high/med/low): M/H-a; H/H, M/M, M/L-b; H/L, M/H-c; L/H, L/M, L/L-d. (B) Raw fluorescence data for strains shown in (A). Gene expression was compared to yeast strains expressing mRuby2 under constitutive promoters of different strengths (Strong-pTDH3, Medium-pRPL18B, Weak-pREV1). All constructs except those with the Low activation domain show very significant induction in the light (p<0.0001, Welch’s t-test). ANOVA followed by Tukey’s HSD (F(12,65)=248, p=2.21×10−49) shows that the following promoters or split TF combinations are significantly different: pTDH3 alone, M/H alone, the group containing H/H, M/M, L/M, pRPL18B, and the group containing L/H and H/M. All other lowly expressing promoters including the weak constitutive pREV1 promoter belong to the same group.
Figure 4
Figure 4. Tuning of gene expression
(A) Gene expression in the ZDBD-CRY2PHRmedium/VP16AD-CIB1medium optogenetic strain is tunable as a function of blue-light intensity. Strains were induced for 17 hours at the indicated intensity of 470nm light. ANOVA followed by Tukey’s-HSD shows that the expression at each light intensity is significantly different except for 15μW/cm2 and 20μW/cm2, which are in the same group (F(5,12)=209.93, p-value=3.01×10⁻¹¹). (B) Gene expression in the ZDBD-CRY2PHRmedium/VP16AD-CIB1medium optogenetic strain is tunable as a function of light duty cycle. Strains were induced with 20 minute periods with the indicated duty-cycle of 470nm blue light at 15μW/cm2. Fluorescence was measured as fold-change relative to the dark control. Bars distinguish significantly different groups determined by one-way ANOVA followed by Tukey’s HSD (F(5,12)=325, p=2.2×10⁻¹²).

References

    1. Benzinger D, & Khammash M. (2018). Pulsatile inputs achieve tunable attenuation of gene expression variability and graded multi-gene regulation. Nature communications, 9(1), 3521. - PMC - PubMed
    1. Buchholz K, & Collins J. (2013). The roots-a short history of industrial microbiology and biotechnology. Applied Microbiology and Biotechnology, 97, 3747–3762. - PubMed
    1. Carter Z, & Delneri D. (2010). New generation of loxP-mutated deletion cassettes for the genetic manipulation of yeast natural isolates. Yeast, 27, 765–775. - PubMed
    1. Castillo-Hair S, Igoshin O, & Tabor J. (2015). How to train your microbe: methods for dynamically characterizing gene networks. Current opinion in microbiology, 24, 113–123. - PMC - PubMed
    1. Chen B, Lee H, Heng Y, Chua N, Teo W, Choi W, … Chang M. (2018). Synthetic biology toolkits and applications in Saccharomyces cerevisiae. Biotechnology Advances, 36(7), 1870–1881. - PubMed

Publication types

MeSH terms

Substances

LinkOut - more resources