. 2020 Feb;19(2):e13067.
doi: 10.1111/acel.13067. Epub 2019 Dec 2.

Mitochondrial mass governs the extent of human T cell senescence

Affiliations

Mitochondrial mass governs the extent of human T cell senescence

Lauren A Callender et al. Aging Cell. 2020 Feb.

Abstract

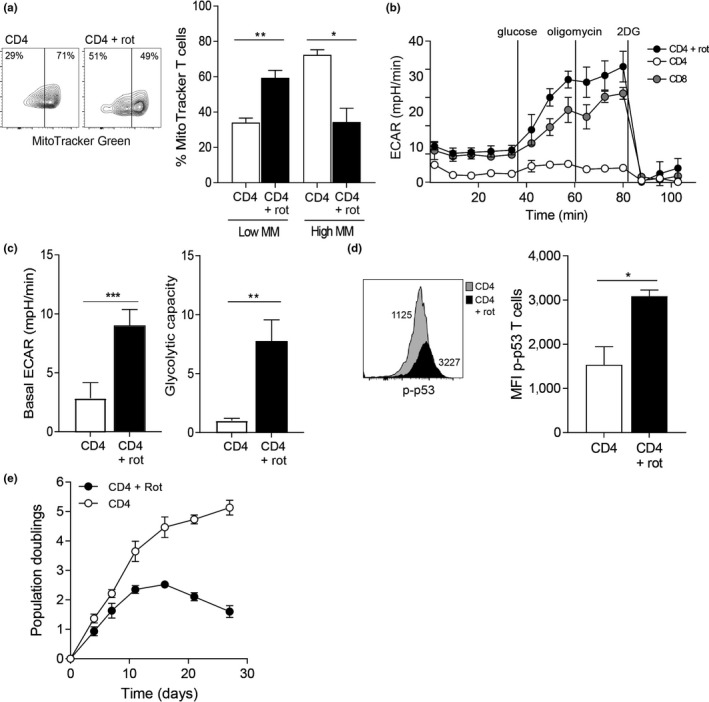
The susceptibility of human CD4+ and CD8+ T cells to senesce differs, with CD8+ T cells acquiring an immunosenescent phenotype faster than the CD4+ T cell compartment. We show here that it is the inherent difference in mitochondrial content that drives this phenotype, with senescent human CD4+ T cells displaying a higher mitochondrial mass. The loss of mitochondria in the senescent human CD8+ T cells has knock-on consequences for nutrient usage, metabolism and function. Senescent CD4+ T cells uptake more lipid and glucose than their CD8+ counterparts, leading to a greater metabolic versatility engaging either an oxidative or a glycolytic metabolism. The enhanced metabolic advantage of senescent CD4+ T cells allows for more proliferation and migration than observed in the senescent CD8+ subset. Mitochondrial dysfunction has been linked to both cellular senescence and aging; however, it is still unclear whether mitochondria play a causal role in senescence. Our data show that reducing mitochondrial function in human CD4+ T cells, through the addition of low-dose rotenone, causes the generation of a CD4+ T cell with a CD8+ -like phenotype. Therefore, we wish to propose that it is the inherent metabolic stability that governs the susceptibility to an immunosenescent phenotype.

Keywords: T cell; aging; metabolism; mitochondria; senescence.


Conflict of interest statement

The authors have no conflicting financial interests.

Figures

Figure 1
Figure 1
Human CD4+ EMRA T cells are acquired at a slower rate owing to a higher degree of mitochondrial content. (a) The accumulation of senescent CD4+ and CD8+ T cells with age defined by the markers CD45RA and CD27. (b) Representative flow cytometry plots from middle‐aged donors and cumulative graphs of MitoTracker Green staining in CD4+ and CD8+ EMRA T cells analysed directly ex vivo. Data expressed as mean ± SEM of six donors. (c) Electron microscope images of CD4+ and CD8+ EMRA T cells imaged directly ex vivo from middle‐aged donors. Yellow arrows mark mitochondria. Graph shows the percentage by cell volume of mitochondria in senescent T cell subsets determined by a point‐counting grid method from 20 different electron microscope images. (d) PGC1α expression in CD45RA/CD27‐defined EMRA T cell subsets from middle‐aged donors. Data expressed as mean ± SEM of nine donors. p‐values were calculated using a t test. ** p < .01
Figure 2
Figure 2
Mitochondrial dysfunction is observed in CD8+ but not CD4+ EMRA T cell subsets. (a) Representative flow cytometry plots and cumulative graphs of TMRE staining from middle‐aged donors showing membrane potential in CD45RA/CD27 T cell subsets directly ex vivo defined showing the percentage of cortactin‐positive (a) CD4+ and (b) CD8+ T cells analysed directly ex vivo. Data expressed as mean ± SEM of six donors. (b) Mitochondrial ROS measured using MitoSOX by flow cytometry in CD4+ and CD8+ EMRA T cells from middle‐aged donors. Data expressed as mean ± SEM of six donors. (c) Mitochondrial ROS production expressed as a ratio of mitochondrial mass. Calculated from data shown in Figures 1b and 2. (d) γH2AX expression as determined by flow cytometry in CD45RA/CD27‐defined T cell subsets directly ex vivo from middle‐aged donors; the graph shows the mean ± SEM for five donors. (e) Oxygen consumption rates (OCR) of the EMRA CD4+ and CD8+ T cell subsets from middle‐aged donors were measured following a 15‐min stimulation with 0.5 µg/ml anti‐CD3 and 5 ng/ml IL‐2; the cells were then subjected to a metabolic stress test using the indicated mitochondrial inhibitors. Data are representative of four independent experiments. (f) The basal OCR, extracellular acidification rate (ECAR) and spare respiratory capacity were measured following a 15‐min stimulation with 0.5 µg/ml anti‐CD3 and 5 ng/ml IL‐2. Graphs show the mean ± SEM for four donors. (g) ATP concentration in EMRA T cell subsets from middle‐aged donors, graphs show the mean ± SEM for five donors. p‐values were calculated using a t test. *p < .05, **p < .01, and ***p < .005
Figure 3
Figure 3
Impaired nutrient uptake by CD8+ EMRA T cells. (a) Glucose uptake was assessed using the fluorescent glucose analogue 2‐NBDG in CD4+ and CD8+ T CD45RA/CD27‐defined EMRA T cells from middle‐aged donors by flow cytometry following a 15‐min incubation. Data expressed as mean ± SEM of seven donors. (b) Examples and data showing expression of the glucose transporters glut1, glut8 and glut10 in senescent T cell subsets directly ex vivo from middle‐aged donors. Graphs show the mean ± SEM for four donors. (c) Lipid uptake was measured using fluorescently labelled palmitate, BODIPY C16 by flow cytometry following a 15‐min incubation in CD4+ and CD8+ EMRA T cells from middle‐aged donors. Data expressed as mean ± SEM of seven donors. (d) Examples and graphs showing the fatty acid translocase CD36 and FATP2 and −3 directly ex vivo from middle‐aged donors. Data expressed as mean ± SEM of six donors. p‐values were calculated using a t test. *p < .05, **p < .01, and ***p < .005
Figure 4
Figure 4
Impaired function observed in CD8+ EMRA T cells. (a) Example and graph showing the expression of p‐p53 in CD4+ and CD8+ CD45RA/CD27‐defined EMRA T cells directly ex vivo from middle‐aged donors. Graphs show the mean ± SEM for four donors. (b) Proliferation was defined in senescent T cell subsets using Ki67 directly ex vivo from middle‐aged donors. Data show the mean ± SEM for 12 donors. (c) The migration of CD4+ and CD8+ EMRA T cells from middle‐aged donors through HUVECs and their supporting transwell filters. HUVECs were stimulated with 20% decomplemented (heated at 56°C for 20 min) autologous donor sera for 24 hr. PBMCs were allowed to adhere and migrate for 4 hr towards either media, CXCL10/12 or autologous serum. The number of T cells was counted and expressed as a percentage of the total migrated CD4+ or CD8+ T cells. Data are expressed as the mean ± SEM of six donors. (d) Representative flow cytometry plots and cumulative graphs showing the percentage of cortactin‐positive senescent T cell subsets analysed directly ex vivo from middle‐aged donors. Data expressed as mean ± SEM of seven donors. p‐values were calculated using a t test. *p < .05, **p < .01, ***p < .005, and ****p < .001
Figure 5
Figure 5
Impairing mitochondrial function in CD4+ T cells accelerates senescence. (a) Example and graph showing the mitochondrial mass of CD4+ T cells treated for 5 days with 10 nM rotenone or DMSO control. Graph shows the mean ± SEM for three middle‐aged donors. (b) Extracellular acidification rates (ECAR) of the rotenone‐ or DMSO‐treated CD4+ T cells or DMSO‐treated CD8+ T cell from middle‐aged donors were measured following a 15‐min stimulation with 0.5 µg/ml anti‐CD3 and 5 ng/ml IL‐2. The cells were then subjected to a glycolytic rate assay using the indicated substances. Data are representative of three independent experiments. (c) The basal ECAR and glycolytic capacity were measured following a 15‐min stimulation with 0.5 µg/ml anti‐CD3 and 5 ng/ml IL‐2. Graphs show the mean ± SEM for three donors. (d) Example and graph showing the expression of p‐p53 in CD4+ T cells from middle‐aged donors treated for 5 days with 10 nM rotenone or DMSO control. Graphs show the mean ± SEM for three donors. (E) Population doublings for CD4+ T cells treated 10 nM rotenone or DMSO control over 27 days. Graphs show the mean ± SEM for three donors

References

    1. Akbar, A. N. , Henson, S. M. , & Lanna, A. (2016). Senescence of T lymphocytes: Implications for enhancing human immunity. Trends in Immunology, 37, 866–876. 10.1016/j.it.2016.09.002 - DOI - PubMed
    1. Appay, V. , van Lier, R. A. , Sallusto, F. , & Roederer, M. (2008). Phenotype and function of human T lymphocyte subsets: Consensus and issues. Cytometry A, 73, 975–983. - PubMed
    1. Baker, D. J. , Wijshake, T. , Tchkonia, T. , LeBrasseur, N. K. , Childs, B. G. , van de Sluis, B. , … van Deursen, J. M. (2011). Clearance of p16Ink4a‐positive senescent cells delays ageing‐associated disorders. Nature, 479, 232–236. 10.1038/nature10600 - DOI - PMC - PubMed
    1. Brainard, D. M. , Tager, A. M. , Misdraji, J. , Frahm, N. , Lichterfeld, M. , Draenert, R. , … Luster, A. D. (2007). Decreased CXCR3+ CD8 T cells in advanced human immunodeficiency virus infection suggest that a homing defect contributes to cytotoxic T‐lymphocyte dysfunction. Journal of Virology, 81, 8439–8450. 10.1128/JVI.00199-07 - DOI - PMC - PubMed
    1. Brewer, R. A. , Gibbs, V. K. , & Smith, D. L. Jr. (2016). Targeting glucose metabolism for healthy aging. Nutrition and Healthy Aging, 4, 31–46. 10.3233/NHA-160007 - DOI - PMC - PubMed

Publication types

MeSH terms