

miR-126a-3p induces proliferation, migration and invasion of trophoblast cells in pre-eclampsia-like rats by inhibiting A Disintegrin and Metalloprotease 9
- PMID: 31789346
- PMCID: PMC6923329
- DOI: 10.1042/BSR20191271
miR-126a-3p induces proliferation, migration and invasion of trophoblast cells in pre-eclampsia-like rats by inhibiting A Disintegrin and Metalloprotease 9
Retraction in
-
Retraction: miR-126a-3p induces proliferation, migration and invasion of trophoblast cells in preeclampsia-like rats through inhibiting a disintegrin and metalloprotease 9(ADAM9).Biosci Rep. 2020 Jul 31;40(7):BSR-20191271_RET. doi: 10.1042/BSR-20191271_RET. Biosci Rep. 2020. PMID: 32691072 Free PMC article. No abstract available.
Abstract
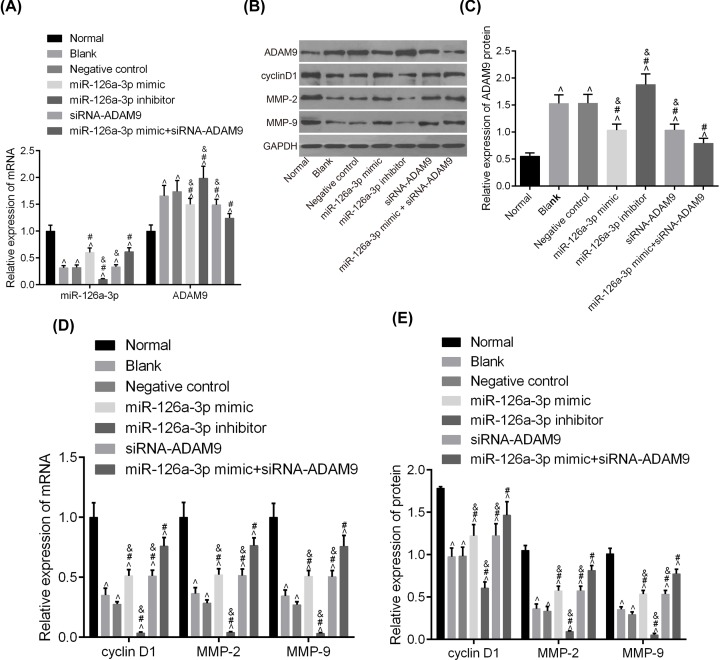
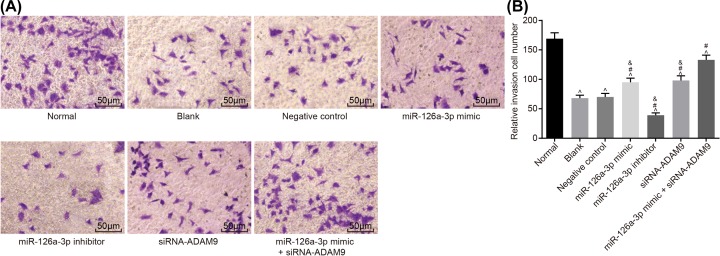
The present study aimed to investigate the underlying mechanism of miR-126a-3p in the proliferation, migration and invasion of trophoblast cells in pre-eclampsia-like rats by targeting A Disintegrin and Metalloprotease 9 (ADAM9). First, the interaction between miR-126a-3p and ADAM9 was confirmed via biochemical assays. Placental tissues and trophoblast cells were then obtained. RNA in situ hybridization was performed in order to detect miR-126a-3p expression in the placenta. Subsequently, a series of biological assays, including reverse transcription-quantitative PCR (RT-qPCR), Western blotting, MTT assay, apoptosis assay, cell cycle assay, wound healing assay and transwell assay were adopted in order to determine the cell proliferation, cell cycle distribution, apoptotic rate, and migration and invasion of trophoblast cells in each group. The results revealed that miR-126a-3p was down-regulated in the placenta of pre-eclampsia-like rats. In vivo experiments' results indicated that miR-126a-3p could inhibit ADAM9 expression, and induce cyclin D1, Matrix metalloproteinase (MMP) 2 (MMP-2), MMP-9 expression. MTT, apoptosis and cell cycle assay results revealed that trophoblast cells transfected with miR-126a-3p mimic or si-ADAM9 exhibited higher proliferative activity and a lower apoptotic rate compared with the blank group (all P<0.05). The wound healing assay and transwell assay results confirmed that, compared with the blank group, the migration and invasion ability of trophoblast cells in the miR-126a-3p mimic group and small interfering RNA (siRNA)-ADAM9 group were significantly increased (all P<0.05). Conversely, miR-126a-3p inhibitor treatment revealed the opposite effect (all P<0.05). In conclusion, the present study demonstrated that miR-126a-3p could enhance proliferation, migration and invasion, but decrease the apoptosis rate of trophoblast cells in pre-eclampsia-like rats through targeting ADAM9.
Keywords: ADAM9; biological characteristics; miR-126a-3p; preeclampsia; trophoblast cells.
© 2019 The Author(s).
Conflict of interest statement
The ethics approval (approval number: 2018-KY054-01) was obtained from the Animal Care and Use Committees of Beijing Obstetrics and Gynecology Hospital, Capital Medical University. Furthermore, total experimental operations on animals have been completed at above-mentioned hospital following the International Convention on Laboratory Animal Ethics and were performed in strict accordance with the Guide for the Care and Use of Laboratory Animals.
The authors declare that there are no competing interests associated with the manuscript.
Figures


Similar articles
-
Circ_0005714/miR-223-3p/ADAM9 regulatory axis affects proliferation, migration, invasion, and angiopoiesis in trophoblast cells.Autoimmunity. 2022 Dec;55(8):640-649. doi: 10.1080/08916934.2022.2101642. Epub 2022 Jul 26. Autoimmunity. 2022. PMID: 35880619
-
MiR-221-3p is down-regulated in preeclampsia and affects trophoblast growth, invasion and migration partly via targeting thrombospondin 2.Biomed Pharmacother. 2019 Jan;109:127-134. doi: 10.1016/j.biopha.2018.10.009. Epub 2018 Nov 2. Biomed Pharmacother. 2019. PMID: 30396069
-
miR-346 and miR-582-3p-regulated EG-VEGF expression and trophoblast invasion via matrix metalloproteinases 2 and 9.Biofactors. 2017 Mar;43(2):210-219. doi: 10.1002/biof.1325. Epub 2016 Sep 13. Biofactors. 2017. PMID: 27619846
-
The role of miRNA-210 in pre-eclampsia development.Ann Med. 2022 Dec;54(1):1350-1356. doi: 10.1080/07853890.2022.2071459. Ann Med. 2022. PMID: 35543206 Free PMC article. Review.
-
MicroRNAs: Small molecules with a large impact on pre-eclampsia.J Cell Physiol. 2020 Apr;235(4):3235-3248. doi: 10.1002/jcp.29286. Epub 2019 Oct 9. J Cell Physiol. 2020. PMID: 31595979 Review.
Cited by
-
Long Non-Coding RNA Nuclear-Enriched Abundant Transcript 1 (NEAT1) Represses Proliferation of Trophoblast Cells in Rats with Preeclampsia via the MicroRNA-373/FLT1 Axis.Med Sci Monit. 2020 Oct 23;26:e927305. doi: 10.12659/MSM.927305. Med Sci Monit. 2020. PMID: 33093438 Free PMC article.
-
The Role of LIN28-let-7-ARID3B Pathway in Placental Development.Int J Mol Sci. 2020 May 21;21(10):3637. doi: 10.3390/ijms21103637. Int J Mol Sci. 2020. PMID: 32455665 Free PMC article. Review.
References
-
- Bolin M., Wikstrom A.K., Wiberg-Itzel E., Olsson A.K., Ringvall M., Sundstrom-Poromaa I. et al. . (2012) Prediction of preeclampsia by combining serum histidine-rich glycoprotein and uterine artery Doppler. Am. J. Hypertens. 25, 1305–1310 - PubMed
Publication types
MeSH terms
Substances
LinkOut - more resources
Full Text Sources
Research Materials
Miscellaneous