. 2020 Jan;56(1):47-68.
doi: 10.3892/ijo.2019.4920. Epub 2019 Nov 25.

Circulating non‑coding RNA‑biomarker potential in neoadjuvant chemotherapy of triple negative breast cancer?

Affiliations

Circulating non‑coding RNA‑biomarker potential in neoadjuvant chemotherapy of triple negative breast cancer?

Andrea Ritter et al. Int J Oncol. 2020 Jan.

Abstract

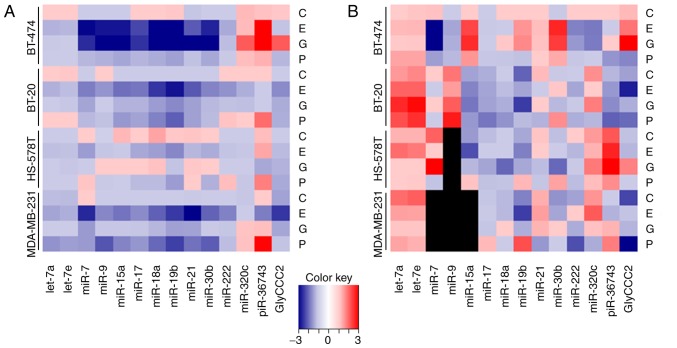
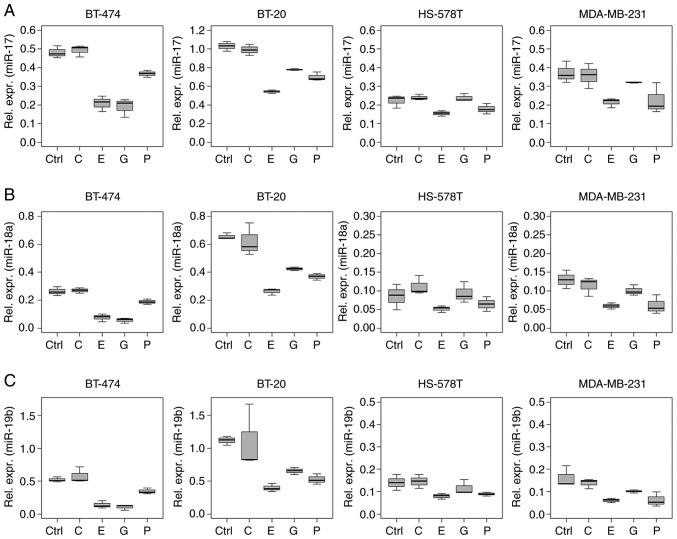
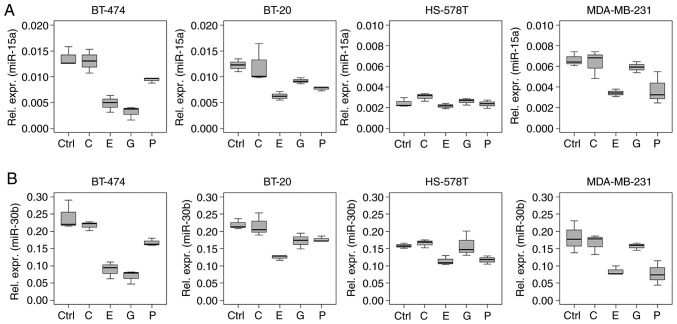
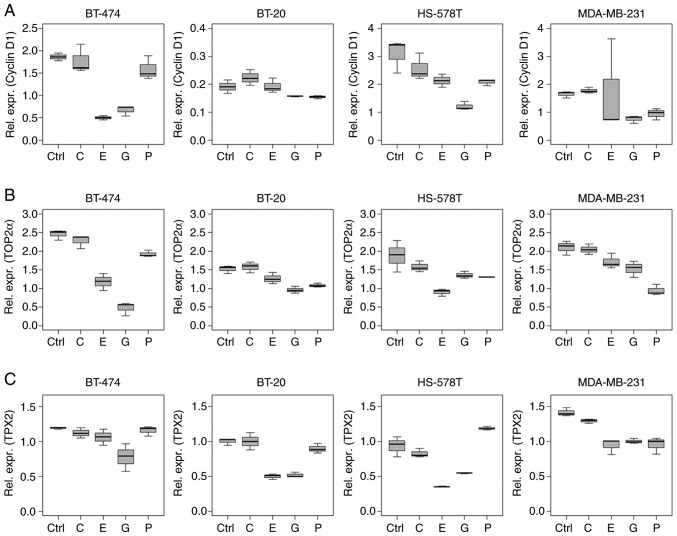
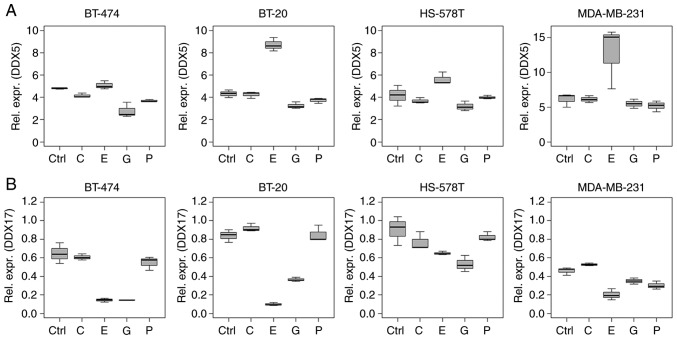
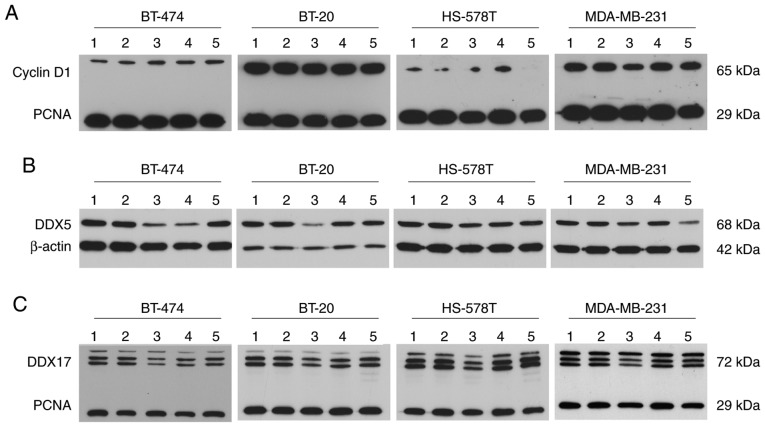
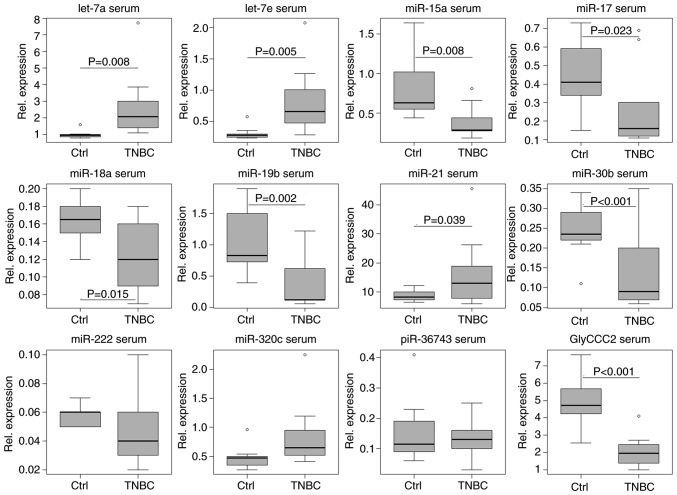
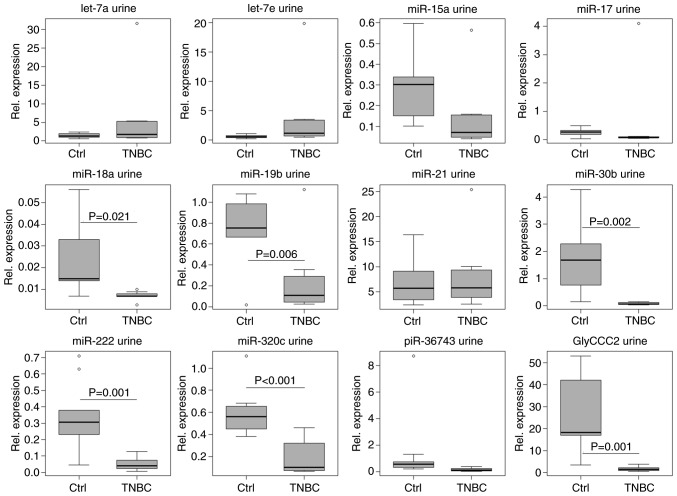
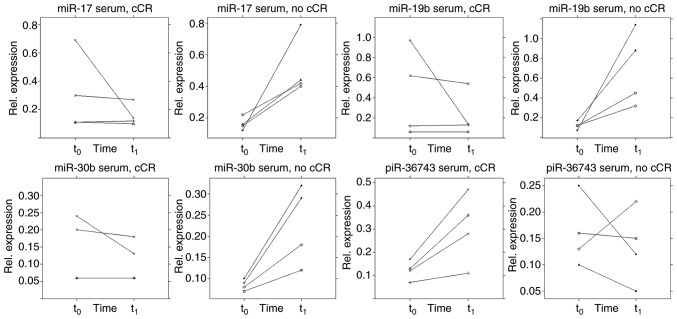
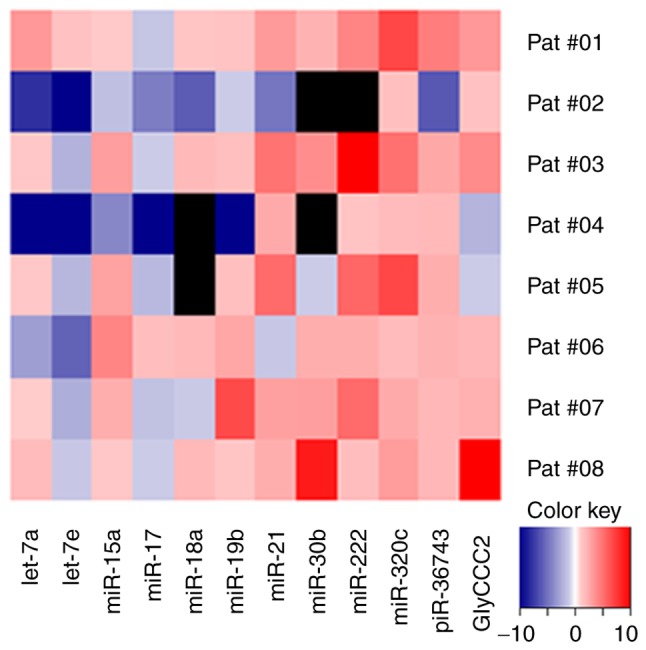
Due to the positive association between neoadjuvant chemotherapy (NACT) and the promising early response rates of patients with triple negative breast cancer (TNBC), including probabilities of pathological complete response, NACT is increasingly used in TNBC management. Liquid biopsy‑based biomarkers with the power to diagnose the early response to NACT may support established monitoring tools, which are to a certain extent imprecise and costly. Simple serum‑ or urine‑based analyses of non‑coding RNA (ncRNA) expression may allow for fast, minimally‑invasive testing and timely adjustment of the therapy regimen. The present study investigated breast cancer‑related ncRNAs [microRNA (miR)‑7, ‑9, ‑15a, ‑17, ‑18a, ‑19b, ‑21, ‑30b, ‑222 and ‑320c, PIWI‑interacting RNA‑36743 and GlyCCC2] in triple positive BT‑474 cells and three TNBC cell lines (BT‑20, HS‑578T and MDA‑MB‑231) treated with various chemotherapeutic agents using reverse transcription‑quantitative PCR. Intracellular and secreted microvesicular ncRNA expression levels were analysed using a multivariable statistical regression analysis. Chemotherapy‑driven effects were investigated by analysing cell cycle determinants at the mRNA and protein levels. Serum and urine specimens from 8 patients with TNBC were compared with 10 healthy females using two‑sample t‑tests. Samples from the patients with TNBC were compared at two time points. Chemotherapeutic treatments induced distinct changes in ncRNA expression in TNBC cell lines and the BT‑474 cell line in intra‑ and extracellular compartments. Serum and urine‑based ncRNA expression analysis was able to discriminate between patients with TNBC and controls. Time point comparisons in the urine samples of patients with TNBC revealed a general rise in the level of ncRNA. Serum data suggested a potential association between piR‑36743, miR‑17, ‑19b and ‑30b expression levels and an NACT‑driven complete clinical response. The present study highlighted the potential of ncRNAs as liquid biopsy‑based biomarkers in TNBC chemotherapy treatment. The ncRNAs tested in the present study have been previously investigated for their involvement in BC or TNBC chemotherapy responses; however, these previous studies were restricted to patient tissue or in vitro models. The data from the present study offer novel insight into ncRNA expression in liquid samples from patients with TNBC, and the study serves as an initial step in the evaluation of ncRNAs as diagnostic biomarkers in the monitoring of TNBC therapy.


Figures

Figure 1
Figure 1
Chemotherapy-driven ncRNA regulations in (triple negative) breast cancer cells. Relative expression levels (ΔΔCq) of ncRNAs in BT-474, BT-20, HS-578T and MDA-MB-231 cells treated with 2.0 μg/ml carboplatin, 1.0 μg/ml epirubicin, 40.0 μg/ml gemcitabine and 2.0 μg/ml paclitaxel for 18 h as determined by reverse transcription-quantitative PCR. Heatmaps demonstrate (A) intracellular expression levels normalised to the geometric mean of RNU-44 and -48, and (B) secreted microvesicular ncRNA levels normalised to the global mean of all investigated targets. Black squares indicate no reliably detectable ncRNA expression. ncRNAs, non-coding RNAs; miR, microRNA; piR, PIWI-interacting RNA; C, carboplatin; E, epirubicin; G, gemcitabine; P, paclitaxel.
Figure 2
Figure 2
Expression profile of miR-17~92 cluster miRNAs. Relative expression levels (ΔCq) of the miR-17~92 cluster miRNAs (A) miR-17, (B) -18a and (C) -19b in BT-474, BT-20, HS-578T and MDA-MB-231 breast cancer cells treated with 2.0 μg/ml carboplatin, 1.0 μg/ml epirubicin, 40.0 μg/ml gemcitabine and 2.0 μg/ml paclitaxel for 18 h as determined by reverse transcription-quantitative PCR. Data are normalised to the geometric mean of RNU-44 and -48. Untreated cells served as the control. Boxplots indicate median (thick line), first and third quartile (box lines) and maximal/minimal value (upper and lower line). Y-axis scaling can deviate to improve readability. miR/miRNA, microRNA; C, carboplatin; E, epirubicin; G, gemcitabine; P paclitaxel; Ctrl, control.
Figure 3
Figure 3
Chemotherapy-driven regulation of miR-15a and -30b in (triple negative) breast cancer cells. Relative expression levels (ΔCq) of (A) miR-15a and (B) -30b in BT-474, BT-20, HS-578T and MDA-MB-231 cells treated with 2.0 μg/ml carboplatin, 1.0 μg/ml epirubicin, 40.0 μg/ml gemcitabine and 2.0 μg/ml paclitaxel for 18 h, normalised to the geometric mean of RNU-44 and -48, as determined by reverse transcription-quantitative PCR. Untreated cells served as the control. Boxplots indicate median (thick line), first and third quartile (box lines) and maximal/minimal value (upper and lower line). Y-axis scaling can deviate to improve readability. miR, microRNA; C, carboplatin; E, epirubicin; G, gemcitabine; P, paclitaxel; Ctrl, control.
Figure 4
Figure 4
Influence of chemotherapy treatment on cell cycle determinants in (triple negative) breast cancer cell lines. Relative mRNA expression levels (Δ Cq) of (A) cyclin D1, (B) TOP2α and (C) TPX2 in BT-474, BT-20, HS-578T and MDA-MB-231 cells under control conditions, and treated with 2.0 μg/ml carboplatin, 1.0 μg/ml epirubicin, 40.0 μg/ml gemcitabine and 2.0 μg/ml paclitaxel for 18 h. Data are normalised to 5′-aminolevulinate synthase 1 and values were determined by reverse transcription-quantitative PCR. Boxplots indicate median (thick line), first and third quartile (box lines) and maximal/minimal value (upper and lower line). Y-axis scaling can deviate to improve readability. TPX2, targeting protein for Xklp2; TOP2α, DNA topoisomerase 2α; C, carboplatin; E, epirubicin; G, gemcitabine; P, paclitaxel; Ctrl, control.
Figure 5
Figure 5
Influence of chemotherapy treatment on DDX proteins in (triple negative) breast cancer cell lines. Relative mRNA expression levels (ΔCq) of (A) DDX5 and (B) DDX17 in BT-474, BT-20, HS-578T and MDA-MB-231 cells under control conditions, and treated with 2.0 μg/ml carboplatin, 1.0 μg/ml epirubicin, 40.0 μg/ml gemcitabine and 2.0 μg/ml paclitaxel for 18 h. Data are normalised to 5′-aminolevulinate synthase 1. Values were determined using reverse transcription-quantitative PCR. Boxplots indicate median (thick line), first and third quartile (box lines) and maximal/minimal value (upper and lower line). Y-axis scaling can deviate to improve readability. DDX, DEAD-box polypeptide; C, carboplatin; E, epirubicin; G, gemcitabine; P, paclitaxel; Ctrl, control.
Figure 6
Figure 6
Chemotherapy treatment influences DDX5 and -17 protein levels in (triple negative) breast cancer cells. Protein expression of (A) DDX5, (B) DDX17 and (C) cyclin D1 in BT-474, BT-20, HS-578T and MDA-MB-231 cells treated with 2.0 μg/ml carboplatin (lane 2), 1.0 μg/ml epirubicin (lane 3), 40.0 μg/ml gemcitabine (lane 4) and 2.0 μg/ml paclitaxel (lane 5) for 18 h, as determined by western blotting compared with untreated cells (lane 1). β-actin and PCNA served as loading control. DDX, DEAD-box polypeptide; PCNA, proliferating cell nuclear antigen.
Figure 7
Figure 7
ncRNA expression in serum distinguishes patients with TNBC from controls. Relative expression levels (ΔCq) of microvesicular ncRNAs (let-7a/e, miR-15a, -17, -18a,-19b, -21, -30b, -222 and -320c, piR-36743 and GlyCCC2) in the serum of 8 patients with TNBC and 10 healthy controls, normalised to the geometric mean of miR-26b and -191, as determined by reverse transcription-quantitative PCR. Let-7a/e and miR-21 expression levels were increased in patients with TNBC compared to controls (two-tailed t-test; P<0.05). miR-15a, -17, -18a, -19b, -30b and GlyCCC2 were decreased. Boxplots indicate median (thick line), first and third quartile (box lines), maximal/minimal value (upper and lower line) and ° (moderate outlier). Y-axis scaling can deviate to improve readability. ncRNAs, non-coding RNAs; miR, microRNA; TNBC, triple negative breast cancer; piR, PIWI-interacting RNA; Ctrl, control.
Figure 8
Figure 8
ncRNA expression in urine can distinguish patients with TNBC from controls. Relative expression levels (ΔCq) of microvesicular ncRNAs (let-7a/e, miR-15a, -17, -18a, -19b, -21, -30b, -222 and -320c, piR-36743 and GlyCCC2) in the urine of 8 patients with TNBC and 10 healthy controls, normalised to the geometric mean of miR-16 and -26b, as determined by reverse transcription-quantitative PCR. miR-18a, -19b, -30b, -222 and -320c, and GlyCCC2 expression levels were decreased in patients with TNBC compared to controls (two-tailed t-test; P<0.05). Boxplots indicate median (thick line), first and third quartile (box lines), maximal/minimal value (upper and lower line) and ° (moderate outlier). Y-axis scaling can deviate to improve readability. ncRNA, non-coding RNA; TNBC, triple negative breast cancer; miR, microRNA; piR, PIWI-interacting RNA; Ctrl, control.
Figure 9
Figure 9
NACT influences ncRNA expression in the serum of patients with TNBC. Relative expression levels (ΔCq) of microvesicular ncRNAs (miR-17, -19b. -30b and piR-36743) in the serum of 4 patients with TNBC who achieved a cCR during NACT and 4 patients with TNBC who did not (no cCR), normalised to the geometric mean of miR-26b and -191, as determined by reverse transcription-quantitative PCR. Samples were taken at two time points: t0 and t1. Y-axis scaling can deviate to improve readability. ncRNA, non-coding RNA; TNBC, triple negative breast cancer; miR, microRNA; cCR, clinical complete response; NACT, neoadjuvant chemotherapy; piR, PIWI-interacting RNA; t0, prior to NACT; t1 immediately prior to the third cycle of therapy.
Figure 10
Figure 10
NACT influences ncRNA expression in the urine of patients with TNBC. Relative expression levels (ΔCq) of microvesicular ncRNAs in the urine of 8 patients with TNBC during NACT, normalised to the geometric mean of miR-16 and -26b, as determined by reverse transcription-quantitative PCR. Heatmap demonstrates fold change of ncRNA expression levels from t0 to t1. Black squares indicate no reliably detectable ncRNA expression. ncRNA, non-coding RNA; TNBC, triple negative breast cancer; miR, microRNA; cCR, clinical complete response; NACT, neoadjuvant chemotherapy; piR, PIWI-interacting RNA; t0, prior to NACT; t1, immediately prior to third cycle of therapy.

References

    1. World Health Organization IAfRoC: Cancer Today. 2018 https://gco.iarc.fr/today/home. Accessed April 4, 2019.
    1. DeSantis C, Ma J, Bryan L, Jemal A. Breast cancer statistics, 2013. CA Cancer J Clin. 2014;64:52–62. doi: 10.3322/caac.21203. - DOI - PubMed
    1. Early Breast Cancer Trialists' Collaborative Group (EBCTCG) Effects of chemotherapy and hormonal therapy for early breast cancer on recurrence and 15-year survival: An overview of the randomised trials. Lancet. 2005;365:1687–1717. doi: 10.1016/S0140-6736(05)66544-0. - DOI - PubMed
    1. Prat A, Parker JS, Karginova O, Fan C, Livasy C, Herschkowitz JI, He X, Perou CM. Phenotypic and molecular characterization of the claudin-low intrinsic subtype of breast cancer. Breast Cancer Res. 2010;12:R68. doi: 10.1186/bcr2635. - DOI - PMC - PubMed
    1. Pérou CM, Sprlie T, Eisen MB, van de Rijn M, Jeffrey SS, Rees CA, Pollack JR, Ross DT, Johnsen H, Akslen LA, et al. Molecular portraits of human breast tumours. Nature. 2000;406:747–752. doi: 10.1038/35021093. - DOI - PubMed

MeSH terms