

Sensitive and Selective Measurement of Serotonin in Vivo Using Fast Cyclic Square-Wave Voltammetry
- PMID: 31789495
- PMCID: PMC7478172
- DOI: 10.1021/acs.analchem.9b03164
Sensitive and Selective Measurement of Serotonin in Vivo Using Fast Cyclic Square-Wave Voltammetry
Abstract
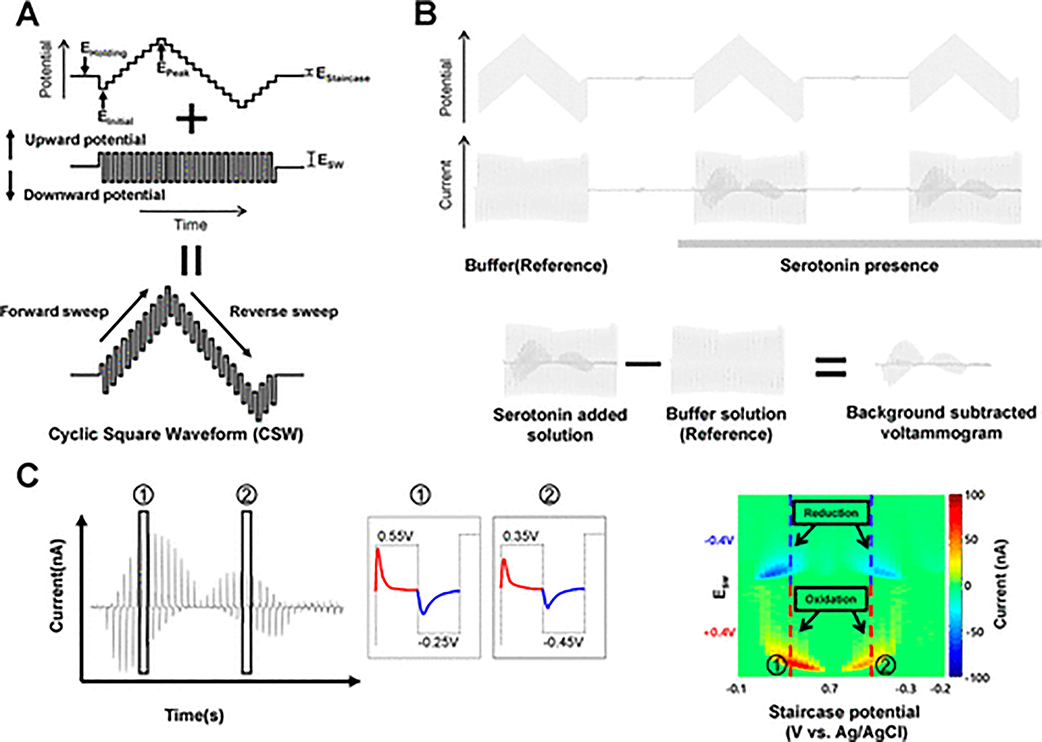
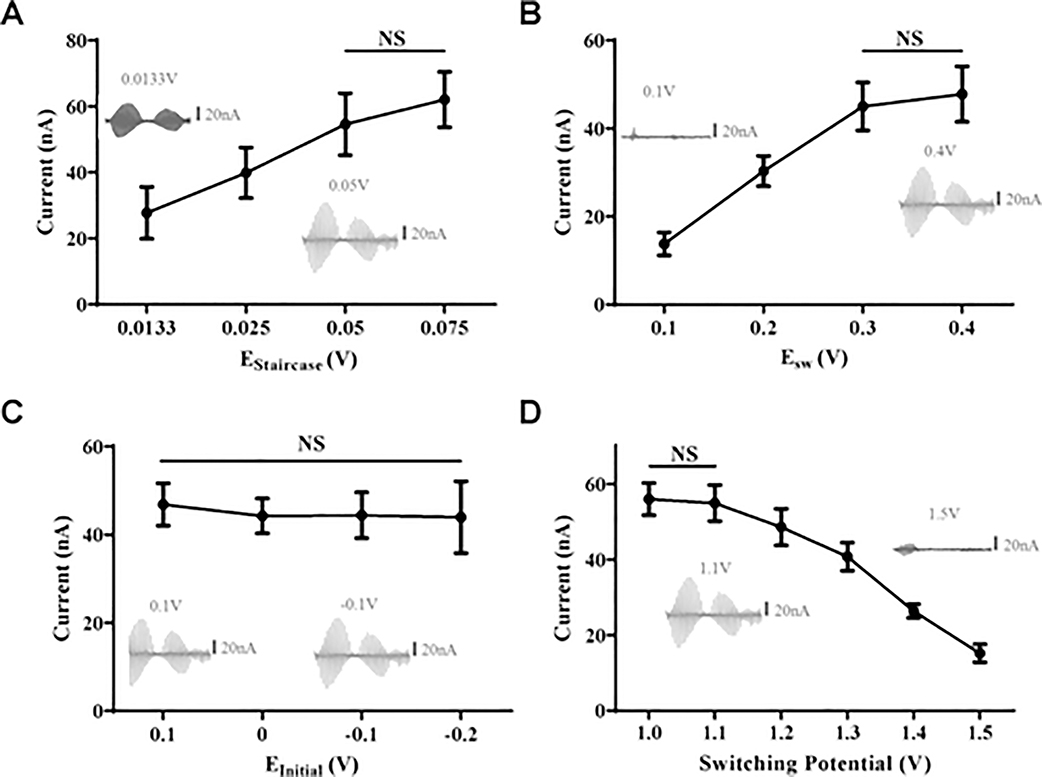
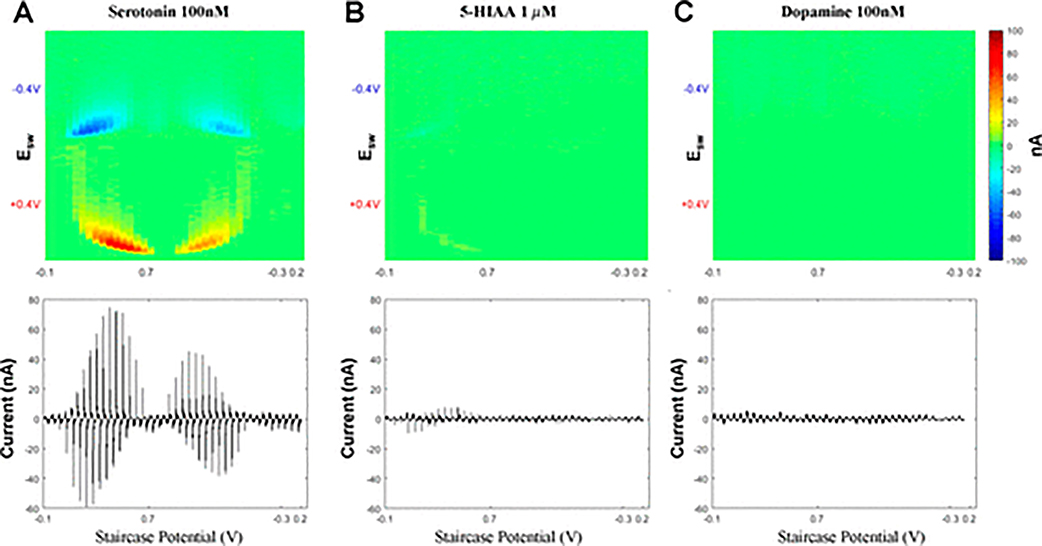
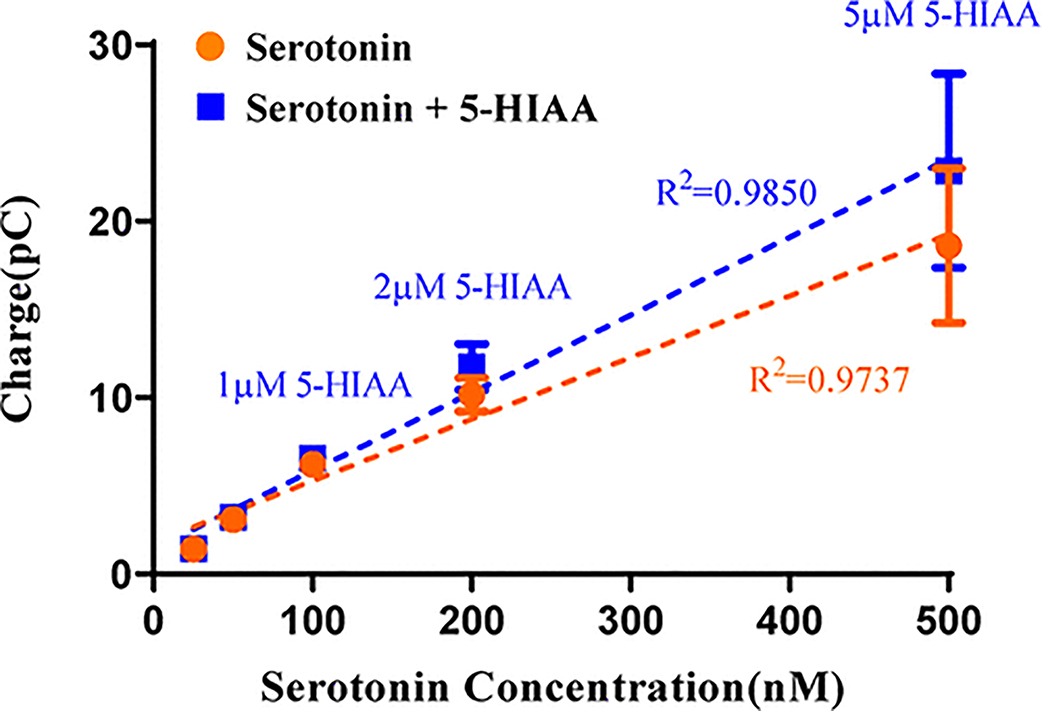
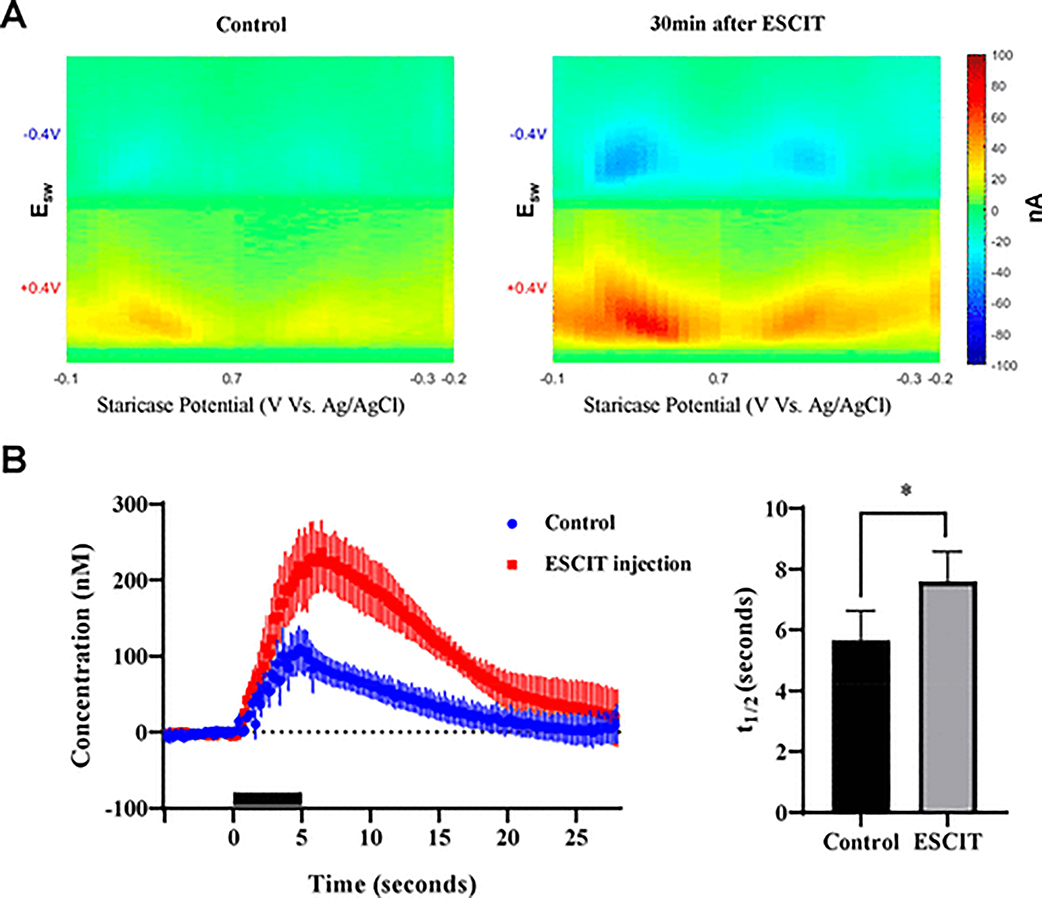
Although N-shaped fast scan cyclic voltammetry (N-FSCV) is well-established as an electroanalytical method to measure extracellular serotonin concentrations in vivo, it is in need of improvement in both sensitivity and selectivity. Based on our previous studies using fast cyclic square-wave voltammetry (FCSWV) for in vivo dopamine measurements, we have modified this technique to optimize the detection of serotonin in vivo. A series of large amplitude square-shaped potentials was superimposed onto an N-shaped waveform to provide cycling through multiple redox reactions within the N-shaped waveform to enhance the sensitivity and selectivity to serotonin measurement when combined with a two-dimensional voltammogram. N-Shaped fast cyclic square-wave voltammetry (N-FCSWV) showed significantly higher sensitivity to serotonin compared to conventional N-FSCV. In addition, N-FCSWV showed better performance than conventional N-shaped FSCV in differentiating serotonin from its major interferents, dopamine and 5-hydroxyindoleascetic acid (5-HIAA). It was also confirmed that the large amplitude of the square waveform did not influence local neuronal activity, and it could monitor electrical stimulation evoked phasic release of serotonin in the rat substantia nigra pars reticulata (SNr) before and after systemic injection of escitalopram (ESCIT, 10 mg/kg i.p.), a serotonin selective reuptake inhibitor.
Conflict of interest statement
The authors declare no competing financial interest.
Figures

Similar articles
-
Fast Cyclic Square-Wave Voltammetry To Enhance Neurotransmitter Selectivity and Sensitivity.Anal Chem. 2018 Nov 20;90(22):13348-13355. doi: 10.1021/acs.analchem.8b02920. Epub 2018 Nov 8. Anal Chem. 2018. PMID: 30358389
-
Wireless Instantaneous Neurotransmitter Concentration System: electrochemical monitoring of serotonin using fast-scan cyclic voltammetry--a proof-of-principle study.J Neurosurg. 2010 Sep;113(3):656-65. doi: 10.3171/2010.3.JNS091627. J Neurosurg. 2010. PMID: 20415521 Free PMC article.
-
Tonic Serotonin Measurements In Vivo Using N-Shaped Multiple Cyclic Square Wave Voltammetry.Anal Chem. 2021 Dec 28;93(51):16987-16994. doi: 10.1021/acs.analchem.1c02131. Epub 2021 Dec 2. Anal Chem. 2021. PMID: 34855368 Free PMC article.
-
Recent advances in fast-scan cyclic voltammetry.Analyst. 2020 Feb 17;145(4):1087-1102. doi: 10.1039/c9an01925a. Analyst. 2020. PMID: 31922162 Free PMC article. Review.
-
Hitchhiker's Guide to Voltammetry: Acute and Chronic Electrodes for in Vivo Fast-Scan Cyclic Voltammetry.ACS Chem Neurosci. 2017 Feb 15;8(2):221-234. doi: 10.1021/acschemneuro.6b00393. Epub 2017 Feb 9. ACS Chem Neurosci. 2017. PMID: 28127962 Free PMC article. Review.
Cited by
-
Automatic and Reliable Quantification of Tonic Dopamine Concentrations In Vivo Using a Novel Probabilistic Inference Method.ACS Omega. 2021 Mar 3;6(10):6607-6613. doi: 10.1021/acsomega.0c05217. eCollection 2021 Mar 16. ACS Omega. 2021. PMID: 33748573 Free PMC article.
-
Feasibility of Applying Fourier Transform Electrochemical Impedance Spectroscopy in Fast Cyclic Square Wave Voltammetry for the In Vivo Measurement of Neurotransmitters.Anal Chem. 2021 Dec 7;93(48):15861-15869. doi: 10.1021/acs.analchem.1c02308. Epub 2021 Nov 28. Anal Chem. 2021. PMID: 34839667 Free PMC article.
-
Maximizing Electrochemical Information: A Perspective on Background-Inclusive Fast Voltammetry.Anal Chem. 2024 Apr 23;96(16):6097-6105. doi: 10.1021/acs.analchem.3c04938. Epub 2024 Apr 10. Anal Chem. 2024. PMID: 38597398 Free PMC article. Review.
-
Cocaine increases stimulation-evoked serotonin efflux in the nucleus accumbens.J Neurophysiol. 2022 Mar 1;127(3):714-724. doi: 10.1152/jn.00420.2021. Epub 2022 Jan 5. J Neurophysiol. 2022. PMID: 34986049 Free PMC article.
-
Stable in-vivo electrochemical sensing of tonic serotonin levels using PEDOT/CNT-coated glassy carbon flexible microelectrode arrays.Biosens Bioelectron. 2023 Jun 15;230:115242. doi: 10.1016/j.bios.2023.115242. Epub 2023 Mar 21. Biosens Bioelectron. 2023. PMID: 36989659 Free PMC article.
References
-
- Nikolaus S; Müller H-W; Hautzel H Rev. Neurosci 2016, 27, 27. - PubMed
-
- Owens MJ; Nemeroff CB Clinical Chemistry 1994, 40 (2), 288–295. - PubMed
-
- Abi-Dargham A; Laruelle M; Aghajanian GK; Charney D; Krystal J J. Neuropsychiatry Clin. Neurosci 1997, 9 (1), 1–17. - PubMed
-
- Young SN; Leyton M Pharmacol., Biochem. Behav 2002, 71 (4), 857–65. - PubMed
-
- Justice JB J. Neurosci. Methods 1993, 48 (3), 263–276. - PubMed
Publication types
MeSH terms
Substances
Grants and funding
LinkOut - more resources
Full Text Sources
Miscellaneous
