. 2019 Dec 2;15(12):e1008183.
doi: 10.1371/journal.ppat.1008183. eCollection 2019 Dec.

Fluorescent Crimean-Congo hemorrhagic fever virus illuminates tissue tropism patterns and identifies early mononuclear phagocytic cell targets in Ifnar-/- mice

Affiliations

Fluorescent Crimean-Congo hemorrhagic fever virus illuminates tissue tropism patterns and identifies early mononuclear phagocytic cell targets in Ifnar-/- mice

Stephen R Welch et al. PLoS Pathog. .

Abstract

Crimean-Congo hemorrhagic fever virus (CCHFV, order Bunyavirales, family Nairoviridae, genus Orthonairovirus) is the tick-borne etiological agent of Crimean-Congo hemorrhagic fever (CCHF) in humans. Animals are generally susceptible to CCHFV infection but refractory to disease. Small animal models are limited to interferon-deficient mice, that develop acute fatal disease following infection. Here, using a ZsGreen1- (ZsG) expressing reporter virus (CCHFV/ZsG), we examine tissue tropism and dissemination of virus in interferon-α/β receptor knock-out (Ifnar-/-) mice. We demonstrate that CCHFV/ZsG retains in vivo pathogenicity comparable to wild-type virus. Interestingly, despite high levels of viral RNA in all organs assessed, 2 distribution patterns of infection were observed by both fluorescence and immunohistochemistry (IHC), corresponding to the permissiveness of organ tissues. To further investigate viral dissemination and to temporally define cellular targets of CCHFV in vivo, mice were serially euthanized at different stages of disease. Flow cytometry was used to characterize CCHFV-associated alterations in hematopoietic cell populations and to classify infected cells in the blood, lymph node, spleen, and liver. ZsG signal indicated that mononuclear phagocytic cells in the lymphatic tissues were early targets of infection; in late-stage infection, overall, the highest levels of signal were detected in the liver, and ZsG was found in both antigen-presenting and lymphocyte cell populations.


Conflict of interest statement

The authors have declared that no competing interests exist.

Figures
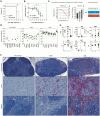
Fig 1
Fig 1. Comparative infections of wild-type CCHFV and reporter CCHFV/ZsG.
(A) Survival and (B) weight change in Ifnar-/- mice inoculated subcutaneously with 100 TCID50 recombinant wild-type CCHFV (CCHFV; black line with circles; n = 5) or recombinant CCHFV expressing ZsG (CCHFV/ZsG; green line with squares; n = 5). Lines represent mean weight change of all individuals on that day; error bars represent ±SD. ns = not significant. (C) Mice were classified into one of 3 disease stage groups based on weight loss and viral RNA levels in liver, spleen, and blood determined by qRT-PCR. Weight loss scoring criteria: 0 to -5% = 1; -6 to -10% = 2; -11 to 15% = 4; -16 to 20% = 6; > -20% = 8. Viral load scoring criteria (values are CCHFV S segment copies/μL): <1 × 105 = 1; <1 × 107 = 2; <1 × 109 = 3; <1 × 1011 = 4. Classification scores: pre-clinical stage: <5; early-stage disease: 5 to 12; late-stage disease: >12. (D) Quantitative RT-PCR was performed based on primer and probe sets specific for CCHFV nucleoprotein (NP) on tissues taken from animals infected with CCHFV (black circles) or CCHFV/ZsG (green squares). Disease severity in animals was classified as either pre-clinical, early, or late using a scoring system based on weight loss and viral tissue load (S1 Table). (E) Clinical chemistry values performed on whole blood samples collected at the time of euthanasia in CCHFV- (black circles) or CCHFV/ZsG- (green squares) infected mice classified as being in pre-clinical (P), early (E), or late (L) stage of disease. Individual values are represented, with means and standard deviation shown. GLU, glucose; ALB, albumin; ALT, alanine aminotransferase; AST, aspartate aminotransferase; BUN, blood urea nitrogen; TP, total protein. ns = not significant; * p < 0.05, ** p < 0.01, *** p < 0.001, **** p < 0.0001. (F) CCHFV NP immunostaining demonstrated a progressive increase in antigen expression at pre-clinical, early-, and late-stage disease in draining (axillary) lymph node, liver, and spleen of representative CCHFV/ZsG-infected Ifnar-/- mice. Survival statistics were calculated using the Mantel-Cox test, weight statistics were calculated using multiple t-tests with Holm-Siddack’s multiple comparison test, and clinical chemistry statistics were calculated using two-way ANOVA with Tukey’s multiple comparison test.
Fig 2
Fig 2. Liver and spleen pathology and CCHFV distribution visualized by immunohistochemistry in mice euthanized at 5 dpi.
Mice displayed similarly severe pathology with abundant CCHFV immunostaining. Livers had widespread, random, and confluent hepatocellular necrosis (see insets) with minimal inflammation. Central veins of these mice contained increased numbers of leukocytes. CCHFV was detectable by immunostaining within necrotic and viable hepatocytes (✱), sinusoidal lining cells (arrows) including Kupffer cells and endothelium, and intravascular leukocytes (arrowheads). In spleens, lymphocytolysis (see insets) and red pulp expansion by histiocytes (✱) were observed, and immunostaining showed scattered CCHFV within lymphoid follicles (arrows) and extensive within red pulp histiocytes (✱). H&E, hematoxylin-eosin staining; IHC, CCHFV immunoalkaline phosphatase staining with naphthol fast red substrate, hematoxylin counterstain. Original magnification: liver, 200×; spleen, 200×.
Fig 3
Fig 3. In situ visualization of CCHFV/ZsG infection.
(A) No ZsG fluorescence was observed in pre-clinical CCHFV/ZsG-infected animals. A mouse infected with wild-type CCHFV is shown to demonstrate background autofluorescence levels when using the fluorescence detection setup; strong autofluorescence is seen in the bladder (due to urine content, see ✱ in right panel), and mild autofluorescence is observed in the intestinal tract. In early-stage CCHFV/ZsG infection, extensive ZsG fluorescence was detected in the livers and lymph nodes of the mice; white arrow head indicates inguinal lymph node. In late-stage CCHFV/ZsG infection, extensive ZsG fluorescence was observed in the liver and lymphoid organs (brachial, mediastinal, inguinal, and lumbar lymph nodes). A single representative animal from each clinical stage is shown; ZsG fluorescence levels in organs were similar between animals. (B) Organ-specific viral distribution patterns were observed in: liver (top left; white arrow represents a transverse cross section of one lobe of the liver); spleen (top middle); kidney and adrenal gland (top right, white arrow represents the adrenal gland, ✱ represents the renal pelvis demonstrating urine autofluorescence); heart and lung (bottom left; white arrow shows diffuse ZsG fluorescence in the lung); intestinal tract showing strong fluorescence in the Peyer’s patches (bottom middle); and reproductive tract (bottom right; white arrow, ovary; black arrow, uterus; ✱, iliac lymph nodes).
Fig 4
Fig 4. Distribution of viral NP antigen visualized by immunohistochemistry (IHC) in a CCHFV/ZsG-infected Ifnar−/− mouse at 6 dpi.
(A) NP immunostaining in parenchymal and lymphoid tissues (top row). NP was visualized in epithelial cells (arrow) and endothelial/intravascular cells (arrowheads), most prominently at the adrenal corticomedullary junction, and scattered staining was seen in macrophages in gut-associated lymphoid tissue (Peyer’s patches). Focal staining was also observed in the ovarian medullary stroma (✱) and in the lamina propria of the terminal oviduct (arrow). NP immunostaining within intravascular leukocytes in various organs (bottom row). Increased intravascular leukocytes with abundant immunostaining were seen in kidney and lung, with rare staining of intracapillary leukocytes and interstitial cells (arrowheads). In the brain and heart, NP was detected in leukocytes within leptomeningeal vessels and in the lumen of the right heart ventricle. IHC: NP immunoalkaline phosphatase staining with naphthol fast red substrate, hematoxylin counterstain. Original magnification: 200×. (B) ZsG fluorescence in embedded fixed issues. Parenchymal and intravascular ZsG signal for infected cells can be visualized without immunostaining using a fluorescent microscope: P = parenchyma (tissue); IV = intravascular; dotted line represents the boundary between the blood vessel and the surrounding tissue.
Fig 5
Fig 5. Cell population kinetics and susceptibility in mice infected with CCHFV/ZsG.
(A) Differences in total absolute numbers of tissue-specific cells were determined for CCHFV/ZsG-infected mice classified as being in the pre-clinical (open circle; n = 4), early (blue square; n = 4), or late (red triangle; n = 2) stage of infection at time of euthanasia. Symbols represent individual animals, with error bars showing means and standard deviation. Dotted line represents the mean and the grey shading represents ±1 SD from mock-infected control animals (n = 6). (B) Graphs represent the ZsG mean fluorescent intensity (MFI) ratio of tissue-specific B cells (CD19+), T cells (CD3+CD4+ and CD3+CD8+), natural killer cells (NK; pNK46+), polymorphonuclear neutrophils (PMN; Ly6G+), immature monocytes/macrophages (CD11b+Ly6C-), activated monocyte/macrophages (CD11b+Ly6C+), and dendritic cells (DC; Lin-CD45+Ly6G-CD11b+MHCII+) over mock-infected controls (n = 6) for CCHFV/ZsG-infected mice classified as being in the pre-clinical (open circle; n = 4), early (blue square; n = 4), or late (red triangle; n = 2) stage of infection at time of euthanasia. Symbols represent individual animals. For both panels, significant change from levels in control animals is represented (if not stated, the difference was not significant). * p < 0.05, ** p < 0.01, *** p < 0.001, **** p < 0.0001. Data were analyzed by multiple t-test, with individual values indicated in a scatter dot plot (means ± SD).
Fig 6
Fig 6. Differential cytokine expression in mice infected with either wild-type CCHFV or CCHFV/ZsG.
(A) Cytokine and chemokine heatmap profiles represents the log10 fold differences in individual plasma cytokine levels or animals classified as being in either the pre-clinical (pre, n = 8), early (n = 10), or late (n = 11) stage of infection relative to those detected in control, mock-infected (n = 6) animals. Cytokine names are shown on the left, and individual animal designations on the bottom. CCL2, monocyte chemotactic protein 1 (MIP-1); CCL3, macrophage inflammatory protein 1α (MIP-1α); CCL4, macrophage inflammatory protein 1β (MIP-1 β); CCL5, regulated upon activation, normal T-cell expressed, and secreted (RANTES); CCL7, monocyte chemotactic protein 3 (MIP-3); CCL11, eosinophil chemotactic protein (eotaxin); CXCL1, chemokine (C-X-C motif) ligand-1 like; CXCL2, chemokine (C-X-C motif) ligand-2 like; macrophage inflammatory protein 2 (MIP-2); interferon-γ–induced protein 10 (IP-10); granulocyte-macrophage colony stimulating factor (GM-CSF); interferon γ (IFN-γ); interleukin (IL); tumor necrosis factor-α (TNF-α). (B) Graphs represent log10 fold differences (ΔΔCt) in select immune genes in the liver or spleen of mice infected with either CCHFV or CCHFV/ZsG, relative to mock-infected controls, in animals classified as in pre-clinical (P, white circles), early- (E, blue squares), or late- (L, red triangles) stage infection. Data were analyzed by multiple t-test, with individual values indicated in a scatter dot plot (means ± SD). * p < 0.05, ** p < 0.01, *** p < 0.001, **** p < 0.0001.

References

    1. Bente DA, Forrester NL, Watts DM, McAuley AJ, Whitehouse CA, Bray M. Crimean-Congo hemorrhagic fever: history, epidemiology, pathogenesis, clinical syndrome and genetic diversity. Antiviral Res. 2013;100: 159–89. 10.1016/j.antiviral.2013.07.006 - DOI - PubMed
    1. Shepherd AJ, Leman PA, Swanepoel R. Viremia and antibody response of small African and laboratory animals to Crimean-Congo hemorrhagic fever virus infection. Am J Trop Med Hyg. 1989;40: 541–547. Available: http://www.ncbi.nlm.nih.gov/pubmed/2499205 10.4269/ajtmh.1989.40.541 - DOI - PubMed
    1. Shepherd AJJ, Swanepoel R, Shepherd SPP, Leman PAA, Mathee O. Viraemic transmission of Crimean-Congo haemorrhagic fever virus to ticks. Epidemiol Infect. 1991;106: 373–82. 10.1017/s0950268800048524 - DOI - PMC - PubMed
    1. World Health Organization. Crimean-Congo haemorrhagic fever (CCHF) [Internet]. https://www.who.int/emergencies/diseases/crimean-congo-haemorrhagic-feve...
    1. Bente DA, Alimonti JB, Shieh WW-J, Camus G, Stroher U, Zaki S, et al. Pathogenesis and Immune Response of Crimean-Congo Hemorrhagic Fever Virus in a STAT-1 Knockout Mouse Model. J Virol. 2010;84: 11089–11100. 10.1128/JVI.01383-10 - DOI - PMC - PubMed

Publication types

Substances

LinkOut - more resources