. 2019 Dec 2;8(11):bio046367.
doi: 10.1242/bio.046367.

Nanog regulates Pou3f1 expression at the exit from pluripotency during gastrulation

Affiliations

Nanog regulates Pou3f1 expression at the exit from pluripotency during gastrulation

Antonio Barral et al. Biol Open. .

Abstract

Pluripotency is regulated by a network of transcription factors that maintain early embryonic cells in an undifferentiated state while allowing them to proliferate. NANOG is a critical factor for maintaining pluripotency and its role in primordial germ cell differentiation has been well described. However, Nanog is expressed during gastrulation across all the posterior epiblast, and only later in development is its expression restricted to primordial germ cells. In this work, we unveiled a previously unknown mechanism by which Nanog specifically represses genes involved in anterior epiblast lineage. Analysis of transcriptional data from both embryonic stem cells and gastrulating mouse embryos revealed Pou3f1 expression to be negatively correlated with that of Nanog during the early stages of differentiation. We have functionally demonstrated Pou3f1 to be a direct target of NANOG by using a dual transgene system for the controlled expression of Nanog Use of Nanog null ES cells further demonstrated a role for Nanog in repressing a subset of anterior neural genes. Deletion of a NANOG binding site (BS) located nine kilobases downstream of the transcription start site of Pou3f1 revealed this BS to have a specific role in the regionalization of the expression of this gene in the embryo. Our results indicate an active role of Nanog inhibiting neural regulatory networks by repressing Pou3f1 at the onset of gastrulation.This article has an associated First Person interview with the joint first authors of the paper.

Keywords: Epiblast; Nanog; Pluripotency; Pou3f1; Regulatory genomics.


Conflict of interest statement

Competing interestsThe authors declare no competing or financial interests.

Figures

Fig. 1.
Fig. 1.
Early transcriptional response to Nanog at the naïve to primed transition. (A) Schematic representation of the experimental setup to address transcriptional changes of control and Nanog mutant ES cells as they transition from the naïve to the primed state. Samples in triplicate were taken in naïve conditions (2i+LIF) and after 12 or 24 h of growth in serum. (B,C) Predicted outcome of the change in expression of genes repressed (B) or activated (C) by Nanog during priming of ES cells. (D) Volcano plot depicting gene expression changes of control ES cells compared to Nanog KO cells in naïve conditions (0 h). In blue, genes upregulated in Nanog KO cells, and in orange genes upregulated in control cells (0.5<LogFC<0.5). In grey genes that have less than [0.5] Log Fold Change (LogFC). Core pluripotency factors are indicated. (E,F) Graphs showing the normalized expression values (average CPM) of genes that are upregulated in Nanog mutant cells across time but not in controls (E, repressed by Nanog), or genes that are upregulated in control cells but not in Nanog mutant (F, activated by Nanog). (G) Heatmap comparing the expression profiles of both set of genes, with representative examples of neural (top) or mesodermal (bottom) genes included in these sets indicated on the right. The set of 89 genes upregulated in NanogKO across time is represented in the upper section of the heatmap. The set of 55 genes upregulated in control wild-type cells across time is represented in the lower section of the heatmap.
Fig. 2.
Fig. 2.
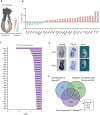
Integration of different RNA-seq datasets to identify transcriptional targets of Nanog. (A) Schematic representation of an E6.5 embryo indicating the diminishing levels of Nanog towards the distal region of the embryo by a black triangle. Red and green triangles represent the positive and negative correlations, respectively, between Nanog and any other given gene. (B) Correlation values of the genes that show the highest statistical correlation with Nanog (green, negative; red, positive) in two different mouse embryo single cell RNA-seq data sets (Mohammed et al., 2017; Scialdone et al., 2016). (C) List of the most downregulated genes in Nanogtg E7.5 embryos where expression of Nanog was induced (dox treated) as compared to controls (Lopez-Jimenez et al., 2019 preprint). Bars indicate the log fold change (LFC) of the differences in expression between Nanog induced and control embryos. (D) In situ hybridization for Nanog, Pou3f1 and Sox2 of Nanogtg embryos treated (+dox) or untreated (−dox) with doxycycline. n=5. Scale bars: 300 µm. (E) Venn diagram showing the intersection of the different RNA-seq datasets analyzed. In blue are all genes significantly upregulated upon Nanog loss of function in ES cells during transition to the primed state (this work); in green, genes that are negatively correlated with Nanog in embryo single cell RNA-seq (Mohammed et al., 2017; Scialdone et al., 2016); and in purple, genes downregulated upon expression of Nanog in E7.5 embryos (Lopez-Jimenez et al., 2019 preprint). Genes found in all three groups are indicated.
Fig. 3.
Fig. 3.
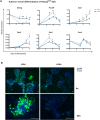
Nanog impedes anterior neural differentiation of ES cells. (A) Expression of selected neural markers, as measured by RT-qPCR, during 6 days of differentiation to anterior neural fate of Nanogtg ES cells with (+dox, blue) or without (−dox, gray) doxycycline. n=3 at each time point; *P<0.01; **P<0.001; ***P<0.0001, by Student's t-test. (B) Immunofluorescence at day 6 of anterior neural differentiation of Nanogtg ES cells with (+dox) or without (−dox) showing nuclei stained with DAPI in blue, and TUJ1 in green. Scale bars: 100 µM.
Fig. 4.
Fig. 4.
Deletion of a NANOG bound region in the Pou3f1 locus expands its expression in the posterior epiblast. (A) Pou3f1 genomic region on chromosome 4 showing binding of NANOG as determined by ChIP-seq in ES cells (ESC) or EpiLC after one (D1) or two (D2) days of differentiation D2. Data was obtained from Murakami et al. (2016). (B) Percentage of embryos without (wild-type genotype) or with the expected deletion (del. genotype) recovered at E6.5 after microinjection of Cas9 and pairs of sgRNAs targeting each of the three NANOG bound regions in the Pou3f1 locus (−11.5 kb, −9 kb, +9 kb). In gray, percentage of embryos showing a normal expression pattern of Pou3f1 (wild-type phenotype) and in blue those showing expansion of expression in the posterior region of the epiblast (expanded expression phenotype). Below, Fisher’s exact test P-value for differences of expression patterns (phenotypes) between genotypes. (C) In situ hybridization for Pou3f1 in E6.5 embryos showing the normal expression pattern (wild-type phenotype) and the extended expression in the posterior epiblast (white arrow) due to the deletion by transient transgenics of the +9 kb NANOG-bound genomic region (expanded expression phenotype). The extent of Pou3f1 expression is indicated by a dashed white line. (D) Sequence of the +9 kb NANOG-bound genomic region from Pou3f1 (mm10, chr4:124,666,818-124,667,185). gRNAs are shown in blue, the consensus NANOG binding motif in black, and the region deleted in the stable +9 kb deletion mouse line in grey. (E) In situ hybridization for Pou3f1 in heterozygous (left) and homozygous (right) E6.5 embryos from the +9 kb deletion mouse line. White arrowhead indicates the posterior expansion in expression observed in homozygote embryos. The number of embryos showing an expansion of Pou3f1 expression is indicated for each genotype. Scale bars (C,E): 300 µm.

References

    1. Acloque H., Wilkinson D. G. and Nieto M. A. (2008). Chapter 9 in situ hybridization analysis of chick embryos in whole-mount and tissue sections. Methods Cell Biol. 87, 169-185. 10.1016/S0091-679X(08)00209-4 - DOI - PubMed
    1. Aires R., Jurberg A. D., Leal F., Nóvoa A., Cohn M. J. and Mallo M. (2016). Oct4 is a key regulator of vertebrate trunk length diversity. Dev. Cell 38, 262-274. 10.1016/j.devcel.2016.06.021 - DOI - PubMed
    1. Ariza-McNaughton L. and Krumlauf R. (2002). Non-radioactive in situ hybridization: simplified procedures for use in whole-mounts of mouse and chick embryos. Int. Rev. Neurobiol. 47, 239-250. 10.1016/S0074-7742(02)47062-6 - DOI - PubMed
    1. Bassalert C., Valverde-Estrella L. and Chazaud C. (2018). Primitive endoderm differentiation: from specification to epithelialization. Curr. Top. Dev. Biol. 128, 81-104. 10.1016/bs.ctdb.2017.12.001 - DOI - PubMed
    1. Bell K. M., Western P. S. and Sinclair A. H. (2000). SOX8 expression during chick embryogenesis. Mech. Dev. 94, 257-260. 10.1016/S0925-4773(00)00296-3 - DOI - PubMed