

Next-generation Interactomics: Considerations for the Use of Co-elution to Measure Protein Interaction Networks
- PMID: 31792070
- PMCID: PMC6944233
- DOI: 10.1074/mcp.R119.001803
Next-generation Interactomics: Considerations for the Use of Co-elution to Measure Protein Interaction Networks
Abstract
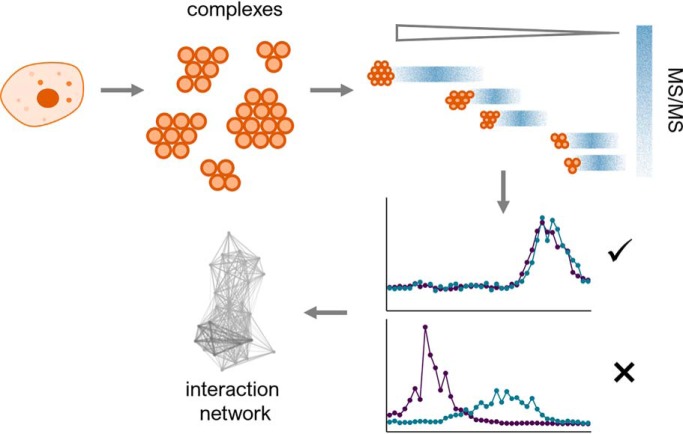
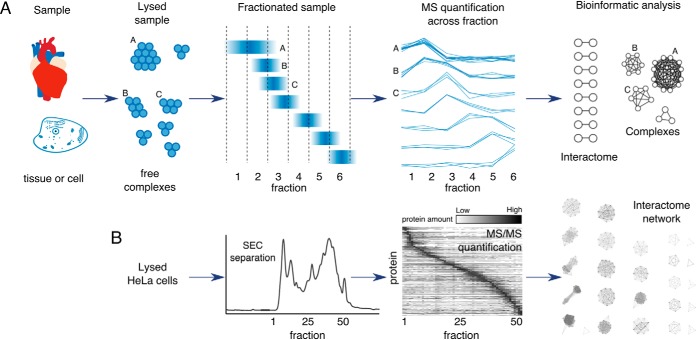
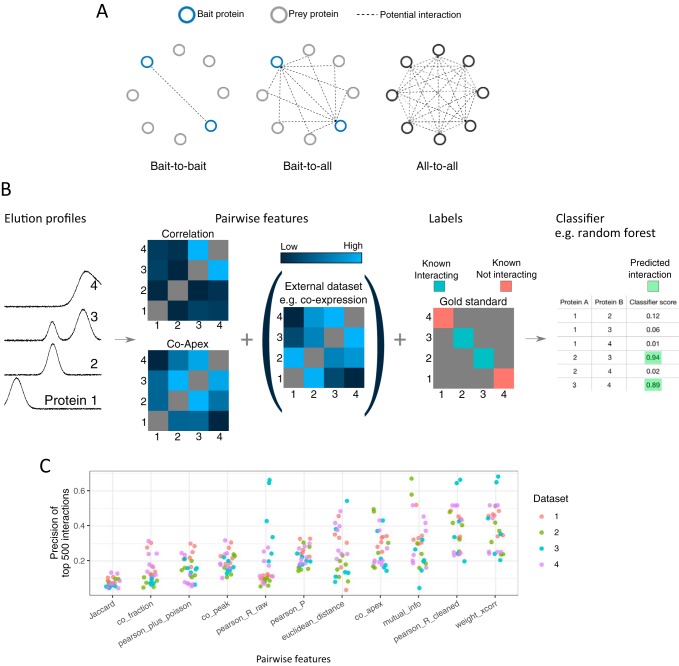
Understanding how proteins interact is crucial to understanding cellular processes. Among the available interactome mapping methods, co-elution stands out as a method that is simultaneous in nature and capable of identifying interactions between all the proteins detected in a sample. The general workflow in co-elution methods involves the mild extraction of protein complexes and their separation into several fractions, across which proteins bound together in the same complex will show similar co-elution profiles when analyzed appropriately. In this review we discuss the different separation, quantification and bioinformatic strategies used in co-elution studies, and the important considerations in designing these studies. The benefits of co-elution versus other methods makes it a valuable starting point when asking questions that involve the perturbation of the interactome.
Keywords: Protein-protein interactions; SILAC; bioinformatics; chromatography; co-elution; co-fractionation; complexes; interactome; mass spectrometry; protein complex analysis; protein correlation profiling; separation technologies.
© 2020 Salas et al.
Conflict of interest statement
The authors declare that they have no conflicts of interest with the contents of this article
Figures
References
-
- Huttlin E. L., Bruckner R. J., Paulo J. A., Cannon J. R., Ting L., Baltier K., Colby G., Gebreab F., Gygi M. P., Parzen H., Szpyt J., Tam S., Zarraga G., Pontano-Vaites L., Swarup S., White A. E., Schweppe D. K., Rad R., Erickson B. K., Obar R. A., Guruharsha K. G., Li K., Artavanis-Tsakonas S., Gygi S. P., and Harper J. W. (2017) Architecture of the human interactome defines protein communities and disease networks. Nature 545, 505–509 - PMC - PubMed
-
- Hein M. Y., Hubner N. C., Poser I., Cox J., Nagaraj N., Toyoda Y., Gak I. A., Weisswange I., Mansfeld J., Buchholz F., Hyman A. A., and Mann M. (2015) A human interactome in three quantitative dimensions organized by stoichiometries and abundances. Cell 163, 712–723 - PubMed
-
- Aebersold R., and Mann M. (2016) Mass-spectrometric exploration of proteome structure and function. Nature 537, 347–355 - PubMed
-
- Altelaar A. F. M., Munoz J., and Heck A. J. R. (2013) Next-generation proteomics: towards an integrative view of proteome dynamics. Nat. Rev. Genet. 14, 35–48 - PubMed
-
- Titeca K., Lemmens I., Tavernier J., and Eyckerman S. (2019) Discovering cellular protein-protein interactions: Technological strategies and opportunities. Mass Spectrom. Rev. 38, 79–111 - PubMed
Publication types
MeSH terms
Substances
LinkOut - more resources
Full Text Sources
