. 2020 Feb 20;88(3):e00824-19.
doi: 10.1128/IAI.00824-19. Print 2020 Feb 20.

Major Histocompatibility Complex Class II-Restricted, CD4+ T Cell-Dependent and -Independent Mechanisms Are Required for Vaccine-Induced Protective Immunity against Coxiella burnetii

Affiliations

Major Histocompatibility Complex Class II-Restricted, CD4+ T Cell-Dependent and -Independent Mechanisms Are Required for Vaccine-Induced Protective Immunity against Coxiella burnetii

Lindsey Ledbetter et al. Infect Immun. .

Abstract

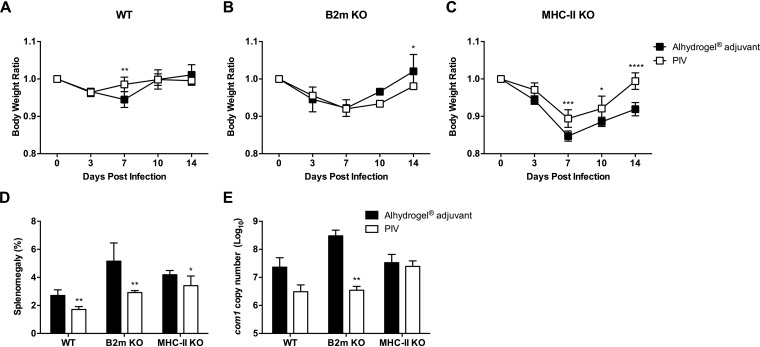
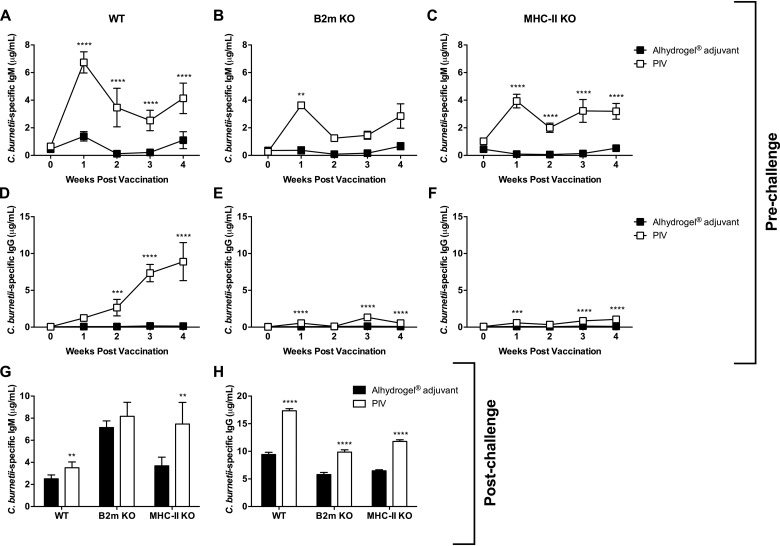
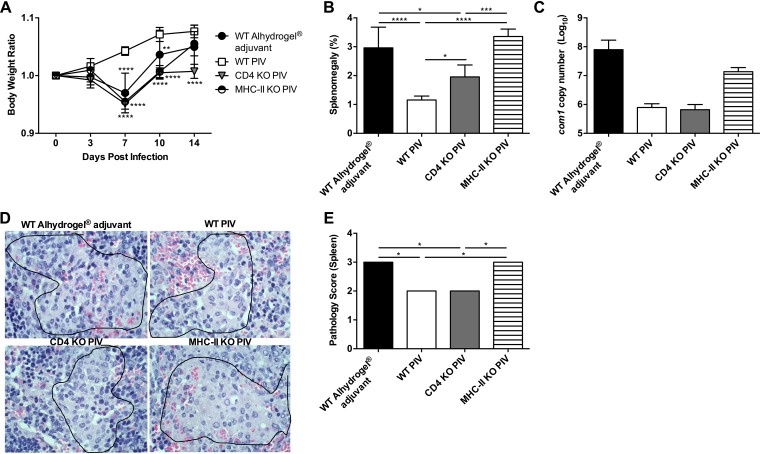
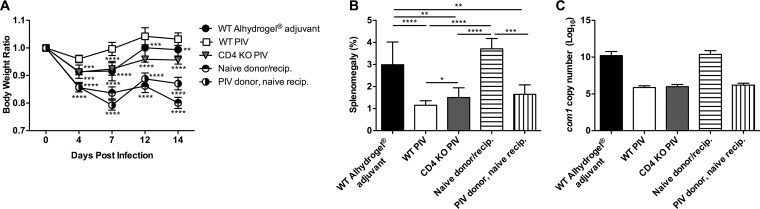
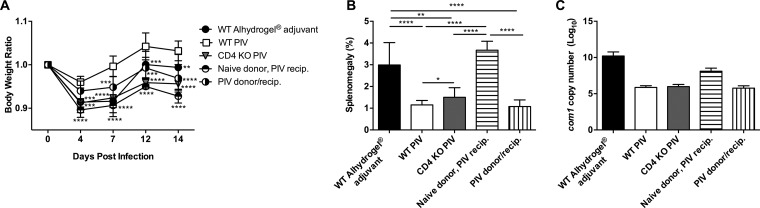
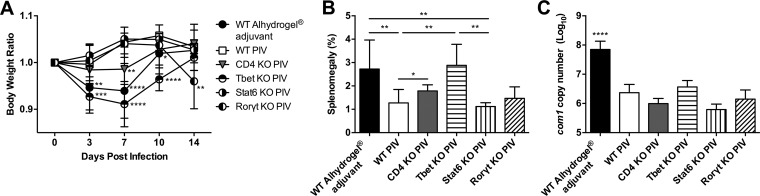
To understand the role of major histocompatibility complex class I (MHC-I) and MHC-II in vaccine-mediated protection against Coxiella burnetii, we evaluated the protective efficacy of a formalin-inactivated C. burnetii Nine Mile phase I vaccine (PIV) in β2-microglobulin-deficient (B2m KO) and MHC-II-deficient (MHC-II KO) mice. Vaccination reduced disease severity in wild-type (WT) and B2m KO mice but failed to reduce bacterial burden in MHC-II KO mice. This suggests that the MHC-II antigen presentation pathway is required for PIV-mediated protection against C. burnetii infection. MHC-I and MHC-II affect antibody isotype switching, since both PIV-vaccinated B2m KO and MHC-II KO mice produced less Coxiella-specific IgG than PIV-vaccinated WT mice. Interestingly, MHC-II and CD4 deficiencies were not equivalent in terms of splenomegaly and bacterial clearance. This demonstrates a partial role for CD4+ T cells while revealing MHC-II-restricted, CD4-independent mechanisms. Adoptive transfer of CD4+ T cells from PIV-vaccinated WT mice to naive CD4-deficient (CD4 KO) mice demonstrated that antigen-experienced CD4+ T cells are sufficient to generate protection. Conversely, transfer of naive CD4+ T cells to PIV-vaccinated CD4 KO mice exacerbates disease. Using Tbet-deficient (Tbet KO) mice, we showed a partial role for Th1 subset CD4+ T cells in vaccine protection. Furthermore, Th1-independent roles for Tbet were suggested by significant differences in disease between PIV-vaccinated Tbet KO and CD4 KO mice. Interferon gamma was shown to contribute to the host inflammatory response but not bacterial clearance. Collectively, these findings suggest that vaccine-induced protective immunity against a murine model of experimental Q fever requires MHC-II-restricted, CD4+ T cell-dependent and -independent mechanisms that can be exploited for a new-generation human Q fever vaccine.

Keywords: CD4+ T cells; Coxiella burnetii; IFN-γ; Tbet-deficient mice; Th1 response; major histocompatibility complex; vaccine-induced immunity.


Figures

FIG 1
FIG 1
MHC-II is important for PIV-mediated protection against C. burnetii. B2m-deficient (B2m KO), MHC-II-deficient (MHC-II KO), and WT C57BL/6 mice were vaccinated s.c. with 10 μg of formalin-inactivated C. burnetii Nine Mile phase I vaccine (PIV) and challenged i.p. with 1 × 107 genomic copies of C. burnetii NMI 28 days postvaccination (dpv). Mice receiving Alhydrogel adjuvant alone served as unvaccinated controls. (A to C) Relative body weights calculated throughout the infection. (D and E) Splenomegaly (E) and splenic bacterial burden (E) were evaluated at 14 dpi to compare protection. The results are expressed as the percent splenomegaly, i.e., (spleen weight/body weight) × 100. The bacterial burden was determined by real-time quantitative PCR (qPCR) and is expressed as log10 C. burnetii com1 gene copy numbers. Each experimental group includes five mice, with error bars representing the standard deviations from the mean. *, P < 0.05; **, P < 0.01; ***, P < 0.001; ****, P < 0.0001 (as determined by two-way ANOVA with Sidak’s multiple-comparison test [A to C] or t test [D and E]).
FIG 2
FIG 2
MHC-I and MHC-II are involved in antibody isotype switching. B2m KO, MHC-II KO, and WT C57BL/6 mice were vaccinated s.c. with 10 μg of PIV and challenged i.p. with 1 × 107 genomic copies of C. burnetii NMI 28 dpv. Mice receiving Alhydrogel adjuvant alone served as unvaccinated controls. C. burnetii NMI-specific serum IgM (A to C) and IgG (D to F) were evaluated weekly following vaccination. Specific IgM (G) and IgG (H) were also evaluated 14 dpi. Each experimental group includes five mice, with error bars representing the standard deviations from the mean. **, P < 0.01; ***, P < 0.001; ****, P < 0.0001 (as determined by two-way ANOVA with Sidak’s multiple-comparison test [A to F] or t test [G and H]).
FIG 3
FIG 3
MHC-II-dependent vaccine protection is partially dependent on CD4+ T cells. CD4-deficient (CD4 KO), MHC-II KO, and WT C57BL/6 mice were vaccinated s.c. with 10 μg of PIV and challenged i.p. with 1 × 107 genomic copies of C. burnetii NMI 28 dpv. Mice receiving Alhydrogel adjuvant alone served as unvaccinated controls. (A) The relative body weight was determined throughout the infection. Splenomegaly (B) and splenic bacterial burden (C) were assessed 14 dpi to compare protection. (D and E) Spleen sections from WT, CD4 KO, and MHC-II KO mice were evaluated 14 dpi for histiocytic inflammation in red pulp based on the following scale: 0, no accumulations of macrophages; 1, small accumulations of macrophages; 2, small to moderate accumulations of macrophages; and 3, moderate to large accumulations of macrophages. Differences in spleen volume between groups were largely the result of extramedullary hematopoiesis. The results are expressed as the percent splenomegaly, i.e., (spleen weight/body weight) × 100. The bacterial burden was determined by real-time quantitative PCR (qPCR) and is expressed as log10 C. burnetii com1 gene copy numbers. Each experimental group includes five mice, with error bars representing the standard deviations from the mean. *, P < 0.05; **, P < 0.01; ***, P < 0.001; ****, P < 0.0001 (as determined by two-way ANOVA with Dunnett’s multiple-comparison test [A], one-way ANOVA with Tukey’s multiple-comparison test [B and C], or Kruskal-Wallis with Dunn’s multiple-comparison test [E]).
FIG 4
FIG 4
CD4+ T cells are important for antibody isotype switching. WT, CD4 KO, and MHC-II KO mice were vaccinated and challenged as previously described. Mice receiving Alhydrogel adjuvant alone served as unvaccinated controls. C. burnetii NMI-specific serum IgM and IgG were evaluated weekly until 28 dpv (A) and 14 dpi (B). Each experimental group includes five mice, with error bars representing the standard deviations from the mean. *, P < 0.05; **, P < 0.01; ****, P < 0.0001 (as determined by two-way ANOVA with Tukey’s multiple-comparison test [A] or one-way ANOVA with Tukey’s multiple-comparison test [B]).
FIG 5
FIG 5
CD4+ T cells from PIV-vaccinated mice are sufficient to generate protection. CD4 KO and WT C57BL/6 mice were vaccinated s.c. with 10 μg of PIV and challenged i.p. with 1 × 107 genomic copies of C. burnetii NMI 28 dpv. Naive CD4 KO mice received 5 × 106 purified CD4+ T cells by i.p. injection from either naive or PIV-vaccinated WT mice 24 h before infection. Mice receiving Alhydrogel adjuvant alone served as unvaccinated controls. (A) The relative body weight was measured throughout the infection. Splenomegaly (B) and splenic bacterial burden (C) were evaluated at 14 dpi to compare protection. The results are expressed as the percent splenomegaly, i.e., (spleen weight/body weight) × 100. Bacterial burden was determined by real-time quantitative PCR (qPCR) and is expressed as log10 C. burnetii com1 gene copy numbers. The experiments with results shown in Fig. 5 and 6 were performed concurrently, so the WT Alhydrogel adjuvant, WT PIV, and CD4 KO PIV groups represented in these figures are identical. Each experimental group includes five mice, with error bars representing the standard deviations from the mean. *, P < 0.05; **, P < 0.01; ***, P < 0.001; ****, P < 0.0001 (as determined by two-way ANOVA with Dunnett’s multiple-comparison test [A] or one-way ANOVA with Tukey’s multiple-comparison test [B and C]).
FIG 6
FIG 6
CD4+ T cells from naive mice are detrimental to protection. CD4 KO and WT C57BL/6 mice were vaccinated s.c. with 10 μg of PIV and challenged i.p. with 1 × 107 genomic copies of C. burnetii NMI 28 dpv. PIV-vaccinated CD4 KO mice received 5 × 106 purified CD4+ T cells by i.p. injection from either naive or PIV-vaccinated WT mice at 24 h before infection. Mice receiving Alhydrogel adjuvant alone served as unvaccinated controls. (A) The relative body weight was calculated throughout the infection. Splenomegaly (B) and splenic bacterial burden (C) were evaluated at 14 dpi to compare protection. The results are expressed as the percent splenomegaly, i.e., (spleen weight/body weight) × 100. Bacterial burden was determined by real-time quantitative PCR (qPCR) and is expressed as log10 C. burnetii com1 gene copy numbers. The experiments with results shown in Fig. 5 and 6 were performed concurrently, so the WT Alhydrogel adjuvant, WT PIV, and CD4 KO PIV groups represented in these figures are identical. Each experimental group includes five mice, with error bars representing the standard deviations from the mean. *, P < 0.05; **, P < 0.01; ***, P < 0.001; ****, P < 0.0001 (as determined by two-way ANOVA with Dunnett’s multiple-comparison test [A] or one-way ANOVA with Tukey’s multiple-comparison test [B and C]).
FIG 7
FIG 7
Tbet plays a role in vaccine protection that partially depends on Th1 CD4+ T cells. Tbet-deficient (Tbet KO), Stat6-deficient (Stat6 KO), RORγt-deficient (RORγt KO), CD4 KO, and WT C57BL/6 mice were vaccinated s.c. with 10 μg of PIV and challenged i.p. with 1 × 107 genomic copies of C. burnetii NMI 28 dpv. Mice receiving Alhydrogel adjuvant alone served as unvaccinated controls. (A) The relative body weight was determined throughout the infection. Splenomegaly (B) and splenic bacterial burden (C) were evaluated at 14 dpi to compare protection. The results are expressed as the percent splenomegaly, i.e., (spleen weight/body weight) × 100. The bacterial burden was determined by real-time quantitative PCR (qPCR) and is expressed as log10 C. burnetii com1 gene copy numbers. Each experimental group includes five mice, with error bars representing the standard deviations from the mean. *, P < 0.05; **, P < 0.01; ***, P < 0.001; ****, P < 0.0001 (as determined by two-way ANOVA with Dunnett’s multiple-comparison test [A] or one-way ANOVA with Tukey’s multiple-comparison test [B and C]).
FIG 8
FIG 8
IFN-γ modulates inflammation but may not be involved in bacterial clearance. IFN-γ-deficient (IFN-γ KO) and WT C57BL/6 mice were vaccinated s.c. with 10 μg of PIV and challenged i.p. with 1 × 107 genomic copies of C. burnetii NMI 28 dpv. Mice receiving Alhydrogel adjuvant alone served as unvaccinated controls. (A) Relative body weight was measured throughout infection. (B) Splenomegaly and (C) splenic bacterial burden were evaluated at 14 dpi to compare protection. The results are expressed as the percent splenomegaly, i.e., (spleen weight/body weight) × 100. The bacterial burden was determined by real-time quantitative PCR (qPCR) and is expressed as log10 C. burnetii com1 gene copy numbers. Each experimental group includes five mice, with error bars representing the standard deviations from the mean. *, P < 0.05; **, P < 0.01; ****, P < 0.0001 (as determined by two-way ANOVA with Dunnett’s multiple-comparison test [A] or one-way ANOVA with Tukey’s multiple-comparison test [B and C]).

Similar articles

Cited by

References

    1. CDC. 2019. Q fever. Centers for Disease Control and Prevention, Atlanta, GA: https://www.cdc.gov/qfever/.
    1. Raoult D, Marrie T, Mege J. 2005. Natural history and pathophysiology of Q fever. Lancet Infect Dis 5:219–226. doi:10.1016/S1473-3099(05)70052-9. - DOI - PubMed
    1. Akamine CM, Perez ML, Lee JH, Ing MB. 2019. Q fever in southern California: a case series of 20 patients from a VA medical center. Am J Trop Med Hyg 101:33–39. doi:10.4269/ajtmh.18-0283. - DOI - PMC - PubMed
    1. Baca OG, Paretsky D. 1983. Q fever and Coxiella burnetii: a model for host-parasite interactions. Microbiol Rev 47:127–149. - PMC - PubMed
    1. Maurin M, Raoult D. 1999. Q fever. Clin Microbiol Rev 12:518–553. doi:10.1128/CMR.12.4.518. - DOI - PMC - PubMed

Publication types

MeSH terms