. 2019 Dec 2;10(1):5364.
doi: 10.1038/s41467-019-13339-3.

DNA methylation in AgRP neurons regulates voluntary exercise behavior in mice

Affiliations

DNA methylation in AgRP neurons regulates voluntary exercise behavior in mice

Harry MacKay et al. Nat Commun. .

Abstract

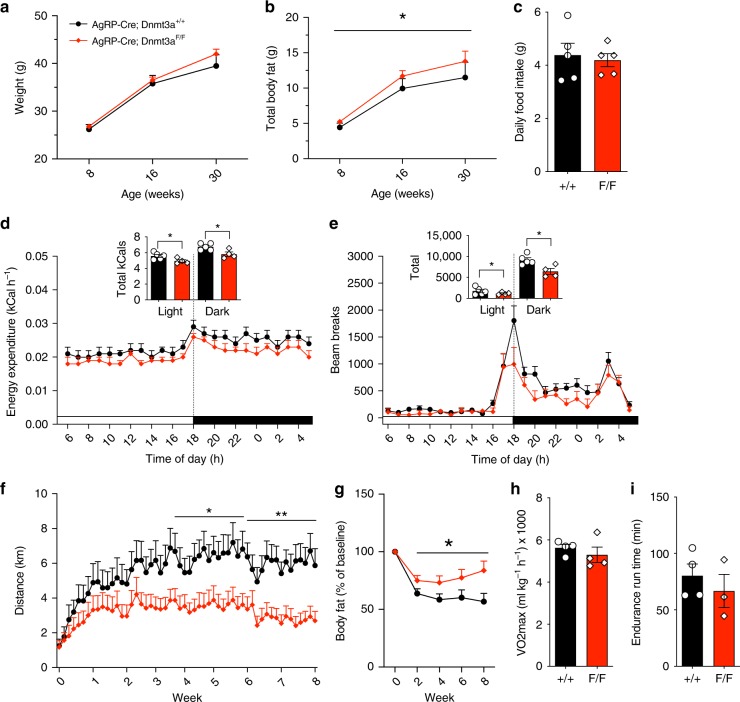
DNA methylation regulates cell type-specific gene expression. Here, in a transgenic mouse model, we show that deletion of the gene encoding DNA methyltransferase Dnmt3a in hypothalamic AgRP neurons causes a sedentary phenotype characterized by reduced voluntary exercise and increased adiposity. Whole-genome bisulfite sequencing (WGBS) and transcriptional profiling in neuronal nuclei from the arcuate nucleus of the hypothalamus (ARH) reveal differentially methylated genomic regions and reduced expression of AgRP neuron-associated genes in knockout mice. We use read-level analysis of WGBS data to infer putative ARH neural cell types affected by the knockout, and to localize promoter hypomethylation and increased expression of the growth factor Bmp7 to AgRP neurons, suggesting a role for aberrant TGF-β signaling in the development of this phenotype. Together, these data demonstrate that DNA methylation in AgRP neurons is required for their normal epigenetic development and neuron-specific gene expression profiles, and regulates voluntary exercise behavior.


Conflict of interest statement

The authors declare no competing interests.

Figures

Fig. 1
Fig. 1
AgRP neuron-specific knockout of Dnmt3a reduces DNA methylation in AgRP neurons. a Dnmt3a expression peaks in the postnatal ARH at P12 (n = 5–8 per timepoint). b Immunostaining for Dnmt3a shows that AgRP/NPY neurons (labeled by GFP) express Dnmt3a at P10 (inset: 63× confocal image, NPY+; DNMT3A+ neurons indicated by arrow). Scale = 10 μm. c AgRP neuron-specific Dnmt3a knockout does not affect AgRP neuronal density, t(13) = 0.55, p = 0.59, n = 5–8. d Relative to +/+ mice, AgRP neurons (labeled by SynTom) of F/F mice show reduced levels of 5-methylcytosine; left—representative immunofluorescent labeling of 5-mC in SynTom+ AgRP neurons (inset: 63× confocal image, representative AgRP neurons indicated by arrow), right—quantitation of 5-mC labeling intensity in AgRP neurons, t(8) = 2.64, p = 0.03, n = 5. Scale = 10 μm. Values reflect mean ± SEM. *p < 0.05. Source data for a, c, d are provided as a Source Data file.
Fig. 2
Fig. 2
Sedentary phenotype in F/F mice. a Male F/F mice show no difference in body weight relative to +/+ mice, F(1, 32) = 3.56 Time × Genotype, p = 0.068, n = 6–12. b Male F/F mice show increased adiposity F(1, 33) = 4.75 main effect of Genotype, p = 0.036, n = 6–13. c Male F/F mice show no difference in daily food intake, whether adjusted or unadjusted (not shown) for lean and fat body mass, F(1, 6) = 0.003 main effect of Genotype, p = 0.955, n = 5. d Reduced energy expenditure in F/F mice. Inset: total caloric expenditure in light and dark periods, F(1, 15) = 7.649 Genotype × Sex interaction, p = 0.014, post-hoc comparison in male mice p = 0.042, n = 4–5. e Reduced locomotor activity in F/F mice. Inset: total locomotion in light and dark periods, F(1, 7) = 8.359, p = 0.023 main effect of Genotype, n = 4–5. f When given free access to a running wheel, F/F mice ran about half as much as +/+ mice (data represent animals from two independent experiments, F(3, 72) = 7.258 Time × Genotype, p = 0.009). g When given access to running wheels, F/F mice lose less body fat than +/+ mice, F(4, 96) = 3.60, p = 0.009 Genotype × Time, F(1, 24) = 4.77, p = 0.0039 main effect of Genotype, n = 13. h and i Metabolic treadmill testing shows that VO2Max (h), t(6) = 0.83, p = 0.436, and endurance run time at 60% of VO2Max (i), t(5) = 0.781, p = 0.47, do not differ between F/F and +/+ mice, n = 3–4. Values reflect mean ± SEM. ***p < 0.001, **p < 0.01, *p < 0.05. Source data for ai are provided as a Source Data file.
Fig. 3
Fig. 3
Widespread changes in DNA methylation and gene expression point to disruptions in melanocortin and GABAergic neural signaling. a Illustration of experimental strategy to limit cellular heterogeneity by microdissection of ARH at P12 followed by NeuN immunolabelling to isolate neuronal nuclei by FACS. b Representative FACS plot showing gating strategy used to isolate neural (NeuN+) nuclei (see also Supplementary Fig. 3A). c Violin plot showing genomic localization and methylation levels of hypomethylated and hypermethylated DMRs in ARH neurons as determined by whole-genome bisulfite sequencing. Hypermethylated DMRs predominate in F/F mice except in CpG island, 5′-UTR and enhancer regions. d Proportional genomic distribution of hypo- and hypermethylated DMRs. e Gene ontology (GO) function analysis of GREAT-defined22 cis-regulatory region-associated DMRs shows significant enrichment of genes associated with melanocortin signaling, GABAergic neurotransmission, and TGF-β signaling among hypomethylated DMRs (left). Genes belonging to the melanocortin signaling GO term tend to be downregulated in F/F mice, while genes associated with GABAergic neurotransmission tend to be upregulated in F/F mice (right). f Correlogram showing Pearson correlation coefficients (R) between DMR methylation level in each genomic region relative to other regions in the same gene, and expression of the associated gene. g Significant changes in the expression of GABA synthesis genes (Gad1), receptor subunits (Gabra2, 4, 5), and transporters (Slc6a1, Slc6a11). h Differential expression of genes specific to defined ARH neural cell types. Cell types are ranked according to ratio of down- to upregulated genes characteristic of that cell type. Numbers of significantly down- and upregulated genes associated with each cell type are provided. Inset: representative density plot showing log2 fold change values for differentially expressed genes enriched in Agrp_Sst neurons relative to a background list of all genes with significant differential expression. p-Values represent results of χ2 test against background list of significantly up- and downregulated genes. Values reflect mean ± SEM; n = 3–5, *p < 0.05, ***p < 0.001. Source data for g provided as a Source Data file.
Fig. 4
Fig. 4
Read-level analysis of WGBS data points to epigenetic dysregulation in cell type-specific genes. a Illustration of strategy for pinpointing cell type-specific loss of methylation from read-level WGBS data. Searching for differentially methylated read clusters in 100 bp genomic bins enables inferences about changes taking place in individual cell types. Clusters comprise least 4 reads (see Methods); single reads are shown here for simplicity. Hypomethylated read clusters specific to F/F mice likely originate from AgRP neurons, whereas substantially methylated read clusters specific to F/F mice may arise from secondary effects in other cell types. b For each bin with both a cluster unique to F/F and a cluster unique to +/+ mice, average methylation levels of the unique clusters are shown in a density plot. Bins in ‘sector 2’ are defined by the simultaneous absence of a substantially methylated (≥ 55%) read cluster in +/+ mice and appearance of a novel hypomethylated (≤ 45%) read cluster in +/+ mice. ‘Sector 4’ is defined conversely. c Circos plot showing density of sectors 2 and 4 bins located in promoter regions of genes. Right: Venn diagram shows minimal overlap of sectors 2 and 4 promoter bins. d Promoter bins for differentially expressed genes specific to the molecularly defined ARH neural cell types Gm8773/Tac1, Arx/Nr5a2, Tbx19, unassigned2, Slc17a6/Trhr, and Trh/Lef125 are enriched in sector 4 relative to sector 2, suggesting that these cell types contribute to the observed hypermethylation in F/F ARH neurons as a whole. Bars represent −log10(p) of χ2 tests comparing cell type-specific sectors 2 and 4 bins relative to a background list of all sectors 2 and 4 bins (*p < 0.05). Numbers in parentheses represent ratio of sector 2:sector 4 bin counts. e Plot showing the location of promoter bins for differentially expressed genes specific to Arx/Nr5a2 ARH neurons. Plot coordinates follow the same convention as b.
Fig. 5
Fig. 5
Reduced Bmp7 methylation and increased expression in AgRP neurons lacking Dnmt3a. a Bins in sector 4 were associated with GO terms related to TGF-β and SMAD signaling. b Genes associated with sector 4 bins were enriched for proteins containing SMAD/FHA domains. c MEME-ChIP analysis shows that a SMAD2 and SMAD3 transcription factor binding motif is enriched among hypermethylated DMRs, suggesting that establishment of hypermethylation in F/F mice is downstream of TGF-β signaling. d Increased expression of bone morphogenetic protein (Bmp) signalers Bmp5 and Bmp7, as well as downregulation of Bmpr1a and Bmpr2 receptor subunits and altered expression of Smad2, Smad4, and Smad5. Values represent mean ± SEM. e Gene diagram showing location of sector 2 bin in promoter region of Bmp7. Tanghulu plots of read-level CpG methylation data show clusters of hypomethylated reads unique to F/F neurons. Inset: plot showing location of Bmp7 promoter bin in sector 2. f Representative photomicrograph showing immunohistochemical localization and laser capture microdissection of AgRP neuron-enriched mediobasal ARH. Arrows indicate AgRP neurons (identified by SynTom immunostaining). White dashed lines indicate AgRP neuron-rich mediobasal ARH boundaries. Black dashed lines indicate ARH neuroanatomical boundaries. Scale bars indicate 100 μm. g Quantitative bisulfite pyrosequencing of the Bmp7 promoter region identified in j (CpG positions 1–4) plus 100 bp downstream (CpG positions 5–9). Linear mixed model analysis indicates significantly decreased Bmp7 methylation in the AgRP neuron-enriched mediobasal ARH (+/+ −F/F = −37.1% ± 4.49, df = 18.3, p = 0.0002). Linear mixed models were calculated using animal (n = 6–8) as a random factor. h Fluorescent in situ hybridization analysis of Agrp and Bmp7 co-expression. Scale bars = 10 μm. i Linear mixed model analysis of fluorescent in situ hybridization data shows increased Bmp7 expression in AgRP neurons (+/+ −F/F= −17.55 ± 6.68, df = 10.07, p = 0.025) but not in non-AgRP cells (+/+ −F/F = −6.38 ± 6.66, df = 9.89, p = 0.36). Linear mixed models were calculated using animal (n = 3) as a random factor with n = 90–111 cells per condition); *p < 0.05, ***p < 0.001. Source data for d and g are provided as a Source Data file.

References

    1. Garland T, et al. The biological control of voluntary exercise, spontaneous physical activity and daily energy expenditure in relation to obesity: human and rodent perspectives. J. Exp. Biol. 2011;214:206–229. doi: 10.1242/jeb.048397. - DOI - PMC - PubMed
    1. Kohl HW, et al. The pandemic of physical inactivity: global action for public health. Lancet. 2012;380:294–305. doi: 10.1016/S0140-6736(12)60898-8. - DOI - PubMed
    1. Lightfoot JT, et al. Biological/genetic regulation of physical activity level: consensus from GenBioPAC. Med. Sci. Sports Exerc. 2018;50:863–873. doi: 10.1249/MSS.0000000000001499. - DOI - PMC - PubMed
    1. Eclarinal, J. D. et al. Maternal exercise during pregnancy promotes physical activity in adult offspring. FASEB J.30, 2541–2548 (2016). - PMC - PubMed
    1. Baker MS, Li G, Kohorst JJ, Waterland Ra. Fetal growth restriction promotes physical inactivity and obesity in female mice. Int. J. Obes. 2015;39:98–104. doi: 10.1038/ijo.2013.146. - DOI - PMC - PubMed

Publication types

Substances