. 2019 Dec 2;9(1):18118.
doi: 10.1038/s41598-019-54741-7.

Telomerase increasing compound protects hippocampal neurons from amyloid beta toxicity by enhancing the expression of neurotrophins and plasticity related genes

Affiliations

Telomerase increasing compound protects hippocampal neurons from amyloid beta toxicity by enhancing the expression of neurotrophins and plasticity related genes

Natalie Baruch-Eliyahu et al. Sci Rep. .

Abstract

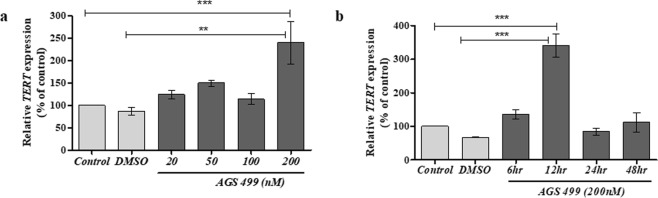
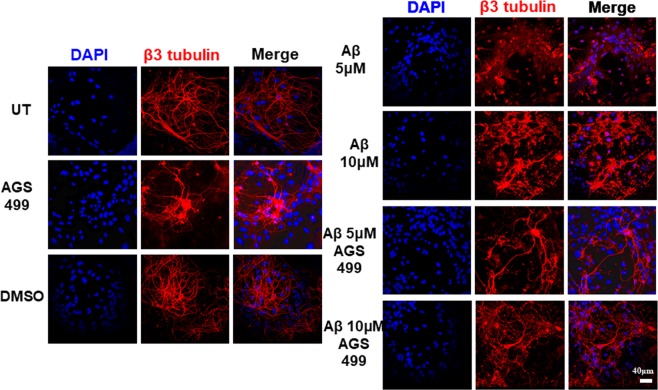
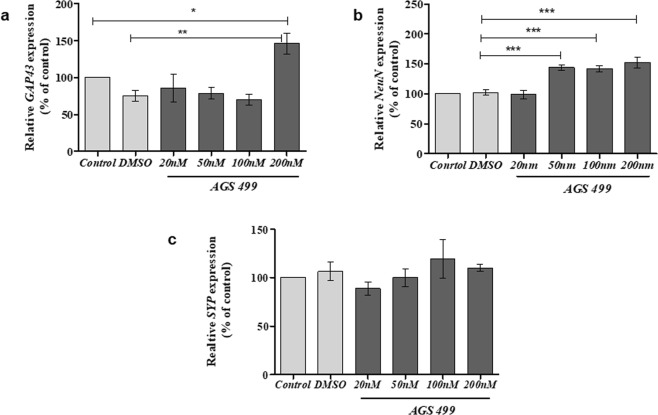
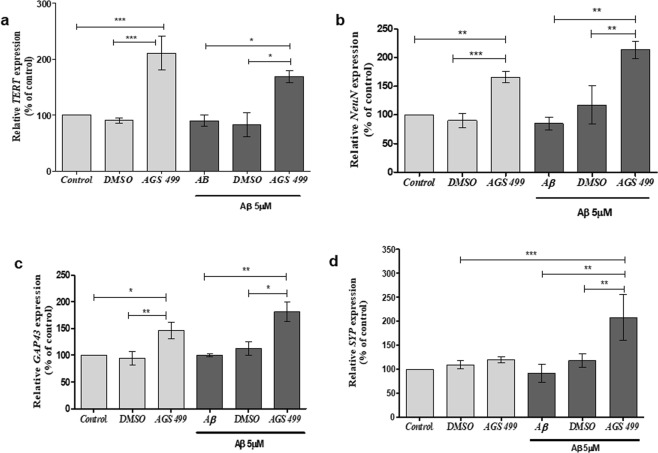
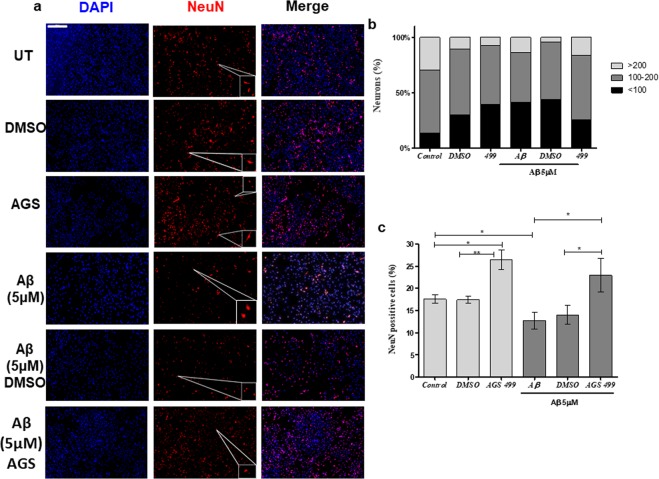
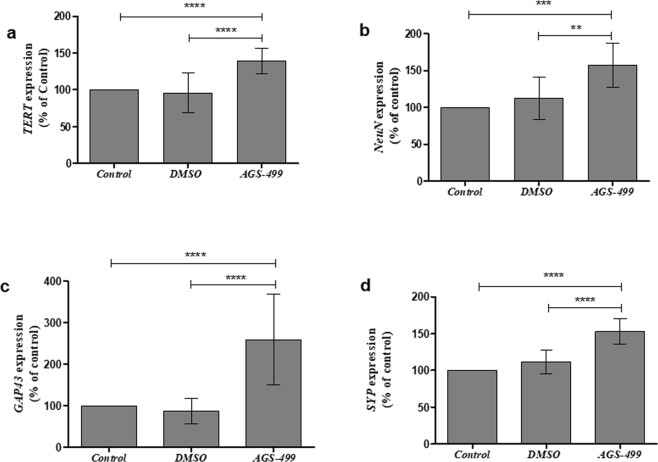
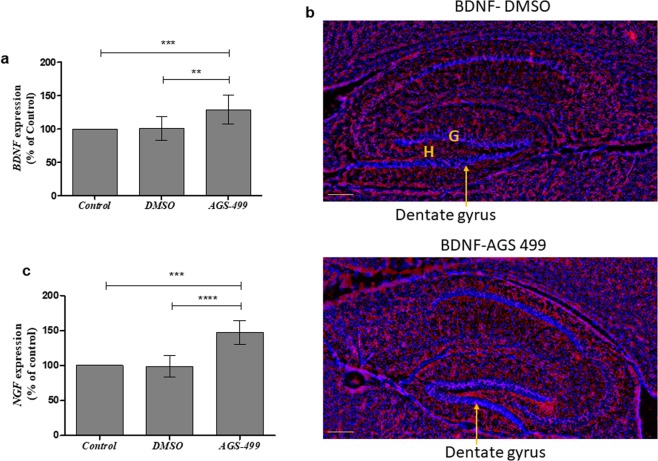
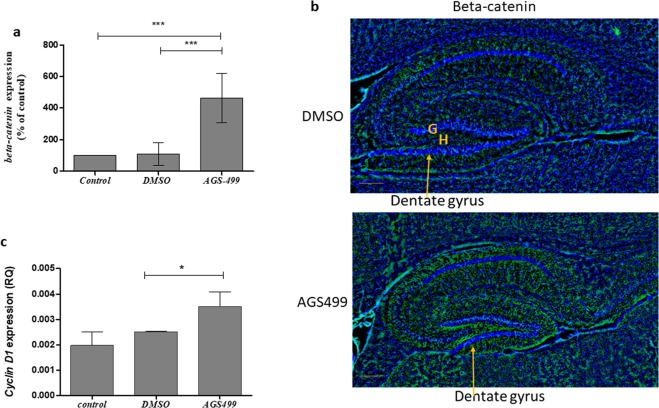
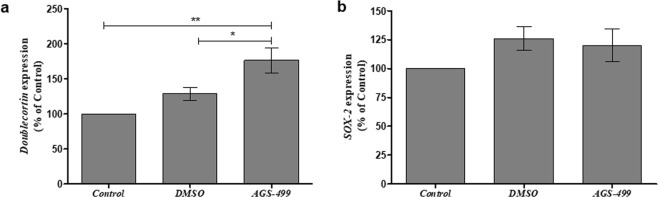
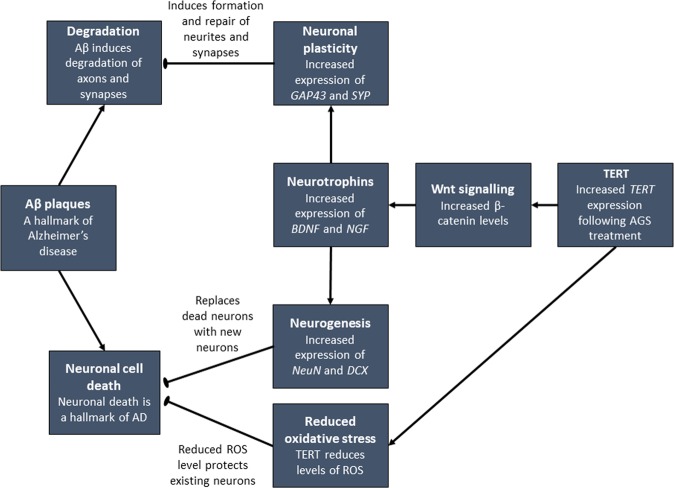
The telomerase reverse transcriptase protein, TERT, is expressed in the adult brain and its exogenic expression protects neurons from oxidative stress and from the cytotoxicity of amyloid beta (Aβ). We previously showed that telomerase increasing compounds (AGS) protected neurons from oxidative stress. Therefore, we suggest that increasing TERT by AGS may protect neurons from the Aβ-induced neurotoxicity by influencing genes and factors that participate in neuronal survival and plasticity. Here we used a primary hippocampal cell culture exposed to aggregated Aβ and hippocampi from adult mice. AGS treatment transiently increased TERT gene expression in hippocampal primary cell cultures in the presence or absence of Aβ and protected neurons from Aβ induced neuronal degradation. An increase in the expression of Growth associated protein 43 (GAP43), and Feminizing locus on X-3 genes (NeuN), in the presence or absence of Aβ, and Synaptophysin (SYP) in the presence of Aβ was observed. GAP43, NeuN, SYP, Neurotrophic factors (NGF, BDNF), beta-catenin and cyclin-D1 expression were increased in the hippocampus of AGS treated mice. This data suggests that increasing TERT by pharmaceutical compounds partially exerts its neuroprotective effect by enhancing the expression of neurotrophic factors and neuronal plasticity genes in a mechanism that involved Wnt/beta-catenin pathway.


Conflict of interest statement

E.P. filed a patent on the AGS compounds. N.B.R., V.R. and A.B. declare no potential conflict of interest. All authors declare no financial interest.

Figures

Figure 1
Figure 1
AGS increases TERT gene expression levels in a time and concentration dependent manner in a primary hippocampal cell culture. (a) Cultures were treated for 12 hr with AGS-499 at concentrations of 20 nM, 50 nM, 100 nM, and 200 nM or with its vehicle DMSO. (b) Cultures were treated with AGS-499 at a concentration of 200 nM for 6 hr, 12 hr, 24 hr, and 48 hr periods. RNA was extracted from cultures and converted to cDNA using a reverse transcriptase kit. Expression levels were quantified using RT-PCR and normalized to the untreated control (Control). The results are Mean ± SEM, n = 4 independent experiments), ANOVA test ***p < 0.001 **p < 0.005.
Figure 2
Figure 2
AGS Improves hippocampal neuron morphology and reduces Aβ induced neuronal degradation in primary hippocampal cell cultures. The cell culture was treated with/without oligomeric Aβ for 48 hrs and AGS-499 (or DMSO) was added to the culture medium every 24 hrs. Immunofluorescent staining using DAPI and anti β-III tubulin antibody after 48 hours of the various treatments was performed. Slides were visualized using confocal microscopy (FluoView FV1000 Olympus). Scale bar: 40 μm
Figure 3
Figure 3
AGS increases TERT and neuronal gene expression levels in a primary hippocampal cell culture. Cultures were treated for 12 hr with AGS-499 at concentrations of 20 nM, 50 nM, 100 nM, and 200 nM or with its vehicle DMSO. RNA was extracted from cultures and genes Expression levels were quantified using RT-PCR and normalized to the untreated control (Control). (a) The effects of AGS-499 treatment on the expression of GAP43 gene. (b) The effects of AGS-499 treatment on the expression of Synaptophysin gene. (c) The effects of AGS-499 treatment on the expression of NeuN gene. The results are Mean±SEM, n=4 independent experiments), ANOVA test *p<0.05, **p<0.01.
Figure 4
Figure 4
AGS increases TERT and neuronal gene expression levels in Aβ treated cultures. Cultures were treated for 36 hr. with AGS-499 (200 nM) alone, Aβ (5 µM) alone, and Aβ (5 µM) in combination with AGS-499 (200 nM) or its vehicle DMSO. AGS or DMSO treatments were renewed after 24 hr. Genes Expression levels were quantified using RT-PCR and normalized to the untreated control (Control). (a) Relative TERT gene expression in cultures (Mean ± SEM, n = 5 independent experiments), ANOVA test *p < 0.05, ***p < 0.001. (b) Relative NeuN gene expression in cultures (Mean ± SEM, n = 4 independent experiments), ANOVA test **p < 0.01, ***p < 0.001. (c) Relative GAP43 gene expression in cultures (Mean ± SEM, n = 4 independent experiments), ANOVA test *p < 0.05, **p < 0.01. (d) Relative SYP gene expression in cultures (Mean ± SEM, n = 4 independent experiments), ANOVA test **p < 0.01, ***p < 0.001.
Figure 5
Figure 5
AGS increases BDNF but not NGF gene expression in both Aβ treated and untreated cultures. Cultures were treated for 36 hr. with AGS-499 (200 nM) alone, Aβ (5 µM) alone, and Aβ (5 µM) in combination with AGS-499 (200 nM) or with its vehicle DMSO. AGS or DMSO treatments were renewed after 24 hr. Expression levels were quantified using RT-PCR and normalized to the untreated control (Control). (a) Relative BDNF gene expression in cultures (Mean ± SEM, n = 5 independent experiments), ANOVA test ***p < 0.001. (b) Relative NGF gene expression in cultures (Mean ± SEM, n = 5 independent experiments), ANOVA test.
Figure 6
Figure 6
AGS increases the relative amount of NeuN positive cells, and protects from neurodegeneration. (a) Immunofluorescent staining using DAPI and NeuN after 48 hours of the indicated various treatments compared to an untreated control. Slides were visualized using a panoramic slide scanner (Panoramic Midi II scanner 3DHISTECH, Budapest, Hungary). Scale bar: 500 μm.The enlarged images were obtained using the sniping tool software for the selected area in the pictures (b) Cell size distribution. Cell size was determined using CellProfiler software. Cell sizes were divided into 3 groups of arbitrary size. Cells with a size smaller than 100 pixels (<100), a size of between 100 and 200 pixels (100–200) and cells larger than 200 pixels (>200). (c) Relative amount of NeuN positive cells. Normalized to total amount of DAPI stained cells. (Mean ± SEM, n = 5), ANOVA test *p < 0.05, **p < 0.01.
Figure 7
Figure 7
AGS increases the expression of TERT and neuronal genes in vivo. Mice were injected subcutaneously with AGS-499 in a concentration of 6 mg /kg of body mass. After 12 hr., mice were sacrificed. Expression levels were quantified using RT-PCR and normalized to the untreated control (Control). (a) Relative TERT gene expression in-vivo, in hippocampi (Mean ± SEM, n = 7 mice per group), ANOVA test ****p < 0.0001. (b) Relative NeuN gene expression in-vivo, in hippocampi (Mean ± SEM, n = 7 mice per group), ANOVA test **p < 0.01, ***p < 0.001. (c) Relative GAP43 gene expression in-vivo, in hippocampi (Mean ± SEM, n = 7 mice per group), ANOVA test ****p < 0.0001. (d) Relative SYP gene expression in-vivo, in hippocampi (Mean ± SEM, n = 7 mice per group), ANOVA test ****p < 0.0001.
Figure 8
Figure 8
AGS increases neurotrophins expression levels in vivo. Mice were injected subcutaneously with AGS-499 in a concentration of 6 mg per kg of body mass. After 12 hr., mice were sacrificed. (a) Expression levels were quantified using RT-PCR and normalized to the untreated control (Control) and compared to vehicle treated mice. The results are Mean ± SEM, n = 7 mice per group), ANOVA test **p < 0.01, ***p < 0.001. (b)Immunofluorescence analysis of perfusion fixed frozen hippocampal sections was performed using anti BDNF antibody (red) DAPI staining for nucleus (blue).G-granule layer, H-hilus. Scale bare 200 μm. (c) Relative NGF gene expression in-vivo, in hippocampi (Mean ± SEM, n = 7 mice per group), ANOVA test ***p < 0.001, ****p < 0.0001.
Figure 9
Figure 9
AGS increases beta-catenin and cyclin D1 expression. Mice were injected subcutaneously with AGS-499 in a concentration of 6 mg per kg of body mass. After 12 hr., mice were sacrificed. Expression levels were quantified using RT-PCR and normalized to the untreated control (Control) and compared to vehicle treated mice. (a) Relative β-catenin gene expression in-vivo, in hippocampi (Mean ± SEM, n = 7 mice per group), ANOVA test ***p < 0.001. (b) Immunofluorescence analysis of perfusion fixed frozen hippocampal sections was performed using anti beta-catenin antibodies(green) and DAPI staining for nucleus (blue). G-granule layer, H-hilus. Scale bare 200 μm. (c) Relative cyclin D1 gene expression in-vivo, in hippocampi (Mean ± SEM, n = 7 mice per group), Student’s T test *p < 0.05
Figure 10
Figure 10
AGS increases Doublecortin gene but not SOX-2 gene expression in vivo. Mice were injected subcutaneously with AGS-499 in a concentration of 6 mg per kg of body mass. After 12 hr., mice were sacrificed. Expression levels were quantified using RT-PCR and normalized to the untreated control and compare to vehicle. (a) Relative DCX gene expression (Mean ± SEM, n = 6 mice per group), ANOVA test *p < 0.05, **p < 0.01. (b) Relative SOX-2 gene expression (Mean ± SEM, n = 6 mice per group), ANOVA test.
Figure 11
Figure 11
A proposed model for the neuroprotective effects of telomerase increasing compound AGS from the Aβ cytotoxicity in an in-vitro AD model. Increasing TERT expression in hippocampal cells activates the Wnt signaling pathway which upregulates the expression of neurotrophins that increase the expression of neuronal plasticity genes and therefore confer a partial neuroprotective effect from the Aβ induced cytotoxicity.

References

    1. Giardini MA, Segatto M, da Silva MS, Nunes VS, Cano MI. Telomere and telomerase biology. Prog Mol Biol Transl Sci. 2014;125:1–40. doi: 10.1016/B978-0-12-397898-1.00001-3. - DOI - PubMed
    1. Ozturk Mert, Li Yinghui, Tergaonkar Vinay. Current Insights to Regulation and Role of Telomerase in Human Diseases. Antioxidants. 2017;6(1):17. doi: 10.3390/antiox6010017. - DOI - PMC - PubMed
    1. Chiodi I, Mondello C. Telomere-independent functions of telomerase in nuclei, cytoplasm, and mitochondria. Front Oncol. 2012;2:133. doi: 10.3389/fonc.2012.00133. - DOI - PMC - PubMed
    1. Zhou J, Ding D, Wang M, Cong YS. Telomerase reverse transcriptase in the regulation of gene expression. BMB Rep. 2014;47:8–14. doi: 10.5483/BMBRep.2014.47.1.284. - DOI - PMC - PubMed
    1. Martinez P, Blasco MA. Telomeric and extra-telomeric roles for telomerase and the telomere-binding proteins. Nat Rev Cancer. 2011;11:161–176. doi: 10.1038/nrc3025. - DOI - PubMed

Publication types

MeSH terms