. 2019 Dec 2;9(1):18060.
doi: 10.1038/s41598-019-54475-6.

LIN28B affects gene expression at the hypothalamic-pituitary axis and serum testosterone levels

Affiliations

LIN28B affects gene expression at the hypothalamic-pituitary axis and serum testosterone levels

Jaakko T Leinonen et al. Sci Rep. .

Abstract

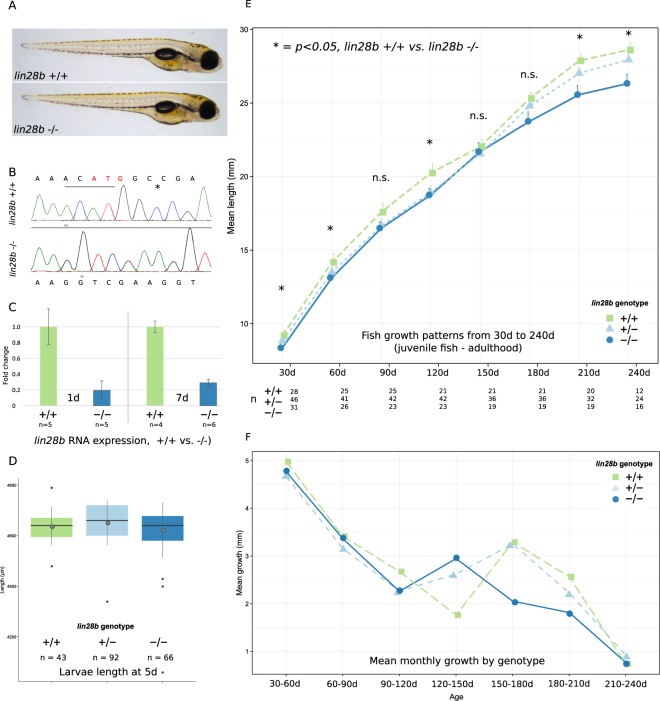
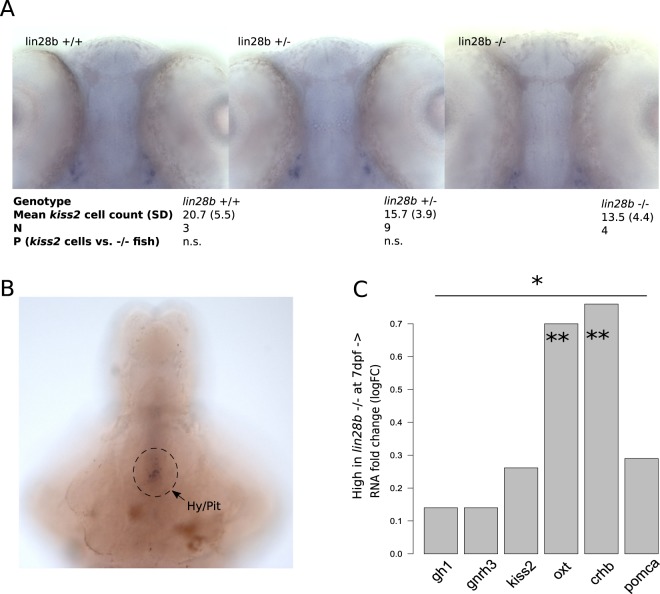
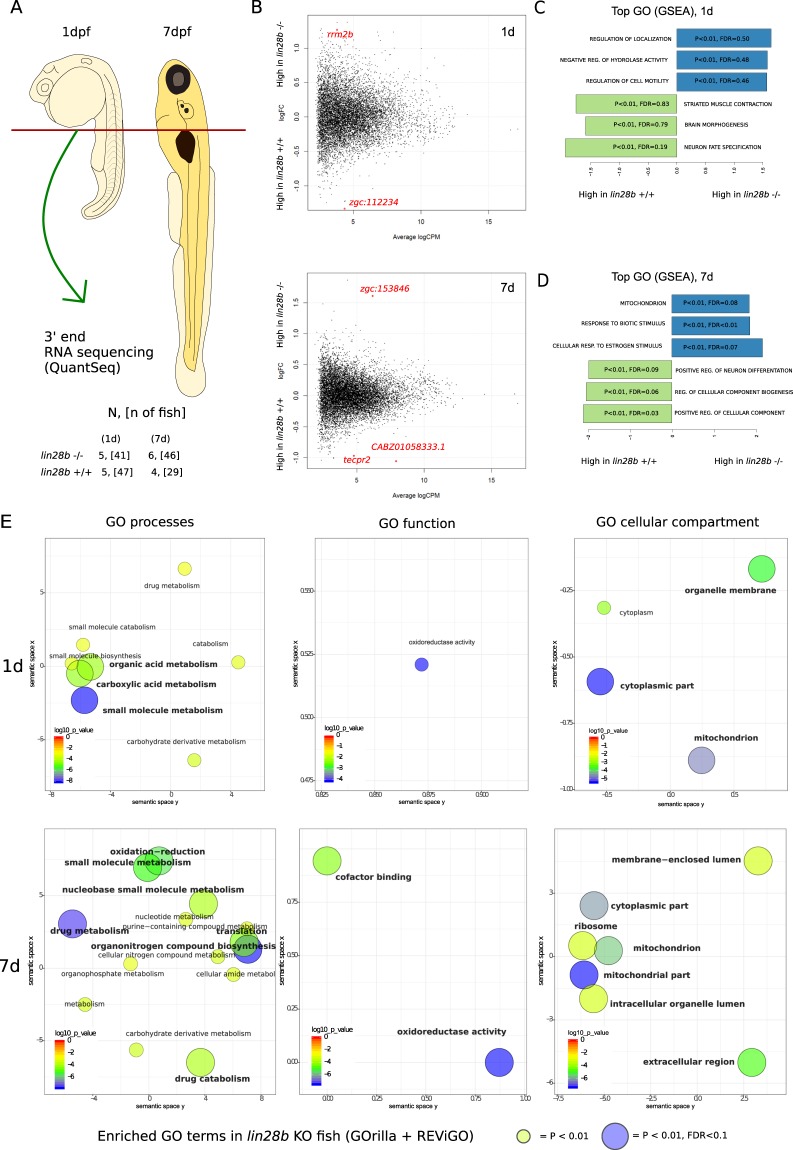
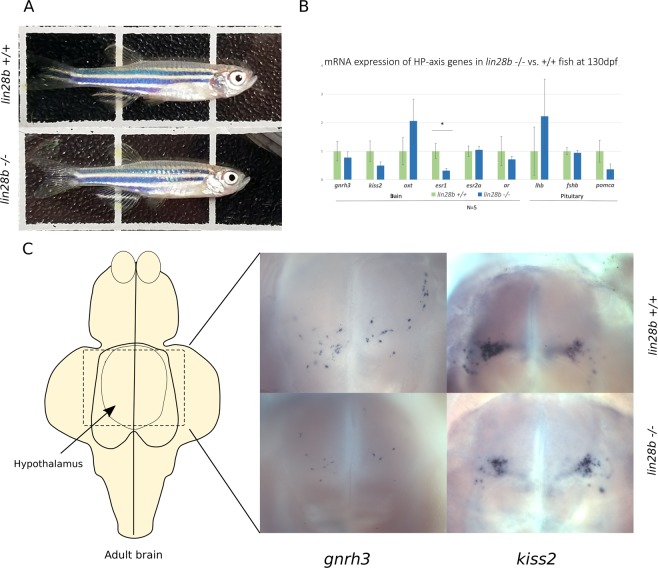
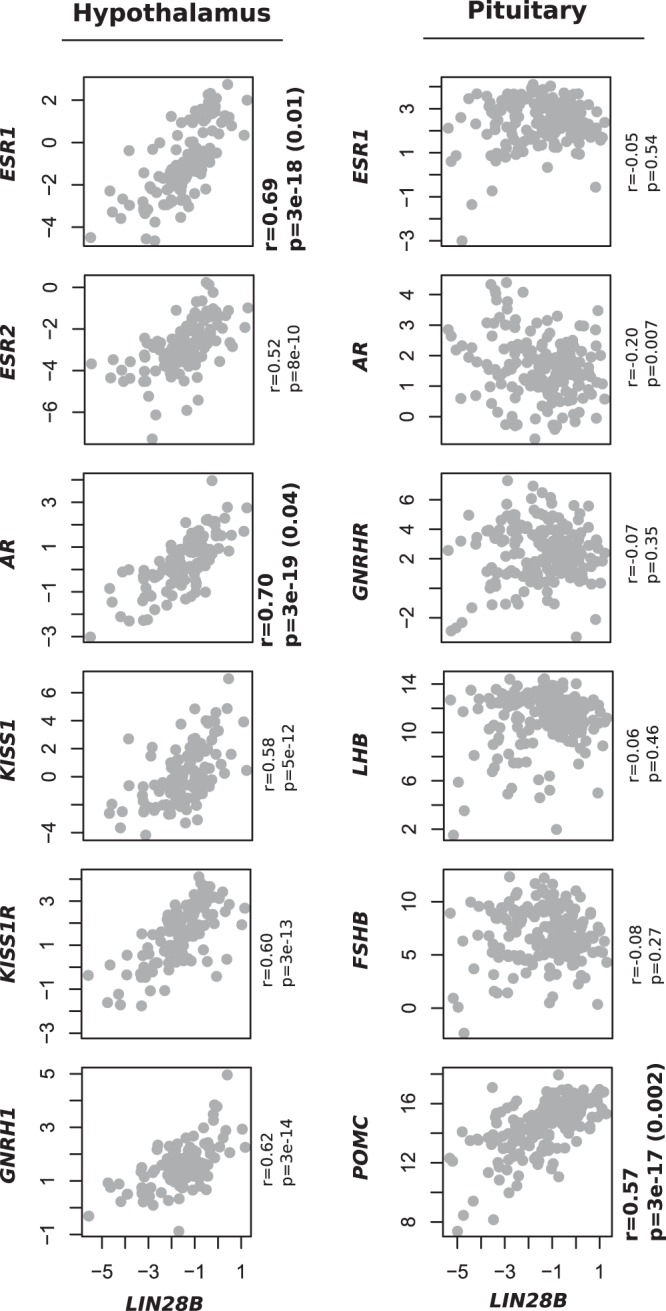
Genome-wide association studies (GWAS) have recurrently associated sequence variation nearby LIN28B with pubertal timing, growth and disease. However, the biology linking LIN28B with these traits is still poorly understood. With our study, we sought to elucidate the mechanisms behind the LIN28B associations, with a special focus on studying LIN28B function at the hypothalamic-pituitary (HP) axis that is ultimately responsible for pubertal onset. Using CRISPR-Cas9 technology, we first generated lin28b knockout (KO) zebrafish. Compared to controls, the lin28b KO fish showed both accelerated growth tempo, reduced adult size and increased expression of mitochondrial genes during larval development. Importantly, data from the knockout zebrafish models and adult humans imply that LIN28B expression has potential to affect gene expression in the HP axis. Specifically, our results suggest that LIN28B expression correlates positively with the expression of ESR1 in the hypothalamus and POMC in the pituitary. Moreover, we show how the pubertal timing advancing allele (T) for rs7759938 at the LIN28B locus associates with higher testosterone levels in the UK Biobank data. Overall, we provide novel evidence that LIN28B contributes to the regulation of sex hormone pathways, which might help explain why the gene associates with several distinct traits.


Conflict of interest statement

The authors declare no competing interests.

Figures

Figure 1
Figure 1
Characteristics and growth patterns of the lin28b KO fish. (A) Images of 5d old lin28b control (+/+) and KO (−/−) larvae (B) Sequencing traces showing the four deleted bases (underlined) + one mismatch (asterisk) in exon1 mutant fish. The bases deleted in the mutants overlap the translation initiation codon for lin28b (in red). (C) Full length lin28b mRNA expression in control vs lin28b KO RNA-Seq samples at 1d and 7d. The expression of lin28b RNA appears downregulated in the KO fish, likely due to NMD related mechanisms. (D) Comparison of the lin28b KO and the control zebrafish size at 5d. No significant size differences were observed at this stage (One-Way-ANOVA with post-hoc Tukey HSD, Error bars = SEM). (E) Growth curves for the lin28b KO and the control fish. The growth of the KO fish was reduced, but the size difference temporarily vanishedaround the time of sexual maturation (One-Way-ANOVA with post-hoc Tukey HSD, Error bars = SEM, *P < 0.05). (F) Mean monthly growth by genotype. Around the period when the fish undergo sexual maturation the growth rate peaks transiently. The lin28b KO fish seem to undergo this transient peak in growth earlier than controls.
Figure 2
Figure 2
Evaluation of the lin28b KO effects on the HP axis in zebrafish larvae. (A) Representative images of kiss2 expression at 3 dpf in the control (+/+), the heterozygous (+/−), and the lin28b KO (−/−) zebrafish. Though this varied between individual samples, the staining location and intensity was comparable between the groups. Despite a trend towards less kiss2 expressing cells in the KO vs. control fish, we did not detect significant differences in the neuron numbers between the samples (Welch Two Sample t-test). The analysis was complicated by the fact that the +/+ group consists of WT fish from the exon3 crosses, whereas 3 out of 4 −/− fish were obtained from exon1 crosses. As the gene expression data from other experiments indicated that kiss2 transcripts are not significantly up- or downregulated in the KO fish, we concluded that the lin28b KO does not prevent normal development of the kiss2 neurons (e.g. C, Supplementary data 2, and Fig. 3). (B) Image of 7 dpf +/+ zebrafish brain showing weak staining by lin28b anti-sense mRNA in the hypothalamic-pituitary region. (C) HP axis RNA expression was slightly upregulated in the KO fish at 7 dpf. The analysis was restricted to hormonal genes that were expressed in high enough quantities to pass filtering in the RNA-seq experiment. Oxytocin (oxt) and corticotrophin-releasing-hormone beta (chrb) appeared upregulated in the KO samples (**p < 0.005, and overall the expression of the studied HP axis genes appeared upregulated in the lin28b KO zebrafish based on the RNAseq data from 7 dpf (*p < 0.05) (Welch two-sample t-test).
Figure 3
Figure 3
Summary of the RNA-Seq experiment examining the global RNA expression in the lin28b mutant fish at 1d and 7d. (A) Sampling and study design. After dissecting the anterior part from embryos/larvae, we pooled 6–10 samples together. The resulting 4–6 biological replicates per group were subjected to RNA sequencing. (B) Plots of mean logFC differences between the lin28b −/− and the +/+ fish at 1dpf (upper panel), and at 7dpf (lower panel). The genes showing significantly different expression in the global analysis (p < 0.00005, FDR < 0.1) are highlighted in red. (C,D) Results from the gene ontology analysis by GSEA, showing the GO categories differentiating between the lin28b −/− and the +/+ groups. E) Enriched GO terms in the lin28b −/− fish from the GOrilla analysis. Upper panels shows the results for the 1dpf fish and the lower panel for the 7dpf zebrafish.
Figure 4
Figure 4
Inspection of the HP axis of the lin28b KO fish after sexual maturation. (A) Images of 130 day old fish (lin28b KO =−/−, lower panel). The KO fish behaved normally and showed no obvious phenotypic differences compared to controls at this stage. (B) qPCR results from 130d old fish evaluating gene expression at the HP axis. The results suggest that esr1 expression is downregulated in the KO brain compared to controls, although for example gnrh3 expression was not significantly different between the groups in the analysis. N = 5 per group, One-Way-ANOVA with post-hoc Tukey HSD, Error bars = SEM, *P < 0.05. Size of the fish used in the qPCR experiment is shown in the Supplementary Table 2. (C) Left: Schematic diagram of adult zebrafish brain (ventral view) with the hypothalamic region in the middle (arrow). Right: visualization of gnrh3 and kiss2 expression in the hypothalami of 210d old lin28b KO (−/−) and control (+/+) fish by in situ hybridization. The localization of gnrh3/kiss2 expression appeared roughly similar, although the number of stained neurons varied between individual samples within each group (2–4 samples per group). The variation appeared potentially related to the size differences of the fish (for samples shown: gnrh3, +/+ size = 32 mm/300 mg; −/−, 27 mm/200 mg; kiss2+/+30 mm/230 mg, −/− 29 mm/190 mg).
Figure 5
Figure 5
LIN28B correlations with hormonal genes in the hypothalamus and pituitary in GTEx. The figures show relative LIN28B expression on the X-axis compared to the expression of selected genes from the hypothalamus in the Y-axis (log2 TPM + 1). LIN28B expression correlated positively with all the tested genes in the hypothalamus (R = 0.58–0.70, P < 8e-10))). Particularly, the expression of ESR1 and AR was upregulated: these genes showed statistically more robust correlations with LIN28B than the majority of the other ~50000 transcripts (p-value in parenthesis). Although GNRHR, LHB and FSHB showed no correlations with LIN28B levels in the pituitary, we observed a statistically significant positive correlation between LIN28B and POMC expression (R = 0.57, P = 3e-17). The correlation with POMC was among the most robust correlations for LIN28B in the pituitary.

References

    1. Day, F. R., Elks, C. E., Murray, A., Ong, K. K. & Perry, J. R. B. Puberty timing associated with diabetes, cardiovascular disease and also diverse health outcomes in men and women: the UK Biobank study. Sci. Rep. 5, 11208, 10.1038/srep11208, https://www.nature.com/articles/srep11208#supplementary-information (2015). - PMC - PubMed
    1. Gajdos ZK, Hirschhorn JN, Palmert MR. What controls the timing of puberty? An update on progress from genetic investigation. Curr Opin Endocrinol Diabetes Obes. 2009;16:16–24. doi: 10.1097/MED.0b013e328320253c. - DOI - PubMed
    1. Day FR, Perry JRB, Ong KK. Genetic Regulation of Puberty Timing in Humans. Neuroendocrinology. 2015;102:247–255. doi: 10.1159/000431023. - DOI - PMC - PubMed
    1. Plant TM. Neuroendocrine control of the onset of puberty. Front. Neuroendocrinol. 2015;38:73–88. doi: 10.1016/j.yfrne.2015.04.002. - DOI - PMC - PubMed
    1. Herbison AE. Control of puberty onset and fertility by gonadotropin-releasing hormone neurons. Nature Reviews. Endocrinology. 2016;12:452. doi: 10.1038/nrendo.2016.70. - DOI - PubMed

Publication types

MeSH terms