. 2020 Jan;38(1):56-65.
doi: 10.1038/s41587-019-0315-8. Epub 2019 Dec 2.

Deciphering eukaryotic gene-regulatory logic with 100 million random promoters

Affiliations

Deciphering eukaryotic gene-regulatory logic with 100 million random promoters

Carl G de Boer et al. Nat Biotechnol. 2020 Jan.

Erratum in

Abstract

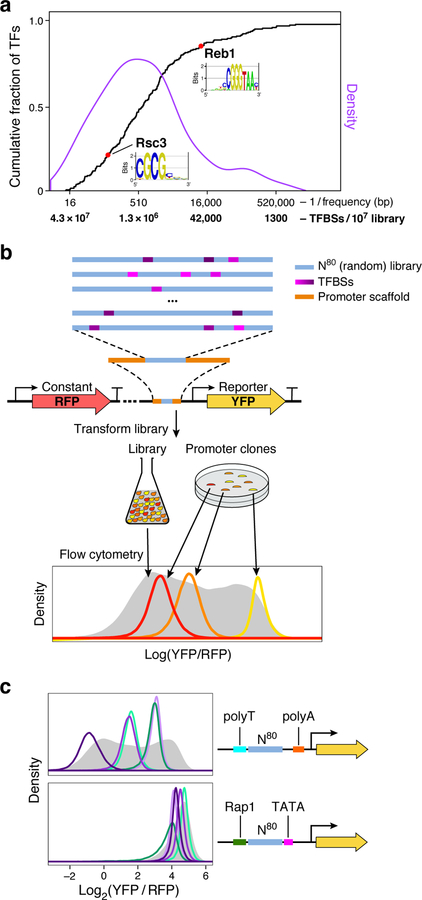
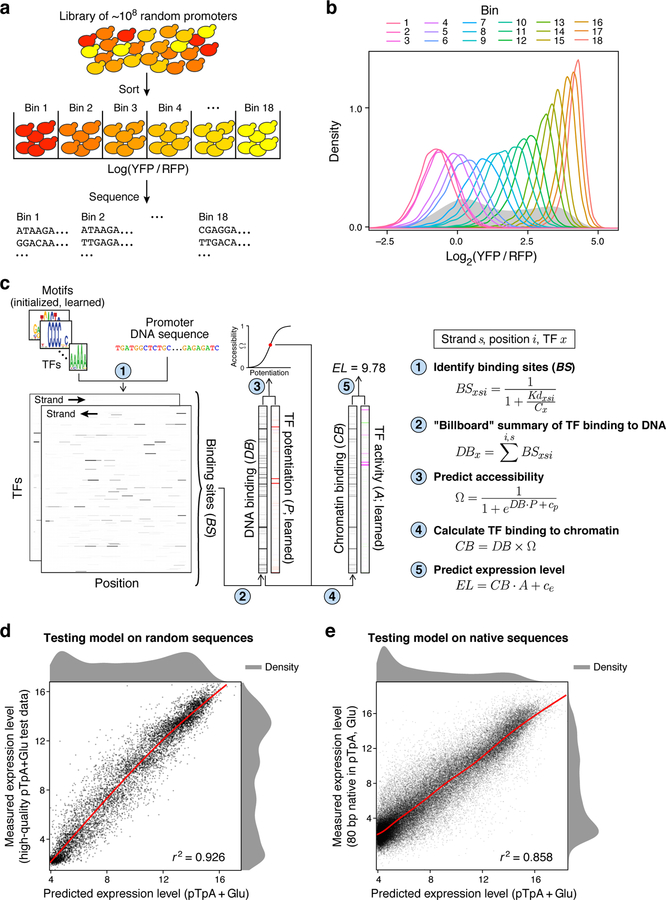
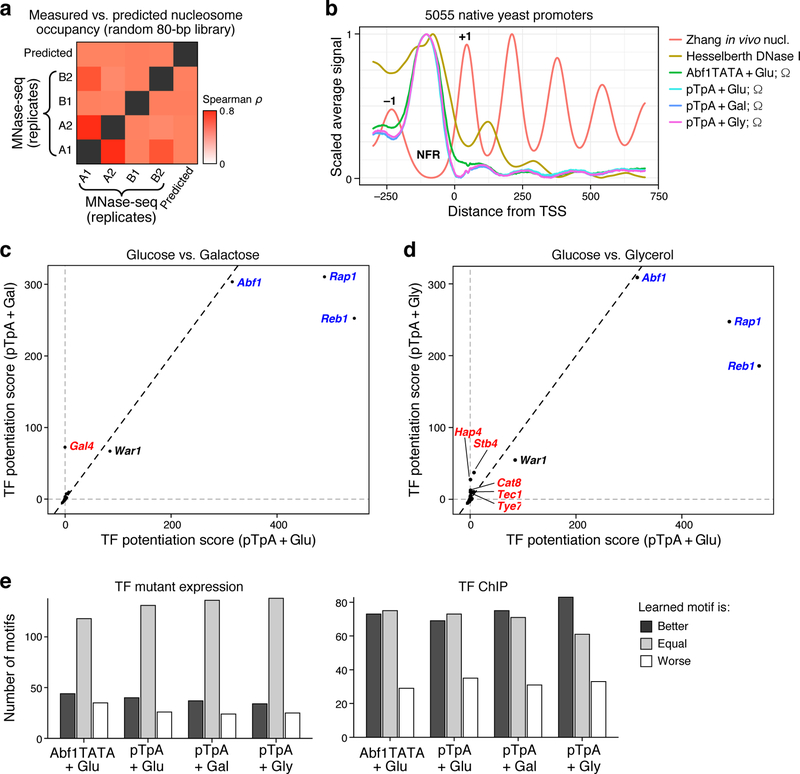
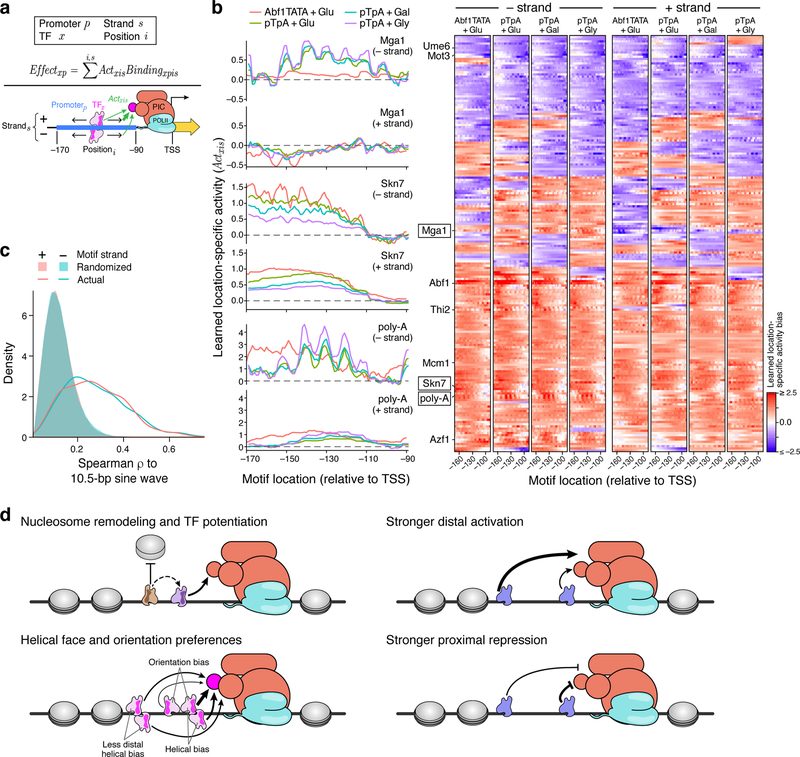
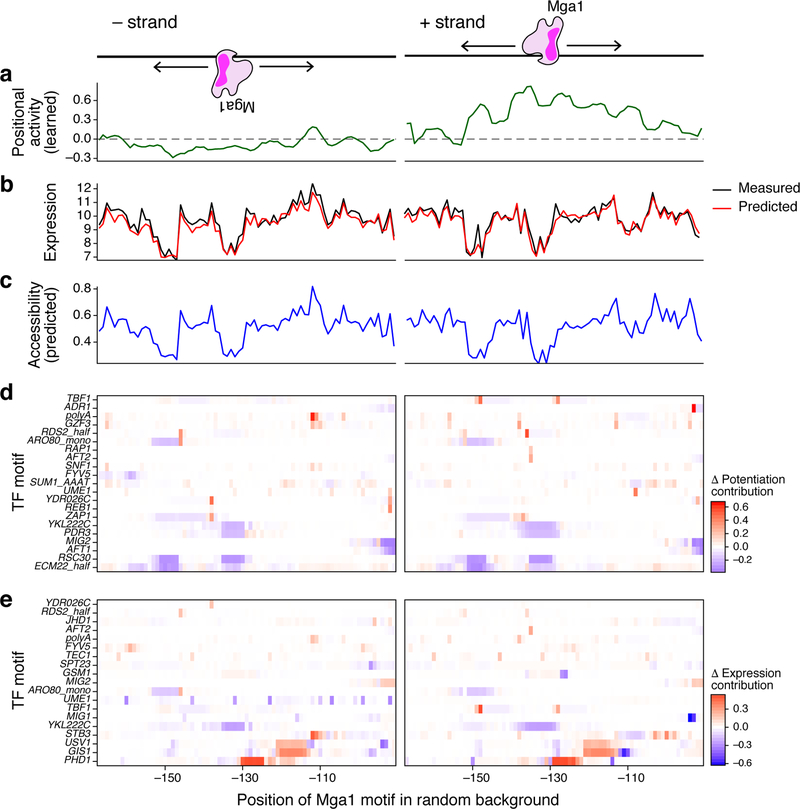
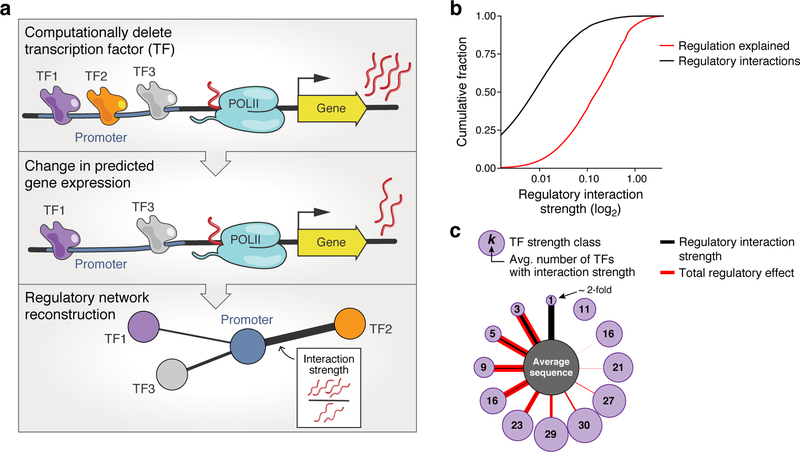
How transcription factors (TFs) interpret cis-regulatory DNA sequence to control gene expression remains unclear, largely because past studies using native and engineered sequences had insufficient scale. Here, we measure the expression output of >100 million synthetic yeast promoter sequences that are fully random. These sequences yield diverse, reproducible expression levels that can be explained by their chance inclusion of functional TF binding sites. We use machine learning to build interpretable models of transcriptional regulation that predict ~94% of the expression driven from independent test promoters and ~89% of the expression driven from native yeast promoter fragments. These models allow us to characterize each TF's specificity, activity and interactions with chromatin. TF activity depends on binding-site strand, position, DNA helical face and chromatin context. Notably, expression level is influenced by weak regulatory interactions, which confound designed-sequence studies. Our analyses show that massive-throughput assays of fully random DNA can provide the big data necessary to develop complex, predictive models of gene regulation.


Conflict of interest statement

Declaration of Interests

AR is an SAB member of ThermoFisher Scientific, Neogene Therapeutics, and Syros Pharmaceuticals and a founder of and equity holder in Celsius Therapeutics. All other authors declare no competing interests.

Figures

Figure 1.
Figure 1.. GPRA.
(a) TFBSs are common in random DNA. Cumulative distribution function (CDF; black) and density (purple) of the expected frequency of yeast TF motifs in random DNA. The expected number of TFBSs in a library of 107 random 80 bp promoters corresponding to each frequency is also indicated on the x axis. For instance, the relatively high information content (IC=14.59) yeast Reb1 motif is expected to occur on average once every ~12,000 bp in random DNA, while Rsc3 (IC=7.78) should occur every ~110 bp. (b) GPRA overview. From top: A library of random DNA sequences (N80 here, blue) is inserted within a promoter scaffold (orange) in front of a reporter (yellow arrow). By chance, the random sequences include many TFBSs (purple). When grown in yeast, the library would yield a broad distribution of expression levels (grey, bottom) as measured by flow cytometry, where each promoter clone would have a distinctive expression distribution (red, orange, yellow). (c) Random DNA yields diverse expression levels. For each promoter scaffold (right) shown are the expression distributions measured by flow cytometry (left) for the entire library (gray filled curves) and for a few selected clones, each from a different single promoter from each library (colored line curves).
Figure 2.
Figure 2.. Expression models learned from a GPRA of 108 random promoters are highly predictive.
(a) Experimental strategy. Yeast GPRA library is sorted into 18 bins by the YFP/RFP ratio of the reporter (top) and the GPRA promoters in each bin are sequenced (bottom). (b) Reproducibility of expression levels. Expression distributions (log2(YFP/RFP)) for cells from each bin (color code, top), after sorting as in (a), which were regrown and re-assayed by flow cytometry. Expression distribution maintains the initial bin ranking. (c) Computational “billboard” model. Shown is a real example of the pTpA+glucose model predicting expression on a real DNA sequence (binding sites are smoothed over 8 bp for visualization purposes). Left: The model first scans each promoter DNA sequence with each PWM motif (1) to estimate a Kd for each TF at each strand and position (Kdxsi) and, through Michaelis-Menten binding using a learned concentration parameter (Cx), it estimates TF occupancy for every position and DNA strand. Next (2), it sums across positions and strands to estimate a single DNA binding amount per TF. Middle: The model learns a potentiation value for each TF (3), which, by pairwise multiplication with the estimated DNA binding and addition of a bias term (cp), is used to infer the accessibility of each DNA sequence (Ω). The DNA binding vector is re-scaled (4) by the accessibility to estimate TF binding in chromatin. Right: Chromatin binding is pairwise multiplied by learned activity parameters (5), capturing how the binding of each TF alters expression, and summed, including a bias term (ce), to yield an estimated expression level for the promoter. (d,e) Accurate prediction of expression from new random DNA and native yeast promoter sequences. Model-predicted expression (EL; pTpA+Glu; x axis) vs. actual expression level (y axis; log(YFP/RFP) sorting bins) for (d) high-quality random 80 bp test data in the pTpA promoter scaffold, grown in glucose, and (e) native yeast promoter sequences, divided into 80 bp fragments and tested in the pTpA promoter scaffold, grown in glucose. (n = 9,982 and 70,924 promoters for (d) and (e), respectively). Pearson’s r2 shown at bottom right. Red lines: Generalized Additive Model lines of best fit.
Figure 3.
Figure 3.. Billboard models learn biochemical activities of TFs.
(a,b) Model correctly predicts chromatin accessibility. (a) Pairwise Spearman correlations (color) between model-predicted nucleosome occupancy (1 - Ω) and in vivo nucleosome occupancy measured by MNase-Seq (n = 4 biological replicates of n = 2 independent library subsets). (b) Average in vivo nucleosome occupancy (Zhang), DNase I hypersensitivity (representing accessibility; Hesselberth), and model-predicted accessibility (1 - Ω) for each of the four billboard models surrounding the TSS. Each dataset is scaled. +1 and −1 nucleosome positions, and promoter Nucleosome Free Region (NFR) are indicated. (c,d) TFs with predicted chromatin-opening ability. Shown is the predicted chromatin opening (potentiation) ability for each TF (dot) for pTpA models trained in glucose (x axes) vs. either (c) galactose or (d) glycerol (y axes). Blue: GRFs with known chromatin opening ability in all conditions; red: known and putative carbon source-specific regulators. (e) Models improve TF motifs. The number of TFBS motifs (y axis) for which the model-refined motif predicted gene expression changes (TF mutant, left) or TF binding (ChIP, right) are better (dark gray), worse (white), or equal (light gray) to the original motifs, for each of the four models (x axis), where “better” and “worse” motifs are reproducibly so in at least 95% of random subsamples of the data (Methods).
Figure 4.
Figure 4.. Position, orientation, and helical face preferences among yeast TFs.
(a) Model with position and orientation-specific activities. For each TF (x), the model learns parameters for how much binding site position (i) and strand (s) within the promoter affect transcriptional activity (Actxis). The total effect of a TF (Effectxp) is thus the sum of products of the position-specific activities (Actxis) and TF occupancies (Bindingxpis) at the promoter (p), across all positions and both strands. For example, this could reflect the TF’s ability to contact the transcriptional pre-initiation complex (PIC). (b) Motif position and orientation effects on expression. Left: Each plot shows the learned activity parameter values (y axis) for motifs in each position (x axis) and strand orientation (upper and lower panels) for each model (colors). Right: Position-specific activity biases (color) for each TF (rows) at each position (columns) for minus (left half) and plus (right half) strand orientations for each of the four models (four subpanels). Only TFs for which all models retained the motif are shown. (c) Helical face preferences. Distribution of Spearman ρ between a 10.5 bp sine wave and the learned position-specific activity weights (as in Supplementary Fig. 13a) for plus strand (pink line) and minus strand (blue line) or with corresponding randomized data (pink and blue shaded areas) for all four models. (d) Model of cis-regulatory logic. TFs display a variety of activity types. Some TFs potentiate the activity of other TFs by modulating nucleosome occupancy (upper left). Activators tend to have a greater effect on transcription when bound distally within the promoter (upper right), while repressors have the greatest effect when bound proximally (lower right). Many TFs show differential activity depending on the helical face or orientation of the TFBS, presumably through interaction with other factors bound nearby (lower left).
Figure 5.
Figure 5.. Inadvertent perturbation of abundant secondary TFBSs confounds TFBS tiling experiments.
(a–e) Mga1 motifs were inserted into a common background sequence at every possible position (common x axis) for both the - strand (left) or + strand (right). (a) Position-specific activity parameters (y axis) learned for the Mga1 motif by the pTpA+glucose model (i.e., how the Mga1 motif alters expression based on the location of its binding site). (b) Model correctly predicts expression despite little correspondence to the position-specific activity of the Mga1 motif. Measured (black) and predicted (red) expression levels for Mga1 motif-tiling sequences. (c) Most expression differences between sequences are attributed to changes in accessibility. Predicted accessibility (Ω; y axis) for Mga1 motif-tiling sequences. (d,e) Expression changes are explained by perturbation of prevalent TFBSs when tiling the motif. Changes in potentiation score (d) and expression (e) attributable to perturbed TF binding for numerous diverse factors (rows) when tiling the Mga1 motif at each position (x axis). The dissimilarity between the rows indicates minimal redundancy between factors.
Figure 6.
Figure 6.. Abundant weak regulatory interactions explain most of expression level.
(a) Analysis overview. A computational “TF knock-out experiment” is performed with the learned cis-regulatory model for each TF: we use the complete model (pTpA+Glu positional; top) and that model with that TF “deleted” (setting its concentration parameter to 0; middle) to predict expression for each 80 bp fragment of native yeast promoter DNA. Bottom: The resulting difference in predicted expression is used to define a regulatory interaction strength (edge) between that TF and DNA sequence; these are used to build regulatory networks for all sequences and TFs. (b,c) Aggregation of weak regulatory effects contributes more to expression than strong interactions. (b) Cumulative distributions (y axis) of the number of regulatory interactions (black) and fraction of regulation explained (i.e. fraction of the cumulative sum of all interaction strengths; red) for each regulatory interaction strength (x axis). The magnitude (and not the sign) of the interaction strength is considered. Because the y axis is scaled to 1, this is equivalent to the average distribution across all native sequence fragments. (c) Regulatory interaction network summary for an “average” sequence. Regulatory interactions were grouped by the strength of the regulatory interaction (thickness of black edges) into different strength classes (purple nodes), with the average number of TFs in that class indicated in the circle. The overall effect on expression, accounting for all TFs in each regulatory interaction strength class, is indicated in red (thickness of red edges). Although there are >2-fold regulatory interactions, these are too rare to be shown here (<1 per sequence).

References

    1. Beer MA & Tavazoie S Predicting gene expression from sequence. Cell 117, 185–198 (2004). - PubMed
    1. Yuan Y, Guo L, Shen L & Liu JS Predicting gene expression from sequence: a reexamination. PLoS computational biology 3, e243 (2007). - PMC - PubMed
    1. Kinney JB, Murugan A, Callan CG Jr. & Cox EC Using deep sequencing to characterize the biophysical mechanism of a transcriptional regulatory sequence. Proceedings of the National Academy of Sciences of the United States of America 107, 9158–9163 (2010). - PMC - PubMed
    1. van Arensbergen J et al. Genome-wide mapping of autonomous promoter activity in human cells. Nature biotechnology 35, 145–153 (2017). - PMC - PubMed
    1. Muerdter F et al. Resolving systematic errors in widely used enhancer activity assays in human cells. Nature methods 15, 141–149 (2018). - PMC - PubMed

Publication types