. 2019 Dec;37(12):1458-1465.
doi: 10.1038/s41587-019-0332-7. Epub 2019 Dec 2.

Single-cell multiomic analysis identifies regulatory programs in mixed-phenotype acute leukemia

Affiliations

Single-cell multiomic analysis identifies regulatory programs in mixed-phenotype acute leukemia

Jeffrey M Granja et al. Nat Biotechnol. 2019 Dec.

Abstract

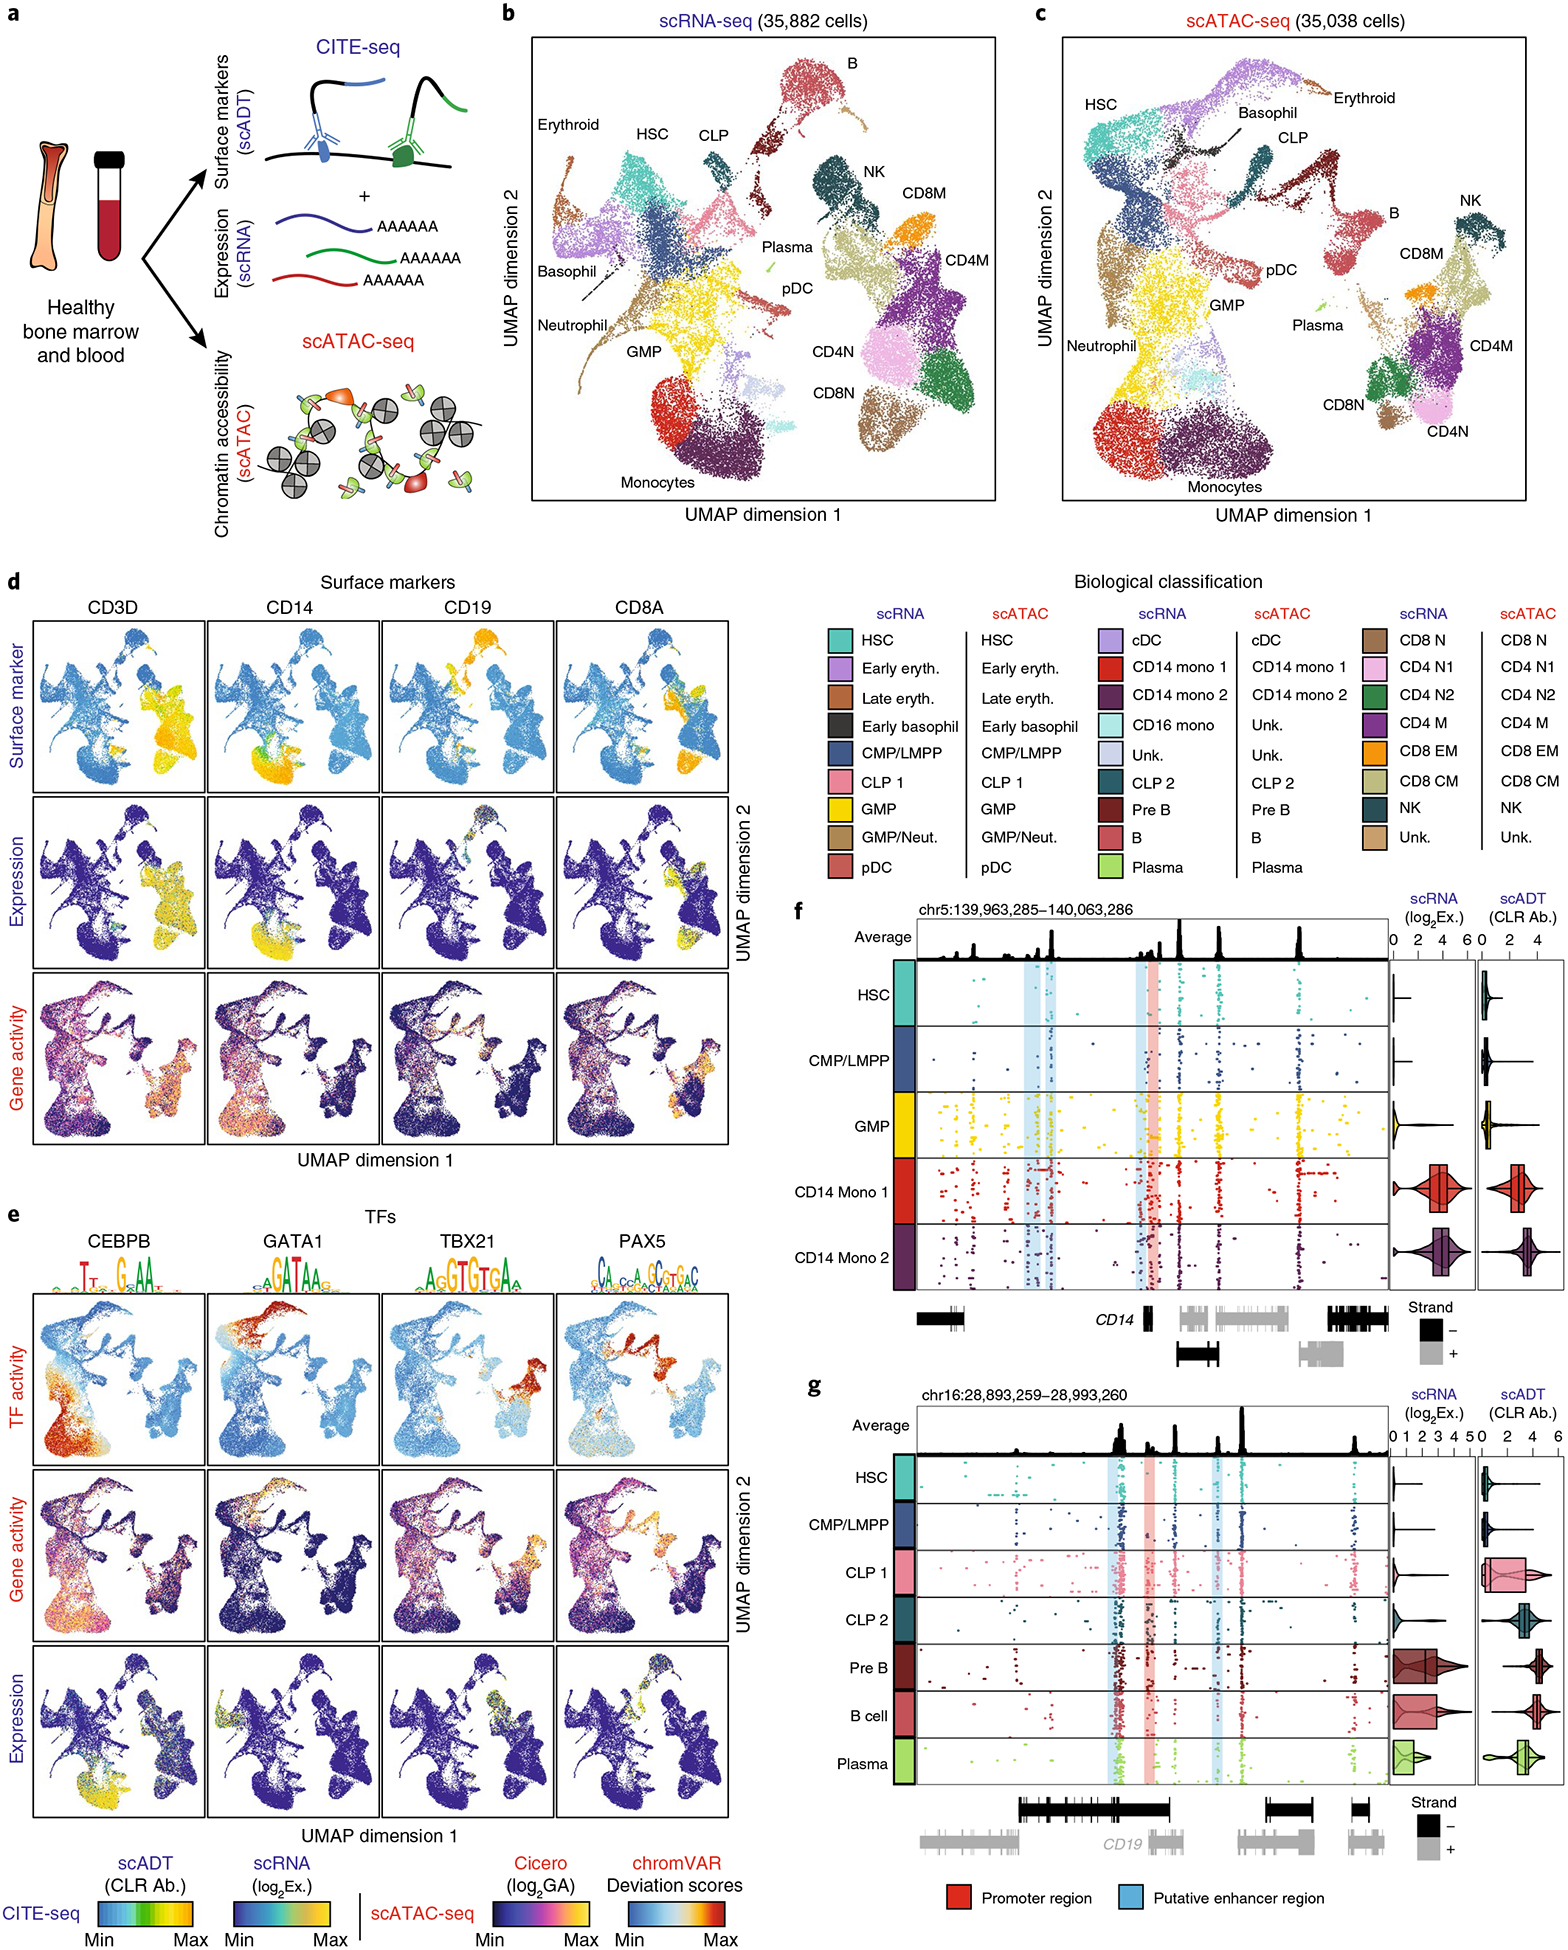
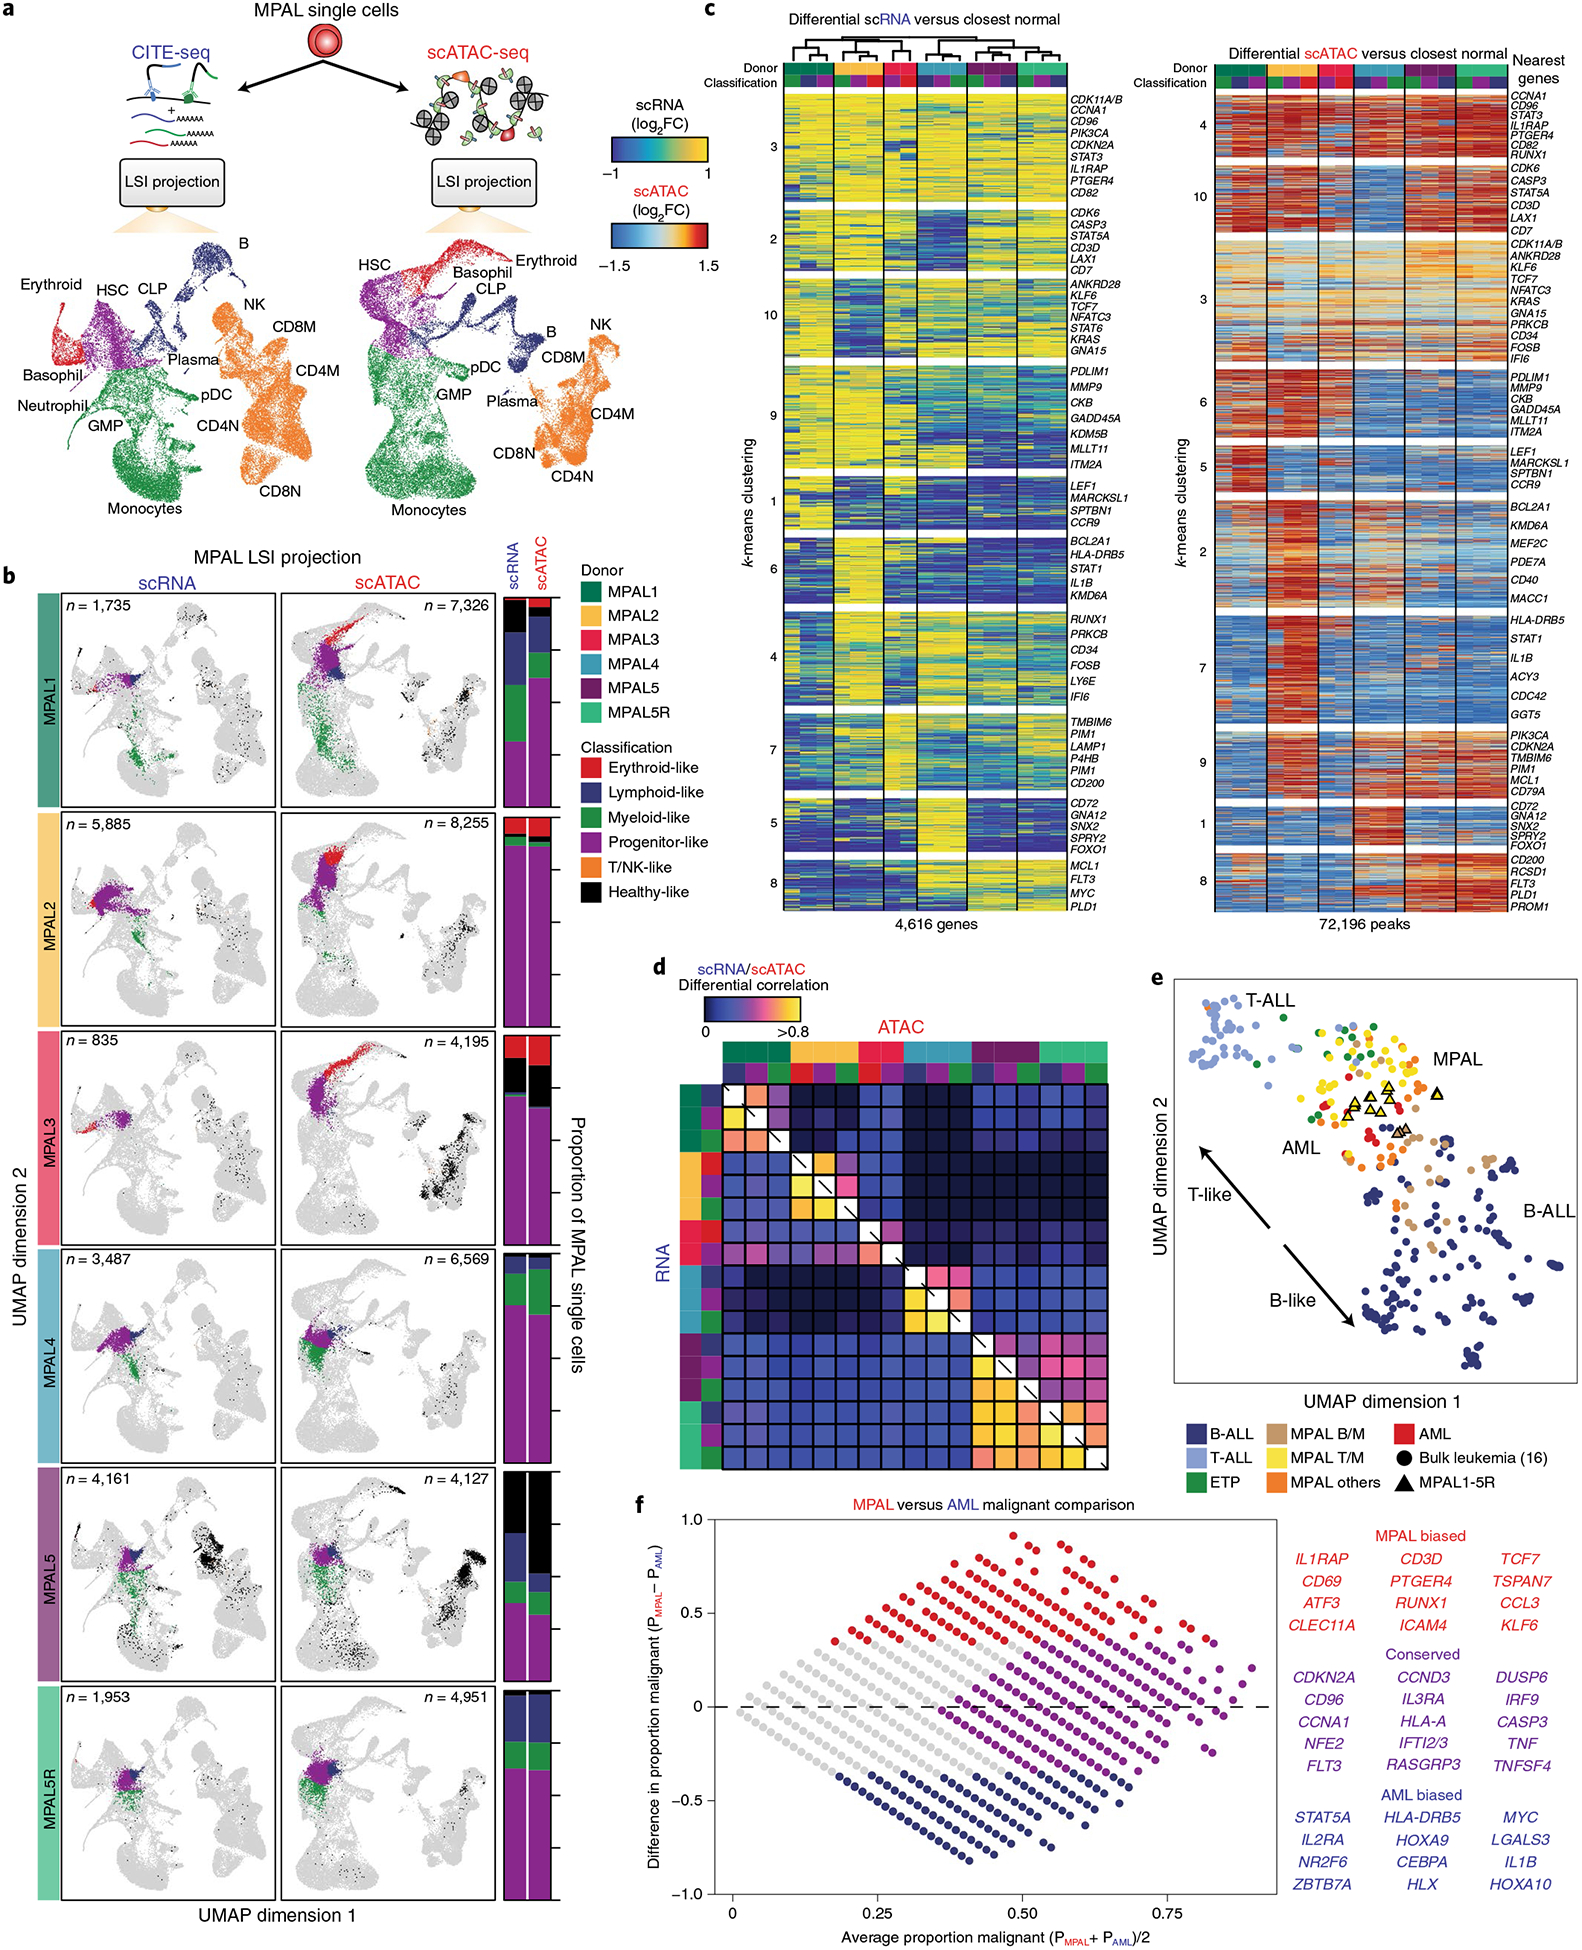
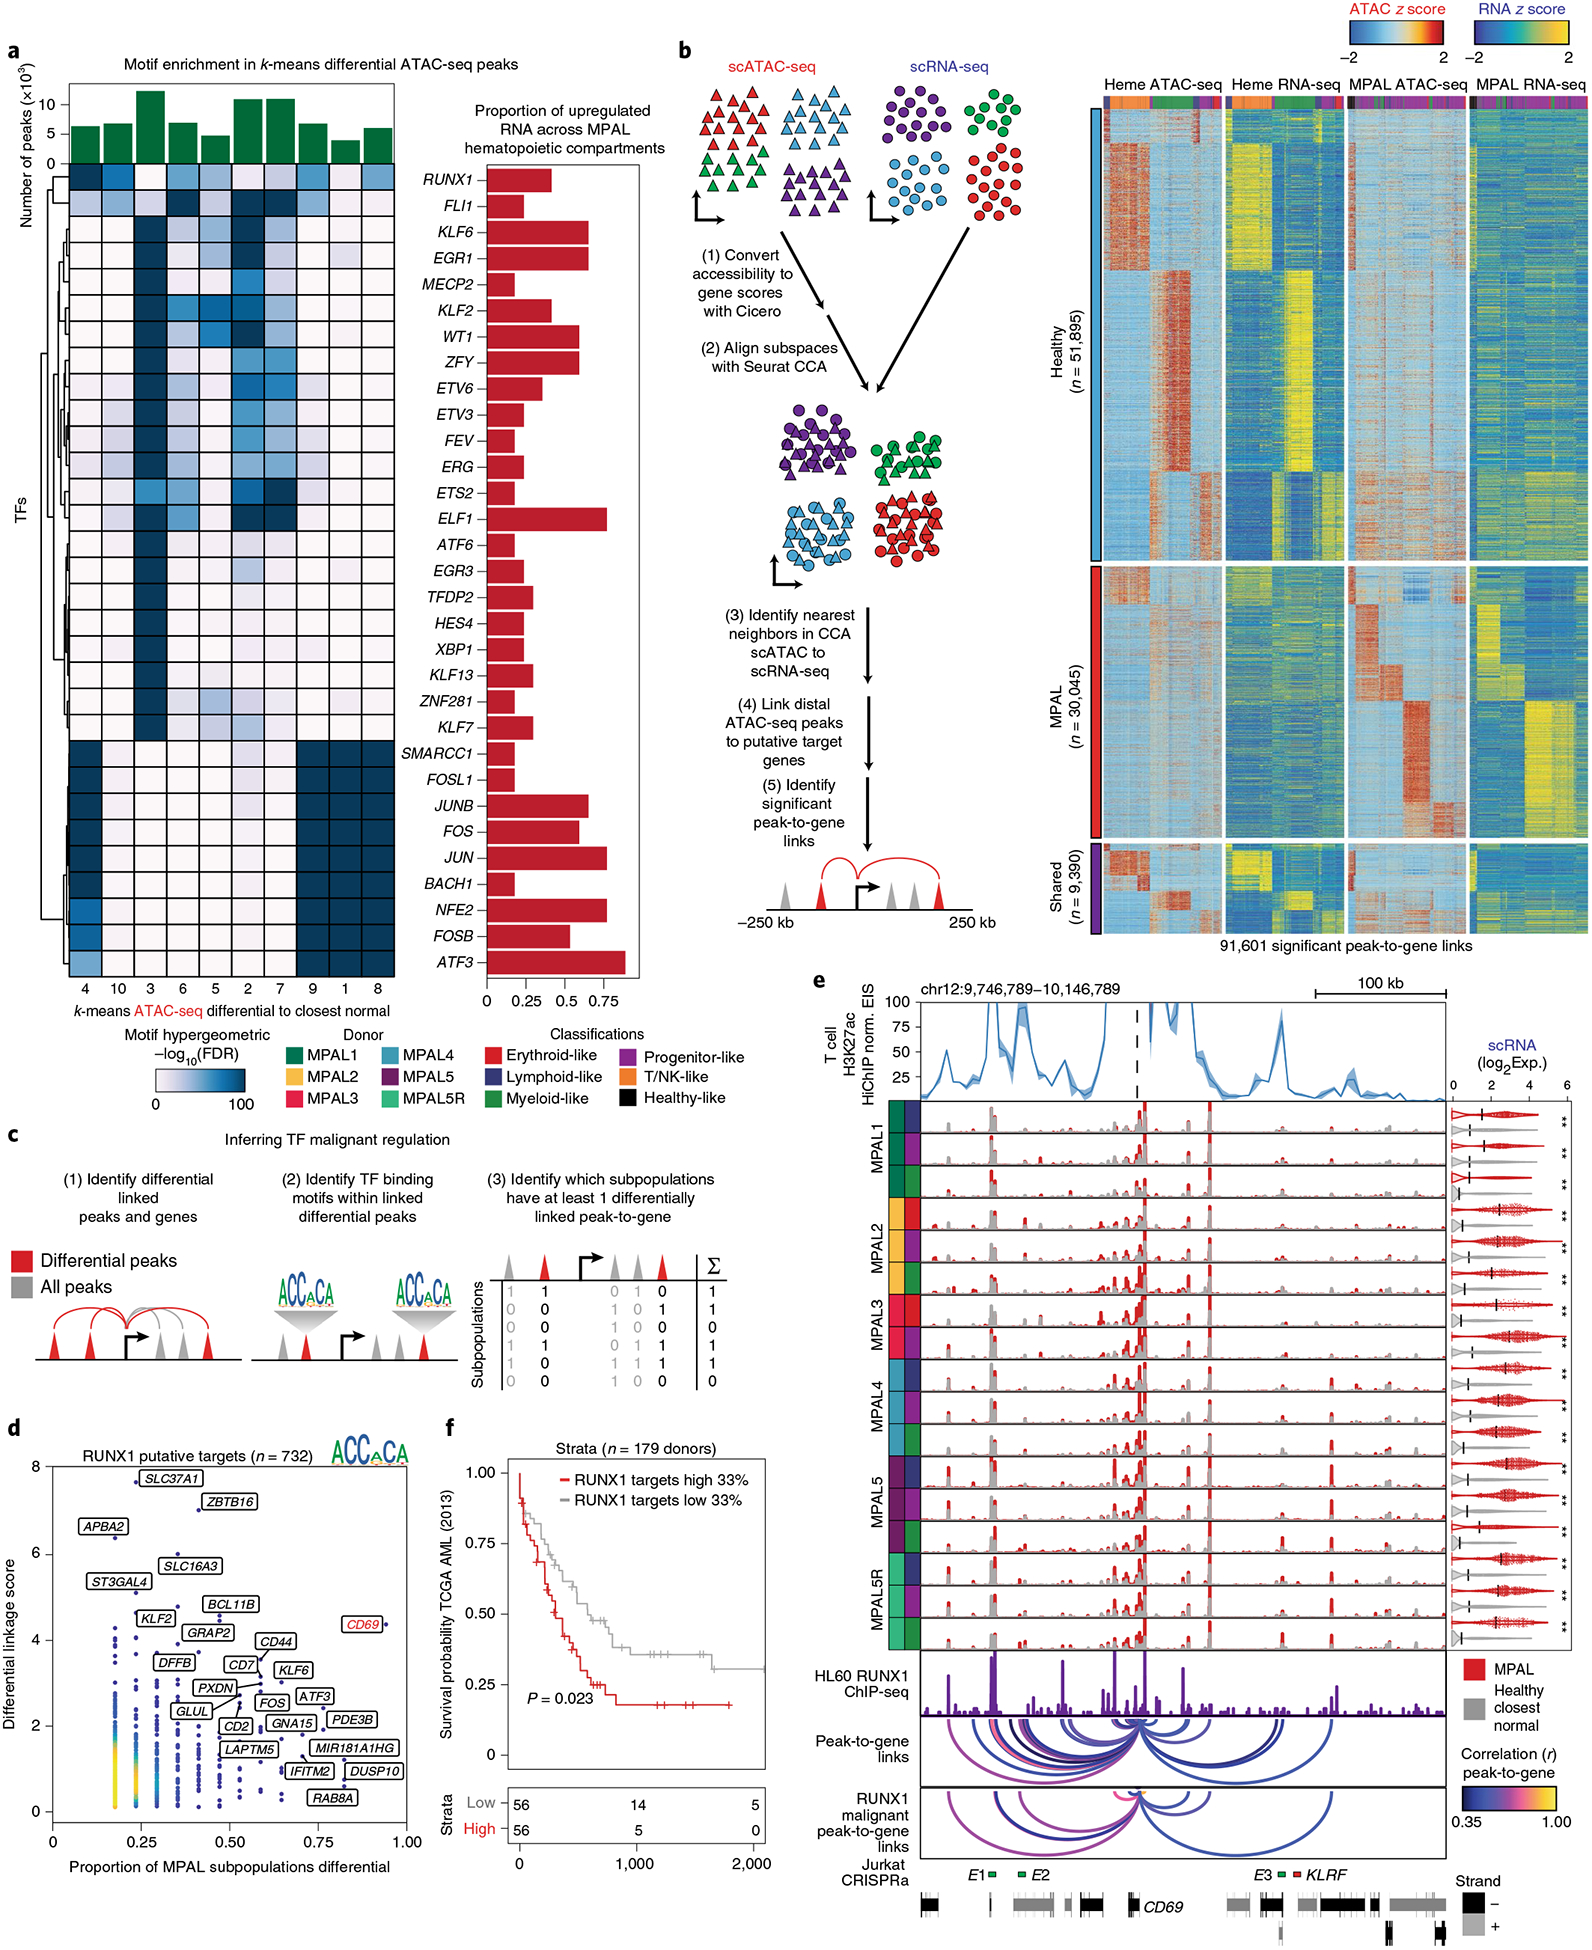
Identifying the causes of human diseases requires deconvolution of abnormal molecular phenotypes spanning DNA accessibility, gene expression and protein abundance1-3. We present a single-cell framework that integrates highly multiplexed protein quantification, transcriptome profiling and analysis of chromatin accessibility. Using this approach, we establish a normal epigenetic baseline for healthy blood development, which we then use to deconvolve aberrant molecular features within blood from patients with mixed-phenotype acute leukemia4,5. Despite widespread epigenetic heterogeneity within the patient cohort, we observe common malignant signatures across patients as well as patient-specific regulatory features that are shared across phenotypic compartments of individual patients. Integrative analysis of transcriptomic and chromatin-accessibility maps identified 91,601 putative peak-to-gene linkages and transcription factors that regulate leukemia-specific genes, such as RUNX1-linked regulatory elements proximal to the marker gene CD69. These results demonstrate how integrative, multiomic analysis of single cells within the framework of normal development can reveal both distinct and shared molecular mechanisms of disease from patient samples.


Conflict of interest statement

Competing interests

R.M. is a founder of, is an equity holder in, and serves on the board of directors of Forty Seven. H.Y.C. has affiliations with Accent Therapeutics (founder and scientific advisory board (SAB) member), 10x Genomics (SAB member), Boundless Bio (cofounder, SAB), Arsenal Biosciences (SAB) and Spring Discovery (SAB member). W.J.G. has affiliations with 10x Genomics (consultant), Guardant Health (consultant) and Protillion Biosciences (co-founder and consultant).

Figures

Fig. 1 |
Fig. 1 |. Multiomic epigenetic and phenotypic analysis of human hematopoiesis.
a, Schematic of multiomic profiling of chromatin accessibility, transcription and cell-surface antibody abundance on healthy bone marrow and PBMCs using CITE-seq (combined single-cell RNA and antibody-derived tag sequencing for each single cell, scRNA-seq and scADT-seq, respectively) and scATAC-seq. b, scRNA-seq LSI UMAP projection of 35,882 single cells across healthy hematopoiesis. Below are the biological classifications for the scRNA-seq clusters (see Supplementary Table 1). c, Top, scATAC-seq LSI UMAP projection of 35,038 single cells across healthy hematopoiesis. Bottom, the biological classifications for the scATAC-seq clusters (see Supplementary Table 1). d, Surface-marker overlay on single-cell RNA UMAP (as in b) of ADT antibody signal (top; center-log ratio (CLR) normalized), single-cell RNA (middle; log2(gene expression) (Exp)) and single-cell ATAC log2(gene-activity scores (GA)) for CD3D, CD14, CD19 and CD8A (bottom). e, TF overlay on single-cell ATAC UMAP (as in c) of TF chromVAR deviations (top), gene-activity scores (middle) and single-cell RNA for CEBPB, GATA1, TBX21 and PAX5 (bottom). f,g, Multiomic track of CD14 (specific in these clusters for monocytes) across monocyte development from HSC progenitor cells (f; n = 1,425–4,222) and multiomic track of CD19 (specific in these clusters for pre-B cells) across B cell development (g; n = 62–2,260). Multiomic tracks; average track of all clusters displayed (left top), binarized 100 random scATAC-seq tracks for each locus at a resolution of 100 bp (left bottom), scRNA-seq log2 violin and box plots of normalized expression for each cluster and scADT-seq CLR violin and box plots of protein abundance for each cluster (right). Violin plots represent the smoothed density of the distribution of the data. In box plots, the lower whisker is the lowest value greater than the 25% quantile minus 1.5 times the interquartile range (IQR), the lower hinge is the 25% quantile, the middle is the median, the upper hinge is the 75% quantile and the upper whisker is the largest value less than the 75% quantile plus 1.5 times the IQR.
Fig. 2 |
Fig. 2 |. Multiomic projection of MPALs into hematopoiesis identifies normal and leukemic programs.
a, Schematic for projection of MPAL single cells onto hematopoiesis for both scRNA-seq and scATAC-seq classified into broad hematopoietic compartments. b, Left, MPAL single-cell projections into hematopoiesis for both scRNA-seq and scATAC-seq. Right, the proportion of MPAL cells that were broadly classified as healthy or disease and their respective hematopoietic compartment (range is from 0 to 1). c, Left, scRNA-seq heat map of upregulated genes (LFC >0.5 and two-sided t test FDR < 0.01) log2(fold changes) comparing MPAL disease subpopulations to closest non-redundant normal cells. Differential genes were clustered using k-means clustering (k = 10) on the basis of their log2(fold changes). Right, scATAC-seq heat map (ordered by scRNA-seq hierarchal clustering on the left) of differentially upregulated accessible peaks (LFC > 0.5 and two-sided t test FDR < 0.01) log2(fold changes) comparing MPAL disease subpopulations to the closest non-redundant normal cells. Differential peaks were clustered using k-means clustering (k = 10) on the basis of their log2(fold changes). d, Pearson correlation of the log2(fold changes) (from c) for differentially upregulated genes and peaks across all MPAL subpopulations. e, LSI UMAP of differentially upregulated gene-expression profiles across bulk leukemias (circle, n = 321) and MPAL samples assayed in this study (outlined triangle, n = 17), colored by WHO 2016 classifications. f, Left, MA plot (log-ratio (M) by mean average (A)) comparing the proportion of malignant (upregulated) gene-expression profiles in AML and MPALs. The x axis represents, for each upregulated gene, the average proportion of subpopulations from patients with AML and MPAL that are broadly upregulated (LFC > 0.5). The y axis represents, for each upregulated gene, the difference in the proportion of upregulated subpopulations from patients with MPAL and AML (LFC > 0.5). Right, genes that are more malignantly biased to either AMLs or MPALs and genes that are conserved across both AMLs and MPALs.
Fig. 3 |
Fig. 3 |. Integrative scATAC-seq and scRNA-seq analyses nominate putative TFs that regulate leukemic programs.
a, Top, number of accessible peaks in each k-means cluster. Bottom left, hypergeometric TF motif enrichment FDR in differentially accessible peaks across each k-means cluster identified in Fig. 2c. TFs are also identified as being differentially expressed and enriched in at least three MPAL hematopoietic compartments. Bottom right, proportion of differentially upregulated TF gene-expression profiles across MPAL hematopoietic compartments. b, Left, schematic for alignment of scATAC-seq and scRNA-seq data to link putative regulatory regions to target genes. First, scATAC-seq data are converted from accessible peaks to inferred gene-activity scores using Cicero. Second, these gene activity scores and scRNA-seq expression are aligned into a common subspace using Seurat’s CCA. Third, each scATAC-seq cell is assigned its nearest scRNA-seq neighbor. Fourth, ATAC-seq peaks within 2.5–250 kb of a gene promoter are correlated within the healthy hematopoietic and MPAL k-neaest-neighbor groupings. Lastly, significant peak-to-gene links are identified by correlating peaks to genes on different chromosomes. Right, heat maps of 91,601 peak-to-gene links across hematopoiesis and MPALs. Top, peak-to-gene links that are identified only within hematopoiesis. Middle, peak-to-gene links that are unique to MPALs. Bottom, peak-to-gene links identified in both hematopoiesis and MPALs. c, Schematic for identifying genes that are putatively regulated by the TF of interest. d, Putative RUNX1-target genes (n = 732) differentially upregulated in at least one MPAL subpopulation. The x axis represents the proportion of MPAL subpopulations that are differential in both scRNA-seq and a linked accessible peak. The y axis represents the cumulative linkage score between differentially upregulated peaks linked to differentially upregulated genes. e, CD69 multiomic differential track. Top, T cell T helper 17 H3K27ac HiChIP virtual 4C of enhancer interaction signal (EIS) of the CD69 locus, the line represents the average signal and shading represents the range of the signal times 2 between biological replicates (n = 2). Middle, aggregated scATAC-seq tracks showing MPAL disease subpopulations (red) and aggregated nearest-neighbor healthy (gray). Right, violin plots of the distribution log2 normalized expression of CD69 for MPAL disease subpopulations (red) and closest normal cells (gray); the black line represents the mean and asterisks denote significance (LFC > 0.5 and FDR < 0.01 from Fig. 2c). Violin plot of the log2-normalized expression and the black line represents the mean log2-normalized expression. Bottom, HL60 AML line ChIP-seq data across the CD69 locus, CD69 peak-to-gene links, RUNX1-identified malignant peak-to-gene links for CD69 and jurkat CRISPR activation of three CD69 enhancers (E1-E3 are shown in green and the KLRF locus negative control is shown in red). Peak-to-gene links are colored by Pearson correlation of the peak accessibility and gene expression (Methods). f, Kaplan-Meier curve for patients with AML from TCGA (n = 179) stratified by putative RUNX1-target genes (n = 732); top 33% versus bottom 33%, average z score log2(expression) (log-rank test P = 0.023).

References

    1. Hoadley KA et al. Cell-of-origin patterns dominate the molecular classification of 10,000 tumors from 33 types of cancer. Cell 173, 291–304 (2018). - PMC - PubMed
    1. Corces MR et al. The chromatin accessibility landscape of primary human cancers. Science 362, eaav1898 (2018). - PMC - PubMed
    1. Polak P et al. Cell-of-origin chromatin organization shapes the mutational landscape of cancer. Nature 518, 360–364 (2015). - PMC - PubMed
    1. Weinberg OK & Arber DA Mixed-phenotype acute leukemia: historical overview and a new definition. Leukemia 24, 1844–1851 (2010). - PubMed
    1. Arber DA et al. The 2016 revision to the World Health Organization classification of myeloid neoplasms and acute leukemia. Blood 127, 2391–2405 (2016). - PubMed

Publication types

MeSH terms