Orchestrating single-cell analysis with Bioconductor
- PMID: 31792435
- PMCID: PMC7358058
- DOI: 10.1038/s41592-019-0654-x
Orchestrating single-cell analysis with Bioconductor
Erratum in
-
Publisher Correction: Orchestrating single-cell analysis with Bioconductor.Nat Methods. 2020 Feb;17(2):242. doi: 10.1038/s41592-019-0700-8. Nat Methods. 2020. PMID: 31827272
Abstract
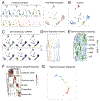
Recent technological advancements have enabled the profiling of a large number of genome-wide features in individual cells. However, single-cell data present unique challenges that require the development of specialized methods and software infrastructure to successfully derive biological insights. The Bioconductor project has rapidly grown to meet these demands, hosting community-developed open-source software distributed as R packages. Featuring state-of-the-art computational methods, standardized data infrastructure and interactive data visualization tools, we present an overview and online book (https://osca.bioconductor.org) of single-cell methods for prospective users.
Conflict of interest statement
Competing Financial Interests
RG declares ownership in CellSpace Biosciences.
Figures


References
-
- Huber Wolfgang, Vincent J Carey Robert Gentleman, Anders Simon, Carlson Marc, Benilton S Carvalho Hector Corrada Bravo, Davis Sean, Gatto Laurent, Girke Thomas, Gottardo Raphael, Hahne Florian, Hansen Kasper D, Irizarry Rafael A, Lawrence Michael, Michael I Love, MacDonald James, Obenchain Valerie, Oleś Andrzej K, Pagès Hervé, Reyes Alejandro, Shannon Paul, Smyth Gordon K, Tenenbaum Dan, Waldron Levi, and Morgan Martin. Orchestrating high-throughput genomic analysis with Bioconductor. Nat Methods, 12(2):115–21, 02 2015. doi:10.1038/nmeth.3252. - DOI - PMC - PubMed
-
- Robinson Mark D, McCarthy Davis J, and Smyth Gordon K. edgeR: A Bioconductor package for differential expression analysis of digital gene expression data. Bioinformatics, 26(1):139–40, 2010. doi:10.1093/bioinformatics/btp616. URL https://bioconductor.org/packages/edgeR. - DOI - PMC - PubMed
-
- Lawrence Michael, Huber Wolfgang, Hervé Pagès Patrick Aboyoun, Carlson Marc, Gentleman Robert, Morgan Martin T, and Carey Vincent J. Software for computing and annotating genomic ranges. PLoS Comput Biol, 9(8):e1003118, 2013. doi:10.1371/journal.pcbi.1003118. URL https://bioconductor.org/packages/IRanges. - DOI - PMC - PubMed
-
- Aryee Martin J, Jaffe Andrew E, Corrada-Bravo Hector, Ladd-Acosta Christine, Feinberg Andrew P, Hansen Kasper D, and Irizarry Rafael A. Minfi: a flexible and comprehensive Bioconductor package for the analysis of Infinium DNA methylation microarrays. Bioinformatics, 30(10):1363–9, 2014. doi:10.1093/bioinformatics/btu049. URL https://bioconductor.org/packages/minfi. - DOI - PMC - PubMed
-
- Love Michael I, Huber Wolfgang, and Anders Simon. Moderated estimation of fold change and dispersion for RNA-seq data with DESeq2. Genome Biol, 15(12):550, 2014. doi:10.1186/s13059-014-0550-8. URL https://bioconductor.org/packages/DESeq2. - DOI - PMC - PubMed
Publication types
MeSH terms
Grants and funding
- WT/108437/Z/15/Wellcome Trust (Wellcome)/International
- U24 CA180996/CA/NCI NIH HHS/United States
- R00 HG009007/HG/NHGRI NIH HHS/United States
- U24CA232979/U.S. Department of Health & Human Services ǀ NIH ǀ National Cancer Institute (NCI)/International
- U41 HG004059/HG/NHGRI NIH HHS/United States
- WT_/Wellcome Trust/United Kingdom
- U01 CA214846/CA/NCI NIH HHS/United States
- U01CA214846/U.S. Department of Health & Human Services ǀ NIH ǀ National Cancer Institute (NCI)/International
- U24 CA232979/CA/NCI NIH HHS/United States
- U24CA180996/U.S. Department of Health & Human Services ǀ NIH ǀ National Cancer Institute (NCI)/International
- U24CA18099/U.S. Department of Health & Human Services ǀ NIH ǀ National Cancer Institute (NCI)/International
- A17179/Cancer Research UK (CRUK)/International
- U41HG004059/U.S. Department of Health & Human Services ǀ NIH ǀ National Human Genome Research Institute (NHGRI)/International
LinkOut - more resources
Full Text Sources
Other Literature Sources

