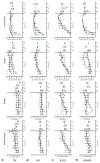
. 2019 Dec;25(12):1885-1893.
doi: 10.1038/s41591-019-0660-7. Epub 2019 Dec 2.

Three-dimensional spatially resolved geometrical and functional models of human liver tissue reveal new aspects of NAFLD progression

Affiliations

Three-dimensional spatially resolved geometrical and functional models of human liver tissue reveal new aspects of NAFLD progression

Fabián Segovia-Miranda et al. Nat Med. 2019 Dec.

Abstract

Early disease diagnosis is key to the effective treatment of diseases. Histopathological analysis of human biopsies is the gold standard to diagnose tissue alterations. However, this approach has low resolution and overlooks 3D (three-dimensional) structural changes resulting from functional alterations. Here, we applied multiphoton imaging, 3D digital reconstructions and computational simulations to generate spatially resolved geometrical and functional models of human liver tissue at different stages of non-alcoholic fatty liver disease (NAFLD). We identified a set of morphometric cellular and tissue parameters correlated with disease progression, and discover profound topological defects in the 3D bile canalicular (BC) network. Personalized biliary fluid dynamic simulations predicted an increased pericentral biliary pressure and micro-cholestasis, consistent with elevated cholestatic biomarkers in patients' sera. Our spatially resolved models of human liver tissue can contribute to high-definition medicine by identifying quantitative multiparametric cellular and tissue signatures to define disease progression and provide new insights into NAFLD pathophysiology.


Conflict of interest statement

Competing interests

Authors declare no competing interests

Figures
Extended Data Fig. 1
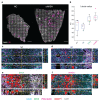
Extended Data Fig. 1. Immunofluorescence of human liver tissue.
a, Human liver sections were stained for glutathione synthetase (GS) to visualize CV and DAPI. Scale bar, 1000 μm. Representative images from NC = 4 samples and eNASH = 5 samples. b, 2D analysis of liver lobule radius represented by box-plots (median values as red lines, 25th and 75th percentiles as blue bottom and top edges of the boxes, extreme data points by whiskers). NC = 4 samples, HO = 4 samples, STEA = 7 samples, eNASH = 5 samples. One-sided hypothesis test. *p-values < 0.05, **p-values < 0.01, ***p-values < 0.001. c-f, Liver sections (~100 um thick) were stained for bile canaliculi (CD13), sinusoids (fibronectin), nucleus (DAPI), lipid droplets (BODIPY) and cell border (LDLR), optically cleared with SeeDB and imaged at high resolution using multiphoton microscopy (0.3 μm x 0.3 μm x 0.3 μm per voxel). Orthogonal view of NC (c), HO (d), STEA (e) and eNASH (f). Scale bar, 50 μm. Representative images from NC = 5 samples, HO = 3 samples, STEA = 4 samples, eNASH = 4 samples.
Extended Data Fig. 2
Extended Data Fig. 2. Morphometric features of the nuclei.
a, Representative IF images of fixed human liver tissue sections stained with DAPI. Shown is a single-plane covering an entire CV-PV axis. Arrowhead indicates some examples of vacuolated nuclei. Representative images from NC = 5 samples, HO = 3 samples, STEA = 4 samples, eNASH = 4 samples. Quantitative characterization of hepatocytes nuclei with respect to the proportion of mono/binuclear cells (b) and ploidy (c). Only the four major populations (i.e. 1x2n, 1x4n, 2x2n and 2x4n), which account for >90% of the hepatocytes, are shown. d, Definition of the regions within the liver lobule. The CV-PV axis was divided in 10 equidistant regions. Regions 1 and 10 are adjacent to the CV and PV, respectively. Quantitative characterization of hepatocytes nuclear elongation (e) and texture based on their DAPI intensity (see Methods for details): nuclear vacuolation (f), homogeneity (Angular Second Moment) (g), local homogeneity (Inverse Difference Moment) (h), Contrast (i) and Entropy (j). NC = 5 samples, HO = 3 samples, STEA = 4 samples, eNASH = 4 samples. Spatially-resolved quantification represented by median ± MAD per region and overall quantifications by box-plots (median values as red lines, 25th and 75th percentiles as blue bottom and top edges of the boxes, extreme data points by whiskers). One-tailed hypothesis test. *p-values < 0.05, **p-values < 0.01, ***p-values < 0.001.
Extended Data Fig. 3
Extended Data Fig. 3. Mislocalization of DPPIV in pericentral hepatocytes in STEA and eNASH.
Representative confocal microscopy images of human liver sections stained for the apical markers BSEP (a), MRP2 (b) and DPPIV (c). Merged images of the apical markers, phalloidin and DAPI are shown in the right panels. Arrowhead indicates the lateral membrane. Scale bar, 10μm. NC = 3 samples, STEA = 4 samples, eNASH = 4 samples were repeated independently with similar results. d-e, Large field images of a single-plane of liver tissue stained with DPPIV (d). Scale bar, 50μm. Apical, basal and lateral membrane of the hepatocytes were segmented based on BSEP (not shown), DPPIV and phalloidin (not shown) in an area covering a radius of 125 μm around the CV and PV. DPPIV intensity was quantified and normalised to the area covered by the different sub-domains (e). NC = 3 samples, STEA = 4 samples, eNASH = 4 samples. Quantifications by box-plots (median values as red lines, 25th and 75th percentiles as blue bottom and top edges of the boxes, extreme data points by whiskers). One-tailed hypothesis test. *p-values < 0.05, **p-values < 0.01, ***p-values < 0.001.
Extended Data Fig. 4
Extended Data Fig. 4. Structural and topological characterization of the sinusoidal network.
a, Representative IF images of fixed human liver tissue sections stained with fibronectin after CAAR. Shown is a maximum projection of a 30 μm z-stack covering an entire CV-PV axis. Representative images from NC = 5 samples, HO = 3 samples, STEA = 5 samples, eNASH = 3 samples Quantification of the tissue volume fraction occupied by the sinusoids (b), radius (c), number of junctions (d), total length per unit tissue volume (e), fraction of connected network (f) connectivity density (g) and branches crossing regions (h) for the sinusoidal network along the CV-PV axis and overall. NC = 5 samples, HO = 3 samples, STEA = 5 samples, eNASH = 3 samples. Spatially-resolved quantification represented by median ± MAD per region and overall quantifications by box-plots (median values as red lines, 25th and 75th percentiles as blue bottom and top edges of the boxes, extreme data points by whiskers). Two-tailed hypothesis test. *p-values < 0.05, **p-values < 0.01, ***p-values < 0.001.
Extended Data Fig. 5
Extended Data Fig. 5. Geometric and topological variability of the BC network among liver lobules.
BC network was reconstructed from three CV-PV axes from different lobules for each patient. NC = 4 patients, HO = 3 patients STEA = 3 patients, eNASH = 3 patients. Quantification of the tissue volume fraction occupied by the BC, radius, total length per unit tissue volume and fraction of connected network (a-d) along the CV-PV axis and overall. Spatially-resolved quantification represented by median ± MAD per region and overall quantifications by box-plots (median values as red lines, 25th and 75th percentiles as blue bottom and top edges of the boxes, extreme data points by whiskers). Two-tailed hypothesis test. *p-values < 0.05, **p-values < 0.01, ***p-values < 0.001.
Extended Data Fig. 6
Extended Data Fig. 6. Estimates for a fraction of free lumen in total volume of a bile canaliculus.
a, Representative images of bile canaliculi for NC and eNASH liver tissue samples, used for making the estimates. Microvilli are well preserved. A red dashed line indicates lumen of a bile canaliculus. TJ, tight junction. NC = 3 samples, HO = 3 samples, STEA = 3 samples, eNASH = 3 samples. Scalebar, 500 nm. b, Estimation of fraction of free lumen by stereological point counting (the Cavalieri estimator). For each set of samples and each region (central / portal vein) a minimum of five EM images was used. NC = 3 samples, HO = 3 samples, STEA = 3 samples, eNASH = 3 samples, median ± MAD.
Extended Data Fig. 7
Extended Data Fig. 7. Profile of serum cholestatic and liver injury biomarkers as well as bile acids during disease progression.
The levels of bilirubin (a), GGT (b), AP (c), AST (d), ALT (e), BA precursors (cholesterol, 7α-hydroxycholesterol and 27-hydroxycholesterol) (f), individual (CA, CDCA) and total primary BAs (g), individual (DCA, LCA, UDCA) and total secondary BAs (h), total BAs (i) and ratio secondary to primary BAs (j) were measured in the serum of the patients and represented in box-plots (median values as red lines, 25th and 75th percentiles as blue bottom and top edges of the boxes, extreme data points by whiskers). NC = 22 samples, HO = 27 samples, STEA = 31 samples, eNASH = 24 samples. One-tailed hypothesis test. *p-values < 0.05, **p-values < 0.01, ***p-values < 0.001.
Extended Data Fig. 8
Extended Data Fig. 8. Scatter plots and regression analysis of measured liver biomarkers and bile acids.
bilirubin (a), AP (b), total BAs (c), primary BAs (d), AST (e), ALT (f) and ratio secondary to primary BAs (g) measured in the serum versus the model-derived pericentral pressure in individual patients from all groups. Arrow indicates an outlier for primary BAs (h7252). NC = 6 samples, HO = 4 samples, STEA = 8 samples, eNASH = 7 samples. P-values and Spearman correlation coefficient are indicated in the plot.
Fig. 1
Fig. 1. 3D reconstruction and quantitative analysis of human liver morphology.
Human liver sections obtained by biopsy (~100 um thick) were stained for bile canaliculi (CD13), sinusoids (fibronectin), nucleus (DAPI), lipid droplets (BODIPY) and cell border (LDLR), optically cleared with SeeDB and imaged at high resolution using multiphoton microscopy (0.3 μm x 0.3 μm x 0.3 μm per voxel). For each sample, the central vein (light blue), portal vein (orange), bile canaliculus (green), sinusoids (magenta), lipid droplets (red), nuclei (random colours) and hepatocytes (random colours) were reconstructed. a, Normal control (NC). b, Healthy obese (HO). c, Steatosis (STEA). d, Early NASH (eNASH). Scale bar 30μm. Representative reconstructions from NC = 5 samples, HO = 3 samples, STEA = 4 samples, eNASH = 4 samples.
Fig. 2
Fig. 2. Quantitative characterization of LD along the CV-PV axis.
a, Representative IF images of fixed human liver tissue sections stained with BODIPY. Shown is a maximum projection of a 60 μm z-stack covering an entire CV-PV axis. NC = 5 samples, HO = 3 samples, STEA = 4 samples, eNASH = 4 samples were repeated independently with similar results. b, Quantification of the percentage of tissue volume occupied by LD along the CV-PV axis and overall values (i.e. over the whole CV-PV axis). c, LD volume distribution for each disease condition. The inset shows the difference of the normalized LD volume distribution for all conditions (HO+STEA+eNASH) and the one from the NC (red curve). By fitting this distribution with two log-normal distributions, we defined three LD populations: small (< 8 μm3), medium (8 – 1000 μm3) and large (> 1000 μm3). 122538 LD from 16 reconstructions (NC = 5 samples, HO = 3 samples, STEA = 4 samples, eNASH = 4 samples) were analysed. Each volume distribution was normalized such that their integrals are equal to 10000. Quantification of the percentage of tissue volume occupied by the LD along the CV-PV for (d) small, (e) medium and (f) large LD. NC = 5 samples, HO = 3 samples, STEA = 4 samples, eNASH = 4 samples. Spatially-resolved quantification represented by median ± MAD per region and overall quantifications by box-plots (median values as red lines, 25th and 75th percentiles as blue bottom and top edges of the boxes, extreme data points by whiskers). One-tailed hypothesis test. *p-values < 0.05, **p-values < 0.01, ***p-values < 0.001.
Figure 3
Figure 3. Cell based analysis of NAFLD.
Quantification of the number of hepatocytes per tissue volume unit (a), number of hepatocytes per 100 μm lobule section (b) and cell volume (c) along the liver lobule and the overall average. d, Cell volume distribution. For the population analysis, the hepatocytes from all the groups were pulled together and the populations were defined based on their volume distribution. By fitting the volume distribution with two log-normal distributions, the volume values defining three populations’ boundaries were identified: small (< 5800 μm3), medium (5800 – 11000 μm3) and large (> 11000 μm3) (d). The percentage of cellular volume occupied by the different populations is shown in (e, f, and g). Percentage of the cell volume occupied by LD: distribution (h) and statistics along the CV-PV axis and overall (i). Hepatocytes with percentage of LD volume lower than 0.001% are not presented in the distributions, which were normalized such that their integrals are equal to 1000 (h). 11278 cells from 16 reconstructions (NC = 5 samples, HO = 3 samples, STEA = 4 samples, eNASH = 4 samples) were analysed. Spatially-resolved quantification represented by median ± MAD per region and overall quantifications by box-plots (median values as red lines, 25th and 75th percentiles as blue bottom and top edges of the boxes, extreme data points by whiskers). One-tailed hypothesis test. *p-values < 0.05, **p-values < 0.01, ***p-values < 0.001. j, Representative cells reconstructed in 3D and selected from region 3 and 8. Apical, basal and lateral surface are shown in green, magenta and grey, respectively. LD are shown in red. Scale bar, 10 μm. 16 reconstructions (NC = 5 samples, HO = 3 samples, STEA = 4 samples, eNASH = 4 samples) were repeated independently with similar results.
Figure 4
Figure 4. Structural and topological defects of bile canaliculi revealed by spatial 3D analysis.
a, Representative IF images of fixed human liver tissue sections stained with CD13 after citric acid antigen retrieval. Shown is a maximum projection of a 60 μm z-stack covering an entire CV-PV axis. b, Inset showing 3D representation of the BC highlighted in a. NC = 6 samples, HO = 4 samples, STEA = 8 samples, eNASH = 7 samples were repeated independently with similar results. Quantification of the volume fraction of tissue occupied by BC (c), radius (d), number of junctions (e), total length per volume (f), fraction of connected network (g) connectivity density (h) and branches crossing regions (i) of the BC network along the CV-PV axis and overall (See Methods for details). NC = 6 samples, HO = 4 samples, STEA = 8 samples, eNASH = 7 samples. Spatially-resolved quantification represented by median ± MAD per region and overall quantifications by box-plots (median values as red lines, 25th and 75th percentiles as blue bottom and top edges of the boxes, extreme data points by whiskers). Two-tailed hypothesis test. *p-values < 0.05, **p-values < 0.01, ***p-values < 0.001. j, Dependency of the predictive classification accuracy (10-k folds) on the number of parameters used by the classifier. The k-fold validation was performed 50 times. Whereas the blue dots represent the mean value, the error bars show the sem. The predictive accuracy is defined as the complement of the cross-validation loss of the model. k, 2D representation of the training set. Each sample is represented by its two Principal Components (explaining 80.8% of the point variability. Filled shapes show samples that were wrongly classified. Filling colour indicates the pathologist classification. 52 reconstructed BC networks were used for the classification analysis from healthy tissue (23 images of NC and HO), STEA (15 images) and eNASH (14 images). l, Confusion matrix of a 10k-fold prediction of the classifier showing the 'true' classes versus the predicted ones.
Figure 5
Figure 5. Individual-based model prediction of bile pressure p and bile fluid flux profiles based on measured bile canalicular geometries.
a, Abstraction of liver lobule by cylinder symmetry with radial coordinate ρ. The mechanistic model considers secretion of osmolytes (green) and osmotic water influx (blue) in a porous medium with ρ-dependent properties (see supplemental model description). Darcy’s law is assumed with a proportionality constant K(ρ) depending on viscosity μ, tortuosity τ, bile canalicular volume fraction εBC, bile canalicular radius rBC. All geometric parameters have been measured per patient. b-e, Model prediction for bile fluid pressure (solid line, left axis) and fluid flux (defined as average velocity v times 2πρ) (dashed line, right axis) profiles for individual patients (colour) and for disease groups. f, Scatter plot of measured GGT levels versus predicted pericentral (region 1) bile fluid pressure from individual patients from all groups reveals a statistically significant positive correlation. One-sided hypothesis test. P-values and Spearman correlation coefficient are indicated in the plot. NC = 6 samples, HO = 4 samples, STEA = 8 samples, eNASH = 7 samples.

Comment in

References

    1. Torkamani A, Andersen KG, Steinhubl SR, MD EJT. High-Definition Medicine. Cell. 2017;170:828–843. - PMC - PubMed
    1. Mills SE. Histology for Pathologists. Lippincott Williams & Wilkins; 2012.
    1. Nalbantoglu ILK, Brunt EM. Role of liver biopsy in nonalcoholic fatty liver disease. World J Gastroenterol. 2014;20:9026–9037. - PMC - PubMed
    1. Tanaka N, et al. Whole-tissue biopsy phenotyping of three-dimensional tumours reveals patterns of cancer heterogeneity. Nature Biomedical Engineering. 2017:1–14. doi: 10.1038/s41551-017-0139-0. - DOI - PubMed
    1. Hägerling R, et al. VIPAR, a quantitative approach to 3D histopathology applied to lymphatic malformations. JCI Insight. 2017;2:1–14. - PMC - PubMed

Publication types