. 2020 Jan;23(1):21-31.
doi: 10.1038/s41593-019-0541-x. Epub 2019 Dec 2.

α-Synuclein strains target distinct brain regions and cell types

Affiliations

α-Synuclein strains target distinct brain regions and cell types

Angus Lau et al. Nat Neurosci. 2020 Jan.

Abstract

The clinical and pathological differences between synucleinopathies such as Parkinson's disease and multiple system atrophy have been postulated to stem from unique strains of α-synuclein aggregates, akin to what occurs in prion diseases. Here we demonstrate that inoculation of transgenic mice with different strains of recombinant or brain-derived α-synuclein aggregates produces clinically and pathologically distinct diseases. Strain-specific differences were observed in the signs of neurological illness, time to disease onset, morphology of cerebral α-synuclein deposits and the conformational properties of the induced aggregates. Moreover, different strains targeted distinct cellular populations and cell types within the brain, recapitulating the selective targeting observed among human synucleinopathies. Strain-specific clinical, pathological and biochemical differences were faithfully maintained after serial passaging, which implies that α-synuclein propagates via prion-like conformational templating. Thus, pathogenic α-synuclein exhibits key hallmarks of prion strains, which provides evidence that disease heterogeneity among the synucleinopathies is caused by distinct α-synuclein strains.


Conflict of interest statement

Competing Interests Statement

The authors declare no competing interests.

Figures

Extended Data Fig. 1
Extended Data Fig. 1. Non-normalized data for curcumin fluorescence spectral assay
S fibrils, NS fibrils, or non-polymerized (monomeric) forms of recombinant α-syn(A53T) were subjected to the curcumin dye-binding assay. Spectra were background-corrected but were not normalized. Only the fibrillar forms of α-syn gave appreciable signal, indicating that the assay is specific for aggregates. Each data point represents the mean relative fluorescence obtained from 3 biologically independent fibril preparations ± s.e.m.
Extended Data Fig. 2
Extended Data Fig. 2. α-Syn fibril strains produce distinct inclusions in a cultured cell bioassay
a) HEK293 cells expressing YFP-tagged α-syn(A53T) were transduced with monomeric α-syn(A53T), S fibrils, or NS fibrils. Each image depicts representative cells following transduction with independent fibril preparations. Scale bar = 10 μm (applies to all images). b) Cells transduced with S fibrils predominantly develop “globular” inclusions whereas cells transduced with NS fibrils predominantly develop “thread-like” inclusions (P = 2.8 x 10⁻¹², as determined by a two-tailed t-test). Data is mean ± s.e.m. from 4 biologically independent transductions.
Extended Data Fig. 3
Extended Data Fig. 3. Single-molecule fibril seeding assay for measuring the doubling time of α-syn fibril strains
a) Schematic of fibril assembly and fragmentation model used to determine the doubling time for α-syn fibril strains. For a given concentration of monomeric α-syn(A53T), the doubling time (t2) is determined by the rate constants for fibril elongation (ke) and fragmentation (kf). b) Representative ThT-stained total internal reflection fluorescence microscopy images at the indicated timepoints following seeding of monomeric α-syn(A53T) with S or NS fibrils. Scale bars = 10 μm. c) Single-molecule quantification of aggregate length as a function of time following seeding with S or NS fibrils. Each data point represents the mean ± s.e.m. from 3 independent seeding reactions.
Extended Data Fig. 4
Extended Data Fig. 4. Additional thermolysin digestions of brain homogenates from inoculated TgM83 mice
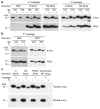
a) Immunoblots of detergent-insoluble α-syn species in brain homogenates from the second or third passage of the S or NS fibril-derived strains in TgM83 mice, with or without digestion with thermolysin (TL). Brain homogenates from asymptomatic TgM83 mice from the second passage of PBS were used as a negative control. b) Immunoblots of detergent-insoluble α-syn species in brain homogenates from the second passage of the MSA- or M83+/+-derived strains in TgM83 mice, with or without digestion with TL. In b and c, blots were probed with antibodies to either total α-syn or PSyn. For each inoculum, results from two distinct mice are shown. dpi, days post-inoculation. c) Immunoblots of detergent-insoluble α-syn species in brain homogenates from TgM83 mice inoculated with the indicated α-syn preparations, with or without digestion with TL. Human α-syn was detected with the antibody MJFR1 and mouse α-syn was detected with the antibody D37A6. TL-resistant α-syn species were only present in the animals injected with α-syn aggregates and were only detectable with the antibody specific for human α-syn.
Extended Data Fig. 5
Extended Data Fig. 5. Phosphorylated α-syn (PSyn) deposition in the midbrain and hypothalamus of TgM83 mice injected with various α-syn strains.
a) Representative immunohistochemistry images for PSyn in midbrain and hypothalamus sections from asymptomatic TgM83 mice following inoculation with either PBS or monomeric α-syn, or from clinically ill mice inoculated with either the S fibril- or NS fibril-derived strains (first, second, or third passage). Scale bar = 50 μm (applies to all images). dpi, days post-inoculation. b) Representative immunohistochemistry images for PSyn in midbrain and hypothalamus sections from asymptomatic uninoculated TgM83 mice, or from clinically ill mice inoculated with either the MSA- or M83+/+-derived strains (first or second passage). Scale bar = 50 μm (applies to all images).
Extended Data Fig. 6
Extended Data Fig. 6. Additional immunohistochemical characterization of α-syn inclusions in TgM83 mice inoculated with the S or NS fibril-derived strains
Representative immunohistochemistry images for either PSyn (midbrain), PK-resistant total α-syn (hypothalamus), or p62 (midbrain) in brain sections from clinically ill TgM83 mice inoculated with either the S fibril- or NS fibril-derived strains (first or second passage). Scale bar = 10 μm (applies to all images). For each experimental group, stainings were performed on a minimum of two mice with similar results.
Extended Data Fig. 7
Extended Data Fig. 7. Comparison of PK-resistant α-syn species generated from recombinant α-syn fibril strains with α-syn species in brain homogenates from fibril-inoculated TgM83 mice
Immunoblot of detergent-insoluble α-syn species following digestion of recombinant fibrils or brain homogenates from fibril-inoculated TgM83 mice (first passage) with PK. PK-resistant α-syn was detected using the antibody Syn-1.
Extended Data Fig. 8
Extended Data Fig. 8. Additional conformational stability assay (CSA) data for α-syn species in brain homogenates from inoculated TgM83 mice
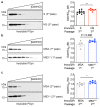
a) CSA for PSyn aggregates in clinically ill TgM83 mice inoculated with either the S or NS fibril-derived strains (third passage). Representative PSyn immunoblots and the resultant GdnHCl50 values are shown. The PSyn aggregates in mice inoculated with the NS fibril-derived strain are significantly more stable (P = 0.0091). Data is mean ± s.e.m (n = 10 mice for the S strain and n = 7 mice for the NS strain). b) CSA for PSyn aggregates in clinically ill TgM83 mice inoculated with either MSA- or M83+/+ brain extract (first passage). Representative PSyn immunoblots and the resultant GdnHCl50 values are shown. Data is mean ± s.e.m (n = 4 for MSA-inoculated mice, n = 6 for M83+/+-inoculated mice). c) CSA for PSyn aggregates in clinically ill TgM83 mice inoculated with either the MSA- or M83+/+-derived strains (second passage). Representative PSyn immunoblots and the resultant GdnHCl50 values are shown. The PSyn aggregates in mice inoculated with the M83+/+-derived strain are significantly more stable (P = 0.038). Data is mean ± s.e.m (n = 6 for both groups of inoculated mice). All P values were obtained using a two-tailed t-test.
Extended Data Fig. 9
Extended Data Fig. 9. Additional characterization of PMCA-generated α-syn fibrils and PMCA fibril-inoculated TgM83 mice
a) Kinetics of fibril formation for PMCA fibrils in a ThT fluorescence assay. Reactions incubated at 37 ºC in the absence of shaking or sonication (“no PMCA”) were used as a negative control. Each data point represents the mean ± s.e.m of 4 biologically independent replicates. b) Negative stain electron micrograph of PMCA fibrils. The PMCA procedure generated fibrils that were much shorter than either the S or NS fibrils (determined using 3 biologically independent fibril preparations). Scale bar = 200 nm. c) SDS-PAGE followed by silver staining of PK-digested α-syn fibril preparations. PMCA fibrils composed of wild-type (WT) α-syn exhibit a different banding pattern of insoluble PK-resistant α-syn species compared to S fibrils, NS fibrils, and PMCA fibrils composed of A53T-mutant α-syn. d) Immunoblots of detergent-insoluble total α-syn and PSyn species in brain homogenates from two distinct asymptomatic monomer-inoculated mice or clinically ill PMCA fibril-inoculated mice (first passage), with or without digestion with TL. e) Representative immunohistochemistry images for PSyn in midbrain and hypothalamus sections from asymptomatic TgM83 mice following inoculation with monomeric α-syn, or from clinically ill mice inoculated with the PMCA fibril-derived strain (first or second passage). Scale bar = 50 μm (applies to all images). f) GdnHCl50 values for PSyn aggregates in TgM83 mice inoculated with the PMCA fibril-derived strain (first or second passage) are not significantly (ns) different (P = 0.52 for first passage; P = 0.99 for second passage by one-way ANOVA with Tukey’s multiple comparisons test) than for mice inoculated with the S fibril-derived strain (third passage). Data is mean ± s.e.m (n = 5 for first passage PMCA, n = 7 for second passage PMCA, and n = 10 for third passage S strain). g) Immunoblot of PK-digested and detergent-insoluble α-syn species in brain homogenates from clinically ill TgM83 mice inoculated with either the PMCA fibril-derived strain (first or second passage) or the S fibril-derived strain (second passage). Blot was probed with the Syn-1 antibody.
Extended Data Fig. 10
Extended Data Fig. 10. Absence of PSyn pathology in TgM83 mice inoculated with brain extract from a DLB patient or an AD patient with concomitant α-syn deposition
a) Thermolysin digestion of brain extracts from the three human synucleinopathy samples inoculated into TgM83 mice. α-Syn was detected using the antibody Syn-1. b) Semiquantitative PSyn deposition scoring (data are mean ± s.e.m.) within the indicated brain regions from asymptomatic TgM83 mice at 540 days following inoculation with PBS (first passage, n = 7), DLB brain extract (n = 5), or AD brain extract (n = 4). c) Representative immunohistochemistry images for PSyn in midbrain and hypothalamus sections from asymptomatic TgM83 mice following inoculation with DLB or AD brain extract. Scale bar = 50 μm (applies to all images).
Figure 1
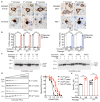
Figure 1. Generation and characterization of recombinant α-syn fibril strains.
a) Conditions used for generating Salt (S) and No Salt (NS) fibrils. b) Kinetics of fibril formation for S and NS fibrils in a real-time ThT fluorescence assay. Reactions containing only ThT were used as a negative control. The lag phase for S fibril formation was significantly shorter than the lag phase for NS fibril formation (P = 1.6 x 10⁻⁴ by a two-tailed t-test). n = 6 biologically independent reactions. Data is mean ± s.e.m. c) After either 7 or 12 days of incubation, NS fibrils bind significantly less ThT than S fibrils (P = 0.0041 for day 7; P = 2.7 x 10⁻⁸ for day 12 by two-way ANOVA with Sidak’s multiple comparison test). n = 6 biologically independent reactions. Data is mean ± s.e.m. d) At the ultrastructural level, NS fibrils are significantly longer than S fibrils, as determined by electron microscopy (P = 2.5 x 10⁻⁵ by a two-tailed t-test). n = 3 biologically independent fibril preparations. Data is mean ± s.e.m. Scale bars = 200 nm. e) Following digestion with proteinase K (PK), S fibrils and NS fibrils produce different banding patterns of insoluble α-syn species, as assessed by SDS-PAGE followed by silver staining. For both S and NS fibrils, 3 biologically independent fibril preparations were analyzed. f) The fluorescence emission spectra for curcumin bound to S and NS fibrils are distinct. Each data point represents the mean relative fluorescence obtained from 3 biologically independent fibril preparations ± s.e.m. g) Conformational stability assay (CSA) for S and NS fibrils. Representative α-syn immunoblots (Syn-1 antibody) and the resultant denaturation curves are shown. The curves depict mean residual α-syn values ± s.e.m. following treatment with the indicated concentrations of GdnHCl. n = 6 biologically independent fibril preparations. h) S fibrils are significantly less stable than NS fibrils (P = 0.0065 by a two-tailed t-test). n = 6 biologically independent fibril preparations. Data is mean ± s.e.m.
Figure 2
Figure 2. Serial propagation of recombinant and brain-derived α-syn strains in TgM83 mice.
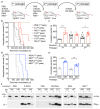
a) Schematic of the serial propagation studies in hemizygous TgM83 mice (TgM83+/-). b) Kaplan-Meier survival curves for TgM83 mice inoculated with either PBS, S fibrils, or NS fibrils (first, second, or third passage). n = 7 (PBS), 5 (S first passage), 4 (NS first passage), 10 (S second passage), 5 (NS second passage), 10 (S third passage), or 8 mice (NS third passage). c) Upon first or third passage, the incubation periods for the NS fibril-derived strain were significantly longer than for the S fibril-derived strain (P = 3.0 x 10⁻⁴ for first passage; P = 0.013 for third passage by one-way ANOVA with Tukey’s multiple comparisons test). n = 5 (S first passage), 3 (NS first passage), 10 (S second passage), 5 (NS second passage), 10 (S fibrils passage), or 8 mice (NS third passage). Data are mean ± s.e.m. d) Kaplan-Meier survival curves for TgM83 mice inoculated with either MSA or M83+/+ brain extract (first or second passage). n = 4 (MSA first passage), 6 (M83+/+ first passage), 9 (MSA second passage), or 7 mice (M83+/+ second passage). e) On both first and second passage, the incubation periods for mice injected with the M83+/+-derived strain were significantly longer than for mice injected with the MSA-derived strain (P = 5.6 x 10⁻¹⁰ for first passage; P = 2.5 x 10⁻⁸ for second passage by one-way ANOVA with Tukey’s multiple comparisons test). n = 4 (MSA first passage), 6 (M83+/+ first passage), 9 (MSA second passage), or 7 mice (M83+/+ second passage). Data are mean ± s.e.m. f) Immunoblots of detergent-insoluble α-syn species, with or without thermolysin (TL) digestion, in brain homogenates from asymptomatic PBS-inoculated TgM83 mice or clinically ill TgM83 mice at the indicated days post-inoculation (dpi) with the indicated α-syn strains (first passage). Blots were probed with antibodies to either total α-syn or PSyn. For each inoculum, results from two distinct mice are shown.
Figure 3
Figure 3. α-Syn strains target distinct brain regions in TgM83 mice.
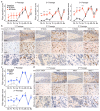
a) Semiquantitative PSyn deposition scoring within the indicated brain regions from clinically ill TgM83 mice following the first, second, or third passage of the S or NS fibril-derived strains. The patterns of PSyn deposition were significantly different for the S and NS fibril-derived strains upon second (P = 0.012) and third passage (P = 6.5 x 10⁻⁵), as determined by two-way ANOVA. n = 5 (S first passage), 3 (NS first passage), 10 (S second passage), 5 (NS second passage), 10 (S third passage), or 7 mice (NS third passage). Data are mean ± s.e.m. **P < 0.01; ***P < 0.001 as determined by Sidak’s multiple comparisons test. Ob, olfactory bulb; Fc, frontal cortex; Pc, parietal cortex; Hp, hippocampus; Th, thalamus; Hy, hypothalamus; Mb, midbrain; Cb, cerebellar white matter; Bs, brainstem. b) Representative immunohistochemistry images for PSyn in the hippocampus (dentate gyrus region), frontal cortex, or olfactory bulb from mice following inoculation with the S or NS fibril-derived strains (first, second, or third passage). c) Semiquantitative PSyn deposition scoring within the indicated brain regions from clinically ill TgM83 mice following the first or second passage of the MSA or M83+/+-derived strains. The patterns of PSyn deposition were significantly different for the MSA and M83+/+ fibril-derived strains upon second passage (P = 0.0041), as determined by two-way ANOVA. n = 4 (MSA first passage), 6 (M83+/+ first passage), 9 (MSA second passage), or 7 mice (M83+/+ second passage). Data are mean ± s.e.m. **P < 0.01; ***P < 0.001 as determined by Sidak’s multiple comparisons test. d) Representative immunohistochemistry for PSyn in the hippocampus (dentate gyrus region), frontal cortex, or olfactory bulb from symptomatic mice following inoculation with the MSA or M83+/+-derived strains (first or second passage). In b and d, scale bars = 50 μm (hippocampus and frontal cortex) or 25 μm (olfactory bulb).
Figure 4
Figure 4. The NS fibril and M83+/+-derived α-syn strains selectively target astrocytes in TgM83 mice.
a) Representative immunohistochemistry images for PSyn in the thalamus of clinically ill TgM83 mice inoculated with either the NS fibril-derived strain (first, second, or third passage) or the M83+/+-derived strain (first or second passage) reveals α-syn pathology within astrocytes. Scale bar = 25 μm (applies to all images). b) Quantification of PSyn-positive astrocytes within the thalamus of TgM83 mice inoculated with either the S or NS fibril-derived strains (first, second, or third passage) as well as all TgM83 mice inoculated with either the MSA- or M83+/+-derived strains (first or second passage). Significantly more PSyn-positive astrocytes were present in mice inoculated with the NS fibril-derived strain compared to mice inoculated with the S fibril-derived strain (P = 0.0064, 1.1 x 10⁻⁵, and 1.1 x 10⁻⁴ for first, second, and third passages, respectively) as well as in mice inoculated with the M83+/+-derived strain compared to mice inoculated with the MSA-derived strain (P = 0.0047 and 0.016 for first and second passages, respectively), as determined by one-way ANOVA with Tukey’s multiple comparisons test. n = 5 (S first passage), 3 (NS first passage), 10 (S second passage), 5 (NS second passage), 10 (S third passage), 7 (NS third passage), 4 (MSA first passage), 6 (M83+/+ first passage), 9 (MSA second passage), or 7 mice (M83+/+ second passage). Data are mean ± s.e.m. c) Co-localization of PSyn (red) and glial fibrillary acidic protein (GFAP; green) staining in double-labeled sections of the thalamus from TgM83 mice inoculated with either NS fibrils or M83+/+ brain extract (first passage). Scale bar = 10 μm (applies to all images).
Figure 5
Figure 5. Conformational discrimination of α-syn strains in the brains of inoculated TgM83 mice.
a) Representative immunohistochemistry images for PSyn in the midbrain of clinically ill TgM83 mice inoculated with either the S or NS fibril-derived strains (first, second, or third passage), or with the MSA or M83+/+-derived strains (first or second passage). Neurons in mice inoculated with the S or MSA strains contain “ring-like” PSyn deposits whereas neurons in mice inoculated with the NS or M83+/+ strains contain “LB-like” PSyn deposits. Scale bar = 10 μm (applies to all images). b) Quantification of ring-like vs. LB-like PSyn inclusions in the midbrain of inoculated TgM83 mice. The distribution of PSyn inclusions was significantly different in mice inoculated with the NS fibril-derived strain compared to mice inoculated with the S fibril-derived strain (P = 5.5 x 10⁻¹⁴) as well as in mice inoculated with the M83+/+-derived strain compared to mice inoculated with the MSA-derived strain (P = 2.3 x 10⁻¹⁴), as determined by one-way ANOVA with Tukey’s multiple comparisons test. n = 5 (S ffirst passage), 3 (NS first passage), 10 (S second passage), 5 (NS second passage), 10 (S third passage), 7 (NS third passage), 4 (MSA first passage), 6 (M83+/+ first passage), 9 (MSA second passage), or 7 mice (M83+/+ second passage). Data are mean ± s.e.m. c) Immunoblots of detergent-insoluble α-syn species in brain homogenates from inoculated TgM83 mice following treatment with PK. Blots were probed with the Syn-1 antibody. d) CSA for PSyn aggregates from all TgM83 mice inoculated with either the S or NS fibril-derived strains (first or second passage). Representative PSyn immunoblots and the resultant denaturation curves are shown. The curves depict mean residual PSyn values ± s.e.m. following treatment with the indicated concentrations of GdnHCl. e) The GdnHCl50 values for PSyn aggregates in mice inoculated with the S fibril-derived strain are significantly lower than in mice injected with the NS fibril-derived strain (P = 3.3 x 10⁻⁴ for first passage and P = 1.1 x 10⁻⁴ for second passage, as determined by one-way ANOVA with Tukey’s multiple comparisons test). Data are mean ± s.e.m. For d and e, n = 4 (S first passage), 3 (NS first passage), 9 (S second passage), or 5 mice (NS second passage).
Figure 6
Figure 6. PMCA-generated α-syn fibrils produce a phenotype similar to that induced by S fibrils upon propagation in TgM83 mice.
a) Conditions used for generating PMCA α-syn fibrils. b) Following digestion with PK, PMCA fibrils exhibit a different banding pattern of insoluble α-syn species than either S or NS fibrils, as assessed by SDS-PAGE followed by silver staining. Results from three independent preparations of PMCA fibrils are shown. c) Kaplan-Meier survival curves for TgM83 mice inoculated with the PMCA fibril-derived strain (first or second passage) or the S fibril-derived strain (pooled data from second and third passages). n = 8 (PMCA first passage), 10 (PMCA second passage) or 20 mice (S second/third passages). d) Upon second passage, the incubation periods obtained with the PMCA-derived strain were similar to those for the S fibril-derived strain (pooled data from second and third passages). n = 9 (PMCA second passage) or 20 mice (S second/third passages). Data are mean ± s.e.m. ns, not significant (P = 0.71 by a two-tailed t-test). e) Semiquantitative PSyn deposition scoring (data are mean ± s.e.m.) within the indicated brain regions from clinically ill TgM83 mice following inoculation with the PMCA fibril-derived strain (first or second passage, n = 8 or 5, respectively) or the S fibril-derived strain (pooled data from second and third passages, n = 20). The patterns of PSyn deposition are not significantly different between the three groups (P = 0.063 by two-way ANOVA). f) Representative immunohistochemistry images for PSyn in the midbrain of TgM83 mice inoculated with either the PMCA fibril-derived strain (first or second passage) or the S fibril-derived strain (third passage). The PMCA fibril-derived strain exhibits “ring-like” PSyn inclusions similar to those present in mice injected with the S fibril-derived strain. Scale bar = 10 μm (applies to all images). g) Quantification of ring-like vs. LB-like PSyn inclusions in the midbrain of TgM83 mice inoculated with the PMCA fibril-derived strain (n = 8 for first passage, n = 5 for second passage) compared to mice inoculated with the S fibril-derived strain (pooled data from second and third passages, n = 20). There was no difference in the distribution of ring-like vs. LB-like PSyn inclusions between either the first (P = 0.80) or second (P = 0.91) passages of the PMCA fibril-derived strain and the S fibril-derived strain, as determined by one-way ANOVA with Tukey’s multiple comparisons test. Data are mean ± s.e.m.
Figure 7
Figure 7. Conformational discrimination of α-syn strains in human synucleinopathies.
a) CSA for PSyn aggregates in brain extracts from patients with MSA, DLB, or AD with concomitant PSyn deposition. Representative PSyn immunoblots and the resultant denaturation curves are shown. The curves depict mean residual PSyn values ± s.e.m. following treatment with the indicated concentrations of GdnHCl. For each disease, samples from four different patients were analyzed. b) Significantly higher GdnHCl50 values were obtained for PSyn aggregates in DLB (P = 3.2 x 10⁻⁴) and AD patients (P = 3.5 x 10⁻⁴) than for MSA patients (n = 4 each), as determined by one-way ANOVA with Tukey’s multiple comparisons test. Data are mean ± s.e.m.

Comment in

References

    1. Spillantini MG, Goedert M. The alpha-synucleinopathies: Parkinson's disease, dementia with Lewy bodies, and multiple system atrophy. Ann N Y Acad Sci. 2000;920:16–27. - PubMed
    1. Burre J, et al. Alpha-synuclein promotes SNARE-complex assembly in vivo and in vitro. Science. 2010;329:1663–1667. - PMC - PubMed
    1. Fujiwara H, et al. alpha-Synuclein is phosphorylated in synucleinopathy lesions. Nat Cell Biol. 2002;4:160–164. - PubMed
    1. Lashuel HA, Overk CR, Oueslati A, Masliah E. The many faces of alpha-synuclein: from structure and toxicity to therapeutic target. Nat Rev Neurosci. 2013;14:38–48. - PMC - PubMed
    1. Polymeropoulos MH, et al. Mutation in the α-synuclein gene identified in families with Parkinson's disease. Science. 1997;276:2045–2047. - PubMed

Publication types

MeSH terms

LinkOut - more resources