

Differences in Pressure Recovery Between Balloon Expandable and Self-expandable Transcatheter Aortic Valves
- PMID: 31792706
- PMCID: PMC11043825
- DOI: 10.1007/s10439-019-02425-8
Differences in Pressure Recovery Between Balloon Expandable and Self-expandable Transcatheter Aortic Valves
Abstract
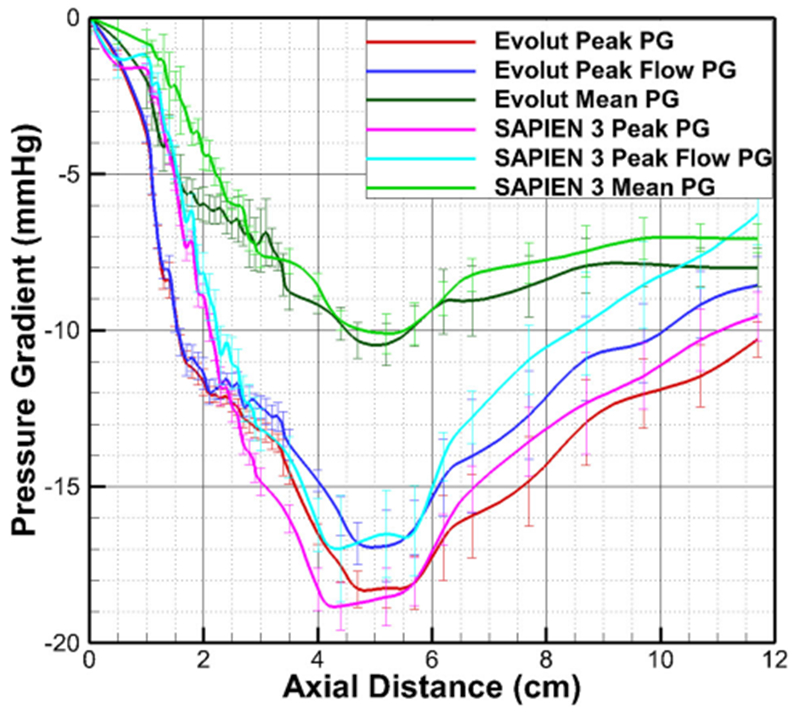
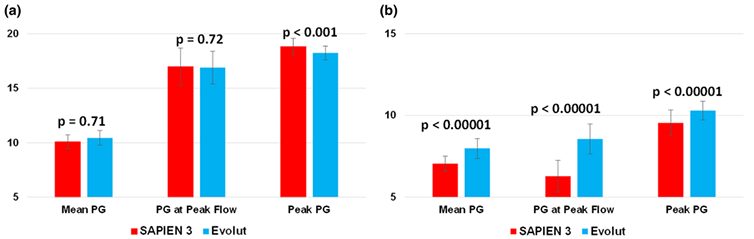
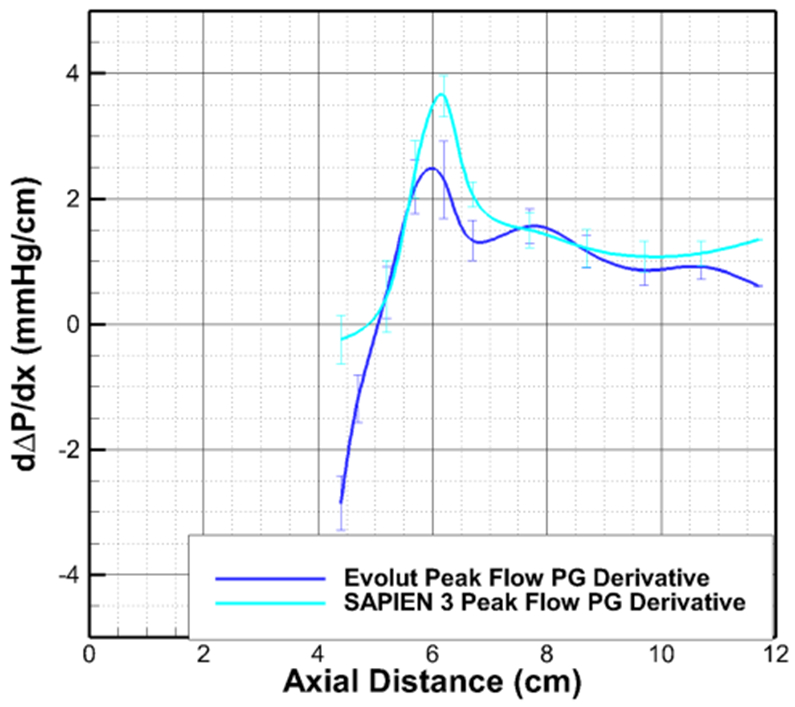
Pressure recovery downstream of the aortic valve constitutes an important factor affecting the calculation of pressure gradient (PG) across the valve and therefore the accuracy of the calculated aortic valve area. Some clinical studies hypothesized that stent and valve cusps design contribute to flow acceleration and Doppler-measured valve gradients across the balloon-expandable transcatheter aortic valve. This study aims at elucidating the physical mechanisms behind pressure recovery variations between Edwards SAPIEN 3 and Medtronic Evolut TAVs through the measurements of sensitive and precise axial pressure profiles. A 23 mm Edwards SAPIEN3 and a 26 mm Medtronic Evolut were deployed in a pulse duplicator. A Millar catheter was used to record 50 cycles of pressure data along the centerline of the valve chamber upstream and downstream of the valve. The peak PG obtained with SAPIEN at vena contracta (VC) is 18.83 ± 0.75 mmHg and after recovery, 9.56 ± 0.78 mmHg. For Evolut at VC, peak PG is 18.25 ± 0.63 mmHg and after recovery, 10.3 ± 0.57 mmHg. The differences in peak PG at VC and at the recovery were statistically significant (p < 0.001). With SAPIEN 3 at VC, the mean PG obtained is 10.11 ± 0.63 mmHg and after recovery 7.06 ± 0.46 mmHg. For Evolut, mean PG at VC is 10.45 ± 0.67 mmHg and after recovery 7.99 ± 0.61 mmHg. The differences between the mean PG between the two valves was not statistically significant at VC (p = 0.71) but significant post-recovery (p < 0.00001). While gradients at the VC are higher with the SAPIEN 3, the net gradient after pressure recovery is significantly lower compared to Evolut TAV. Efficiency of pressure recovery significantly depends on valve type due to stent interference with the recovering blood flow.
Keywords: Catheterization; Doppler; Pressure gradient; Pressure recovery; Transcatheter aortic valve; Turbulence.
Conflict of interest statement
DISCLOSURES
Dr. Dasi reports having patent applications filed on novel polymeric valves, vortex generators and superhydrophobic/omniphobic surfaces. Dr. Hahn is a consultant for Edwards Lifescience and Medtronic, and is Chief Scientific Officer for the Echocardiography Core Laboratory at the Cardiovascular Research Foundation for multiple industry-sponsored trials, for which she receives no direct industry compensation. No other conflicts were reported.
Figures

References
-
- Alston M., et al. 600.19 Invasive versus Doppler-derived gradients after TAVR. JACC Cardiovasc Interv 12(4):S48, 2019.
-
- Bach DS Echo/Doppler evaluation of hemodynamics after aortic valve replacement: principles of interrogation and evaluation of high gradients. JACC Cardiovasc Imaging 3(3):296–304, 2010. - PubMed
-
- Bahlmann E., et al. Impact of pressure recovery on echocardiographic assessment of asymptomatic aortic stenosis: a SEAS substudy. JACC Cardiovasc Imaging 3(6):555–562, 2010. - PubMed
-
- Bahlmann E., et al. Prognostic value of energy loss index in asymptomatic aortic stenosis. Circulation 127(10):1149–1156, 2013. - PubMed
-
- Baumgartner H, Falk V, Bax JJ, De Bonis M, et al. ESC/EACTS Guidelines for the management of valvular heart disease: the task force for the management of valvular heart disease of the European Society of Cardiology (ESC) and the European Association for Cardio-Thoracic Surgery (EACTS). Eur Heart J 2017(38):2739–2791, 2017. - PubMed
MeSH terms
Grants and funding
LinkOut - more resources
Full Text Sources
