

Blockade of IGF2R improves muscle regeneration and ameliorates Duchenne muscular dystrophy
- PMID: 31793167
- PMCID: PMC6949491
- DOI: 10.15252/emmm.201911019
Blockade of IGF2R improves muscle regeneration and ameliorates Duchenne muscular dystrophy
Abstract
Duchenne muscular dystrophy (DMD) is a debilitating fatal X-linked muscle disorder. Recent findings indicate that IGFs play a central role in skeletal muscle regeneration and development. Among IGFs, insulinlike growth factor 2 (IGF2) is a key regulator of cell growth, survival, migration and differentiation. The type 2 IGF receptor (IGF2R) modulates circulating and tissue levels of IGF2 by targeting it to lysosomes for degradation. We found that IGF2R and the store-operated Ca2+ channel CD20 share a common hydrophobic binding motif that stabilizes their association. Silencing CD20 decreased myoblast differentiation, whereas blockade of IGF2R increased proliferation and differentiation in myoblasts via the calmodulin/calcineurin/NFAT pathway. Remarkably, anti-IGF2R induced CD20 phosphorylation, leading to the activation of sarcoplasmic/endoplasmic reticulum Ca2+ -ATPase (SERCA) and removal of intracellular Ca2+ . Interestingly, we found that IGF2R expression was increased in dystrophic skeletal muscle of human DMD patients and mdx mice. Blockade of IGF2R by neutralizing antibodies stimulated muscle regeneration, induced force recovery and normalized capillary architecture in dystrophic mdx mice representing an encouraging starting point for the development of new biological therapies for DMD.
Keywords: DMD; IGF2; IGF2R; muscle regeneration; muscular dystrophy.
© 2019 The Authors. Published under the terms of the CC BY 4.0 license.
Conflict of interest statement
The authors declare that they have no conflict of interest.
Figures
- A
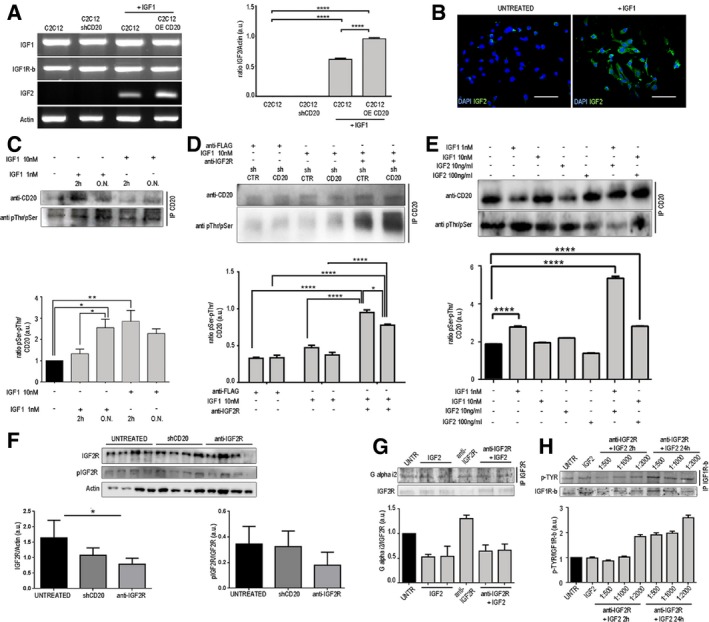
RT–PCR expression and quantification of IGF1, IGF1Rβ and IGF2 levels in untreated C2C12 and shCD20 C2C12 myoblasts and 10 nM IGF1‐treated C2C12 and over‐expressing CD20 C2C12 myoblasts. Each experiment was replicated independently four times. Two‐way ANOVA. ****P < 0.0001. All values are expressed as the mean ± SEM.
- B
Immunofluorescence for IGF2 (in green) in untreated and 10 nM IGF1‐treated C2C12 myoblasts. Scale bars = 75 μm.
- C–E
Representative CD20 immunoprecipitation using anti‐pSer + pThr in (C) C2C12 cells treated with IGF1 for 2 h or overnight (ON), (D) sh‐empty (shCTR)‐ and shCD20‐treated C2C12 cells treated with anti‐Flag and 10 nM anti‐IGF2R, (E) C2C12 cells treated with IGF1 and IGF2, as indicated. Densitometric analysis of data is expressed as the ratio of CD20/vinculin or pSer + pThr/CD20 and is shown normalized to vinculin in arbitrary units in the lower panels. Two‐way ANOVA. *P < 0.05; **P < 0.01; ****P < 0.0001. Each experiment was performed in triplicate wells. All values are expressed as the mean ± SEM.
- F
Representative WB of IGF2R and phosphorylated IGF2R (pIGF2R) in untreated, shCD20‐treated and anti‐IGF2R‐treated C2C12 cells. Densitometric analysis of data is expressed as the ratio of IGF2R/actin or pIGF2R/IGF2R in arbitrary units in the lower panels. One‐way ANOVA. *P < 0.05. Each experiment was performed in triplicate wells. All values are expressed as the mean ± SEM.
- G
IGF2R immunoprecipitation products were immunoblotted for Gαi2 and WB expression of IGF2R in untreated, IGF2‐treated, anti‐IGF2R‐treated and IGF2 + anti‐IGF2R‐treated C2C12 cells. Densitometric analysis of data is expressed as the ratio of Gαi2/IGF2R in arbitrary units in the lower panel. Each experiment was performed in triplicate wells. All values are expressed as the mean ± SEM.
- H
Representative WB of IGF1Rβ and IGF1Rβ immunoprecipitation products immunoblotted for pTyr in untreated, IGF2‐treated and IGF2 + anti‐IGF2R‐treated (1:500, 1:1,000 and 1:2,000 dilutions of anti‐IGF2R) C2C12 cells (cells were treated for 2 and 24 h). Densitometric analysis of data is expressed as the ratio of pTYR/IGF1Rβ in arbitrary units in the lower panel. Each experiment was performed in triplicate wells. All values are expressed as the mean ± SEM.
- A
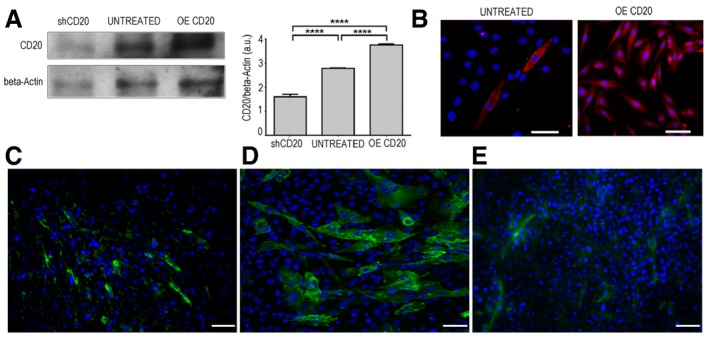
Knockdown (shCD20) and over‐expression (OE) of CD20 was tested by WB analysis. Densitometry analysis of data expressed as the CD20/β‐actin ratio in arbitrary units. One‐way ANOVA. ****P < 0.0001 (n = 5 independent experiments). All values are expressed as the mean ± SEM.
- B
Immunofluorescence showing CD20 expression in untreated and CD20 over‐expressing C2C12 myoblasts. Scale bars = 75 μm.
- C–E
3T3 mouse fibroblasts were labelled for anti‐IGF1R tyrosine phosphorylation (green) under basal conditions (C), when co‐stimulated with IGF2 and anti‐IGF2R (D) and in the presence of IGF2 (E). Scale bars = 75 μm.
- A–C
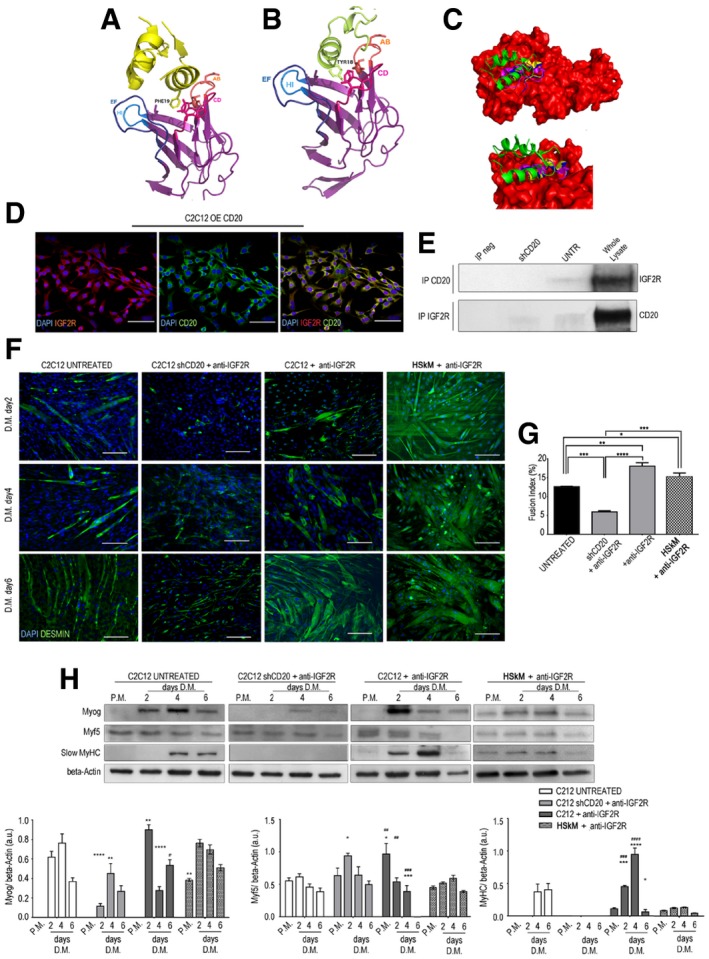
Bioinformatic prediction of IGF2R and CD20 cross‐reactivity. Cartoon representation of the interaction of IGF2 (yellow) and IGF2R domain 11 complex from X‐ray structure (PDB code 2v5p). IGF2R domain 11 AB, CD, EF and HI loops and residues (shown in sticks format) involved in the hydrophobic interactions are shown (A). Cartoon representation of the IGF2R domain 11–CD20 (lime) complex obtained from docking simulations and residues involved in hydrophobic interactions is shown in stick format (B). The structure of IGF2R (in red) and IGF2 (green) is shown compared to docking poses of epitope 3. These data show that the helical region (residues 178–184) of the epitope mediates binding to the receptor as well as IGF2. The C‐terminal helix of epitope 3 partially overlaps the first α‐helix of IGF2. ClusPro‐dock IGF2R‐CD20 binding epitope poses corresponding to PDB codes 2v5p‐2oslP, 2v5p‐2oslQ and 2v5p‐3pp4P are coloured in yellow, blue and cyan, respectively (C).
- D
Over‐expressing CD20 in C2C12 myoblasts that co‐expressed CD20 (in green) and IGF2R (in red). DAPI‐labelled nuclei are shown in blue. Scale bars = 75 μm.
- E
Representative CD20 and IGF2R immunoprecipitation products immunoblotted for IGF2R and CD20, respectively, in untreated and shCD20‐treated C2C12 cell membranes and whole lysates of proteins. The immunoprecipitation output is shown as IP neg.
- F
Myotube immunofluorescence of cells in proliferation medium (P.M.) and after 2, 4 and 6 days of myogenic differentiation in serum‐free medium. Control (untreated), shCD20‐treated C2C12 cells, C2C12 and HSkM myoblasts pre‐treated with anti‐IGF2R for 24 h were stained. Desmin‐positive myotubes are shown in green. Scale bars = 75 μm.
- G
Fusion index quantification after 6 days of differentiation. One‐way ANOVA. *P < 0.05; **P < 0.01; ***P < 0.001; ****P < 0.0001. Each experiment was performed in triplicate wells. All values are expressed as mean ± SEM.
- H
Representative WB of anti‐myogenin, anti‐Myf5, anti‐MyHC and anti‐β‐actin in total protein lysates obtained from untreated, shCD20‐treated C2C12 cells, and C2C12 and HSkM myoblasts pre‐treated with anti‐IGF2R for 24 h; cells were collected under P.M. and after 2, 4 and 6 days of myogenic differentiation. Densitometric analysis of WB data expressed as the ratio of the indicated antibody/β‐actin in arbitrary units. Two‐way ANOVA test. *P < 0.05; **P < 0.01; ***P < 0.001; ****P < 0.0001 in comparison with the results obtained in untreated cells at the corresponding time point. ## P < 0.01; ### P < 0.001; #### P < 0.0001 in comparison with the results obtained in shCD20‐treated C2C12 cells at the corresponding time point. Each experiment was performed in triplicate wells. All values are expressed as the mean ± SEM.
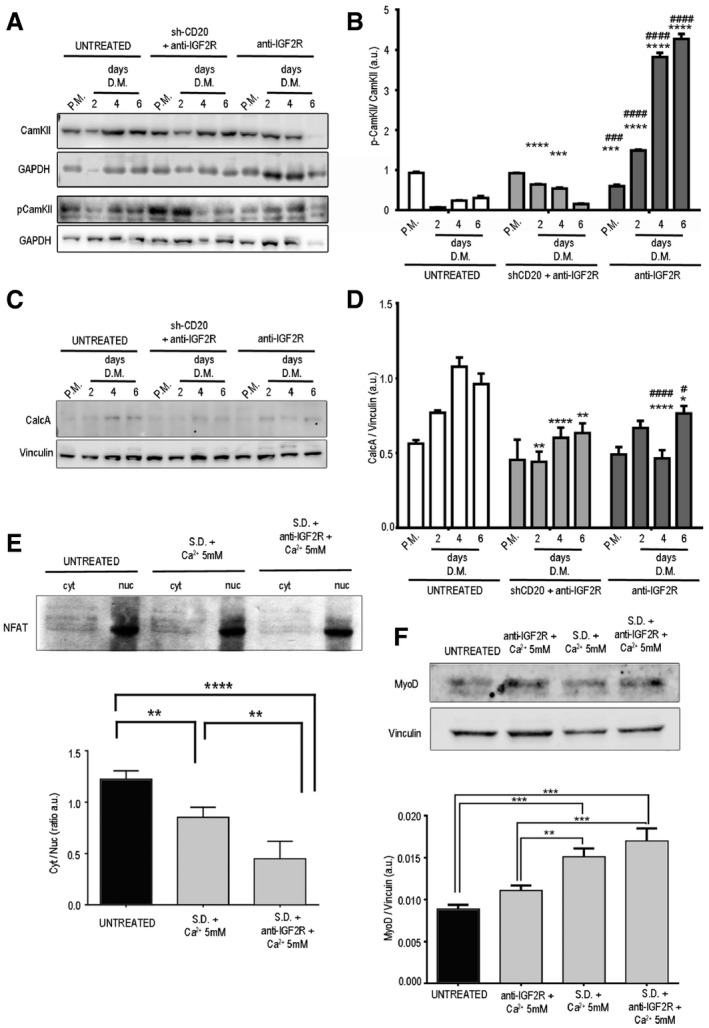
Representative WB analysis of CAMKII, pCAMKII and GAPDH levels in total protein lysates of untreated and anti‐IGF2R‐treated C2C12 cells and ShCD20 C2C12 myoblasts grown in proliferation medium (PM) after 2, 4 and 6 days of myogenic differentiation (DM).
Densitometry analysis of data shown in panel (A) expressed as the ratio of pCAMKII/CAMKII in arbitrary units. Two‐way ANOVA test. ***P < 0.001; ****P < 0.0001 for the comparison with untreated cells at the corresponding time point. ### P < 0.001; #### P < 0.0001 for the comparison with C2C12 shCD20 cells at the corresponding time point. Each experiment was performed in triplicate wells. All values are expressed as the mean ± SEM.
Representative WB analysis of CalcA and vinculin levels in total protein lysates of untreated and anti‐IGF2R‐treated C2C12 cells and ShCD20 C2C12 myoblasts grown in proliferation medium (PM) and collected after 2, 4 and 6 days of DM.
Densitometry analysis of data shown in panel (C). Data are expressed as the ratio of CalcA/vinculin in arbitrary units. Two‐way ANOVA test. *P < 0.05; **P < 0.01; ****P < 0.0001 for the comparison with untreated cells at the corresponding time point. # P < 0.05; #### P < 0.0001 for the comparison with C2C12 shCD20 cells at the corresponding time point. Each experiment was performed in triplicate wells. All values are expressed as the mean ± SEM.
SDS–PAGE gel and immunoblots showing NFAT expression in cytoplasmic and nuclear fractions of untreated and SD+ 5 mM Ca2+ and SD+ 5 mM Ca2++anti‐IGF2R treated C2C12 myoblasts. The image reveals that there was a decrease in the size of the band corresponding to pNFAT in the cytoplasmic samples obtained from SD+ 5 mM Ca2+ and SD+ 5 mM Ca2+ +anti‐IGF2R‐treated C2C12 myoblasts. The lower panel shows the quantification of the cytoplasmic/nuclear NFAT signal expressed as a ratio in arbitrary units. The decrease observed in these experiments confirmed the increase in the nuclear localization of NFAT caused by its diminished cytoplasmic phosphorylation. The experiment was performed three times. One‐way ANOVA test. **P < 0.01; ****P < 0.0001. All values are expressed as the mean ± SEM.
Representative immunoblot images indicating MYOD and vinculin expression in the total cell lysates of untreated and SD+ 5 mM Ca2+ and SD+ 5 mM Ca2++anti‐IGF2R and 5 mM Ca2+ +anti‐IGF2R‐treated C2C12 myoblasts; results were quantified and are shown as a ratio expressed in arbitrary units in the lower panel. Experiments were repeated three times. One‐way ANOVA test. **P < 0.01; ***P < 0.001; ****P < 0.0001. All values are expressed as the mean ± SEM.
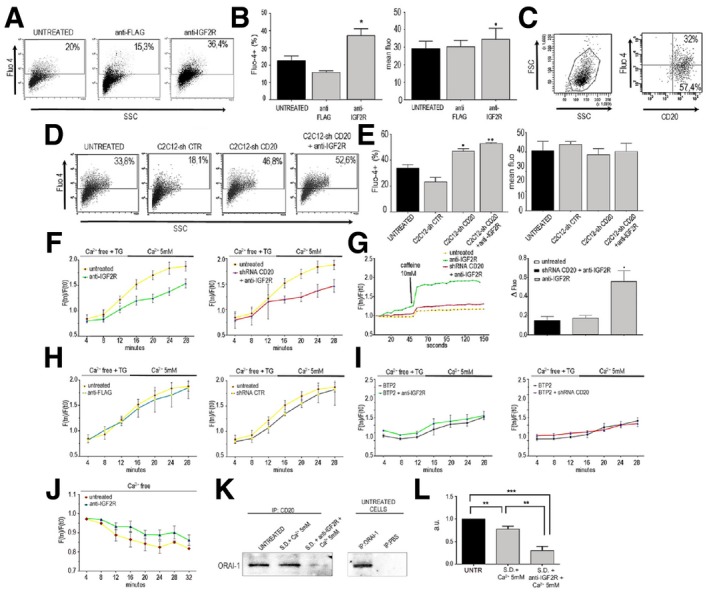
- A, B
Cytofluorimetric analysis of Ca2+ and Fluo‐4 levels in untreated and treated C2C12 myoblasts with anti‐FLAG and anti‐IGF2R (A) expressed as the percentage of positive cells and the mean fluorescence (B). One‐way ANOVA test. *P < 0.05.
- C
Forward (FSC) and side scatter (SSC) analysis of C2C12 myoblasts stained for Ca2+ with Fluo‐4 and for anti‐CD20.
- D, E
Fluo‐4 and SSC analysis of C2C12‐Sh‐empty (shCTR) cells, ShCD20‐treated C2C12 cells and shCD20 C2C12 myoblasts treated with anti‐IGF2R (D). Results are expressed as the percentage of positive cells and the mean fluorescence (E). One‐way ANOVA test. *P < 0.05; **P < 0.01.
- F
Quantification of Fluo‐4 fluorescence in untreated and shCD20‐treated C2C12 cells and C2C12 cells treated with anti‐IGF2R and anti‐FLAG in the presence of free Ca2+ and 5 mM Ca2+ measured in time‐lapse experiments over 28 min. Data are represented as the ratio of fluorescence at Tn vs. T0 over time (min).
- G
Quantification of Fluo‐4 fluorescence in untreated and anti‐IGF2R‐treated C2C12 cells and C2C12‐shCD20 cells stimulated with 10 mM caffeine and subsequently measured in time‐lapse experiments over 150 s. Data are represented as the ratio of fluorescence at Tn vs. T0 over time (min). Histograms of data expressed as delta fluorescence before and after caffeine administration. One‐way ANOVA test. *P < 0.05.
- H
Quantification of Fluo‐4 fluorescence in untreated C2C12 cells, shCD20 C2C12 cells and C2C12 cells treated with anti‐FLAG and then measured in time‐lapse experiments over 30 min without Ca2+ stimulation. Data indicate the ratio of fluorescence‐positive cells at Tn vs. T0 over time (min) and are represented as the ratio of fluorescence at Tn vs. T0 over time (min).
- I
Quantification of Fluo‐4 fluorescence in C2C12 + BTP2 cells, C2C12‐shCD20 + BTP2 cells and cells treated with anti‐IGF2R + BTP2. Results are shown measured in time‐lapse experiments performed over 30 min. Data indicate the ratio of fluorescence‐positive cells at Tn vs. T0 over time (min) and are represented as the ratio of fluorescence at Tn vs. T0 over time (min).
- J
Quantification of Fluo‐4 in untreated and anti‐IGF2R‐treated C2C12 cells. Data indicate the ratio of fluorescence‐positive cells at Tn vs. T0 over time (min) and are represented as the ratio of fluorescence at Tn vs. T0 over time (min).
- K
Representative WB of CD20 immunoprecipitation results immunoblotted for ORAI1 in untreated C2C12 cells, store‐depleted C2C12 cells and store‐depleted + anti‐IGF2R‐treated C2C12 cells. Representative WB images of ORAI1 immunoprecipitation results immunoblotted for ORAI1 as a positive control and without any specific antibody (PBS) as a negative control.
- L
Densitometry analysis of the ORAI1 signal expressed in arbitrary units. One‐way ANOVA test. **P < 0.01; ***P < 0.001.
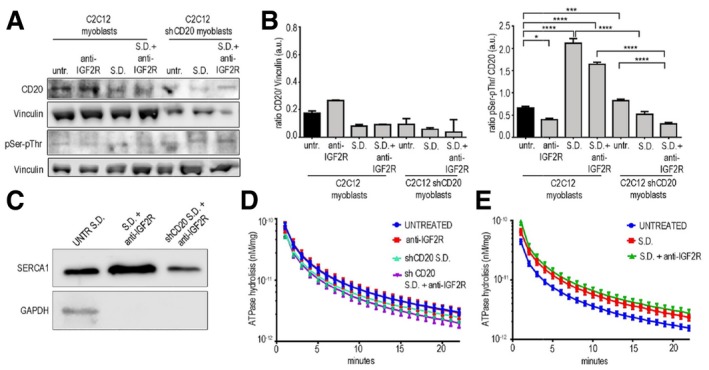
- A
Representative WB of CD20 expression and pSer/pThr phosphorylation in C2C12 cells and shCD20‐treated C2C12 myoblasts before and after treatment with anti‐IGF2R, store depletion (SD) and SD+ anti‐IGF2R.
- B
Densitometric analysis is expressed as the ratio of CD20/vinculin and pSer/pThr/CD20 in arbitrary units. Two‐way ANOVA test; *P < 0.05; ***P < 0.001; ****P < 0.0001. Each experiment was performed in triplicate wells, and all values are expressed as the mean ± SEM.
- C
Representative WB images of SERCA1 and GAPDH expression in total lysates of untreated SD C2C12 cells and ER lysates of anti‐IGF2R‐treated SD C2C12 cells and SD+ shCD20‐treated C2C12 myoblasts.
- D, E
SERCA activity was quantified as ATPase hydrolysis activity vs. min in anti‐IGF2R‐treated, SD shCD20 C2C12 cells and shCD20 C2C12 + anti‐IGF2R cells (D) and in untreated C2C12 cells and SD and SD+ anti‐IGF2R‐treated C2C12 cells (E). Each experiment was performed in triplicate wells, and all values are expressed as the mean ± SEM.
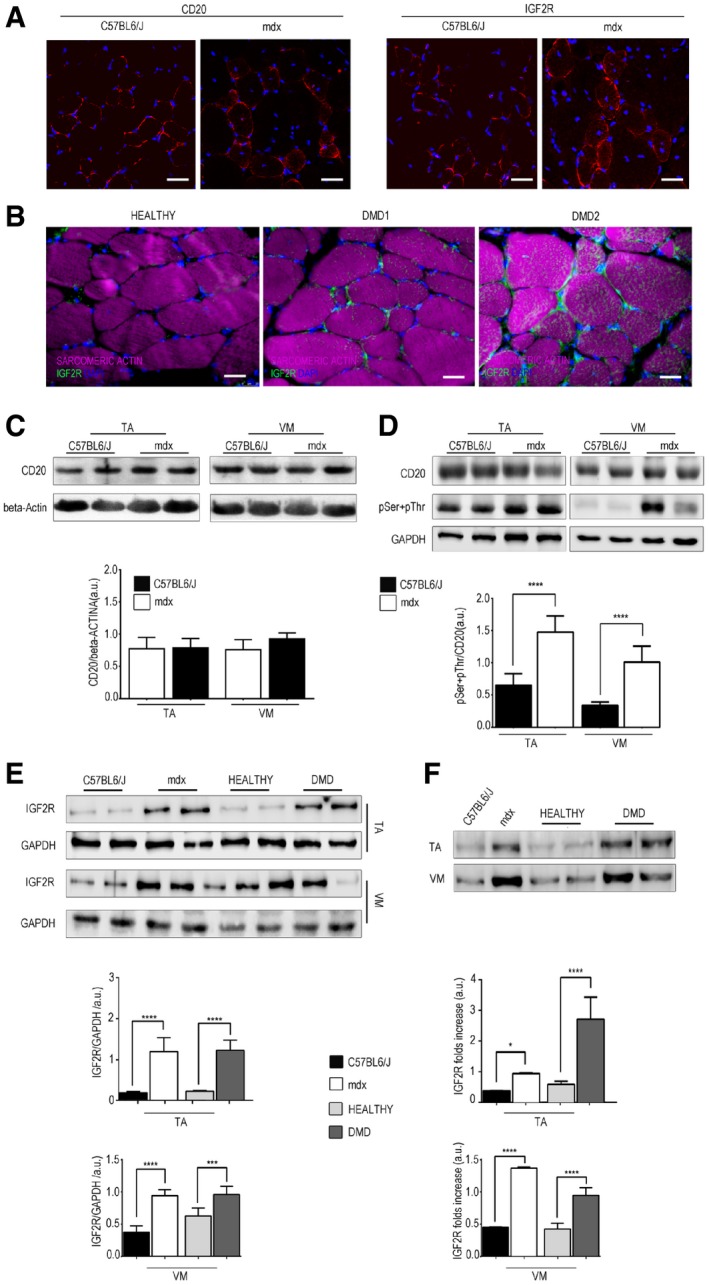
- A
Immunofluorescence analysis of CD20 and IGF2R expression (in red) in the TA muscles of three‐month‐old C57Bl6/J and mdx mice. Scale bars = 75 μm.
- B
IGF2R (green) and sarcomeric actin (magenta) expression in the VM muscles of two DMD patients. Scale bars = 25 μm.
- C, D
Representative WB analysis of CD20 and β‐actin (C) and pSer + pThr and GAPDH (D) expression in the TA and VM muscles of C57Bl6/J and mdx mice (n = 10 mice per group). Densitometry analysis of WB data is expressed as the CD20/β‐actin ratio and pSer + pThr/CD20 ratio in arbitrary units in the lower panels. One‐way ANOVA. ****P < 0.0001. All values are expressed as the mean ± SEM.
- E
Representative WB analysis of IGF2R and GAPDH expression in total protein lysates of the human (healthy and DMD) and murine (C57Bl6/J and mdx) TA and VM muscles (n = 2 per healthy and DMD; n = 10 mice per group); quantifications are expressed as the IGF2R/GAPDH ratio in arbitrary units. One‐way ANOVA. ***P < 0.001; ****P < 0.0001. All values are expressed as the mean ± SEM.
- F
Representative WB analysis of IGF2R expression in sarcolemma protein lysates of the TA and VM muscles of healthy, DMD, C57Bl6/J and mdx (n = 2 per healthy and DMD; n = 10 mice per group). Densitometry analysis of IGF2R expression, results are shown as a fold increase, as indicated in the lower panel in arbitrary units. One‐way ANOVA. *P < 0.05; ****P < 0.0001. All values are expressed as the mean ± SEM.
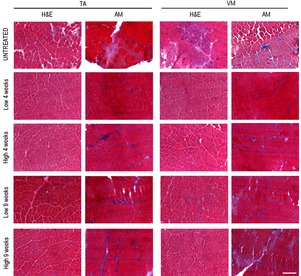
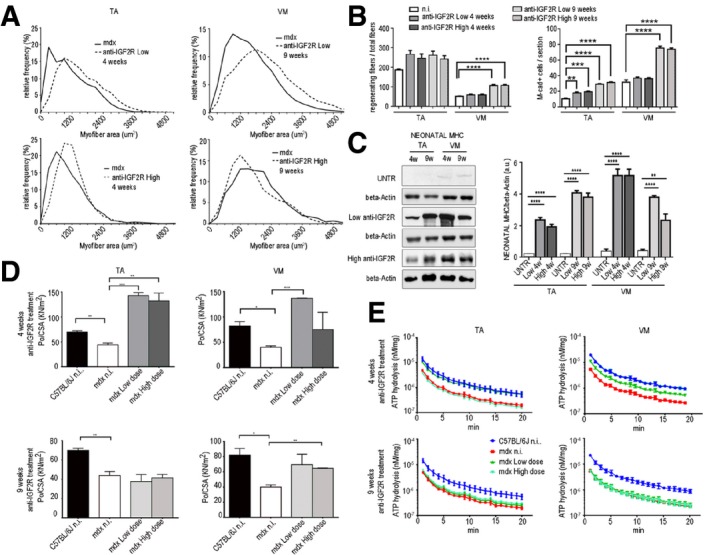
- A
Quantification of the relative frequency of myofibre cross‐sectional areas (CSAs) expressed as a frequency distribution in the TA and VM muscles of untreated mdx mice or mdx mice treated with a low or high dose of anti‐IGF2R for 4 and 9 weeks.
- B
Quantification of regenerating myofibres as a proportion of centrally nucleated fibres in the total number of fibres after anti‐IGF2R administration. The quantification of regenerating and M‐cadherin‐positive satellite cells per section is shown. One‐way ANOVA test, **P < 0.01; ***P < 0.001; ****P < 0.0001. Each experiment was performed in triplicate wells, and all values are expressed as the mean ± SEM.
- C
Representative WB analysis of neonatal myosin heavy‐chain (neonatal MHC) expression and quantification expressed as the ratio of neonatal MHC/β‐actin in untreated mdx mice and mdx mice treated with low and high doses of anti‐IGF2R for 4 and 9 weeks. One‐way ANOVA. **P < 0.01; ****P < 0.0001 (n = 10 mice per group). All values are expressed as the mean ± SEM.
- D, E
Specific force (maximal tetanic force normalized to cross‐sectional area, Po/CSA) from TA and VM muscles (D) and SERCA activity quantified as ATPase hydrolysis activity vs. min (E) in C57Bl6/J mice, untreated mdx mice and mdx mice treated with low and high doses of anti‐IGF2R for 4 and 9 weeks. One‐way ANOVA. *P < 0.05; **P < 0.01; ***P < 0.001 (n = 10 mice per group). All values are expressed as the mean ± SEM.
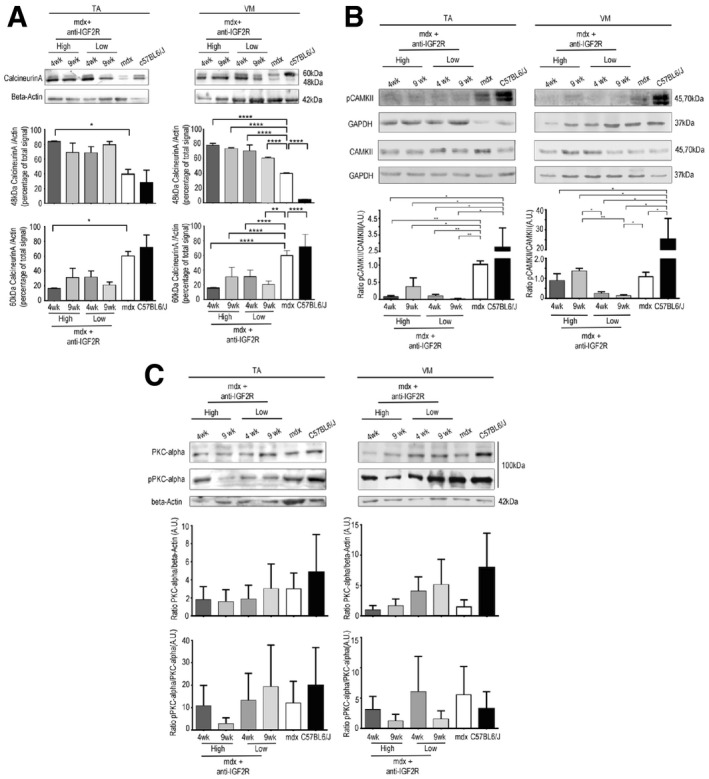
Representative WB analysis of active 48 kDa and inactive 60 kDa calcineurin A and β‐actin expression in the TA and VM muscles in untreated C57BL mice, untreated mdx mice and mdx mice treated with low and high doses of anti‐IGF2R for 4 and 9 weeks. Densitometry analysis of data expressed as ratios of 48 kDa and 60 kDa calcineurin A/β‐actin in arbitrary units. Two‐way ANOVA. *P < 0.05; **P < 0.01; ****P < 0.0001 (n = 10 mice per group). All values are expressed as the mean ± SEM.
Representative WB analysis of CAMKII, pCAMKII and GAPDH expression quantified and shown as CAMKII/GAPDH and pCAMKII/CAMKII ratios in arbitrary units. Two‐way ANOVA. *P < 0.05; **P < 0.01 (n = 10 mice per group). All values are expressed as the mean ± SEM.
Representative WB analysis of PKCα, pPKCα and β‐actin expression levels quantified and expressed as the PKCα/β‐actin and pPKCα/PKCα ratios in arbitrary units (n = 10 mice per group). All values are expressed as the mean ± SEM.
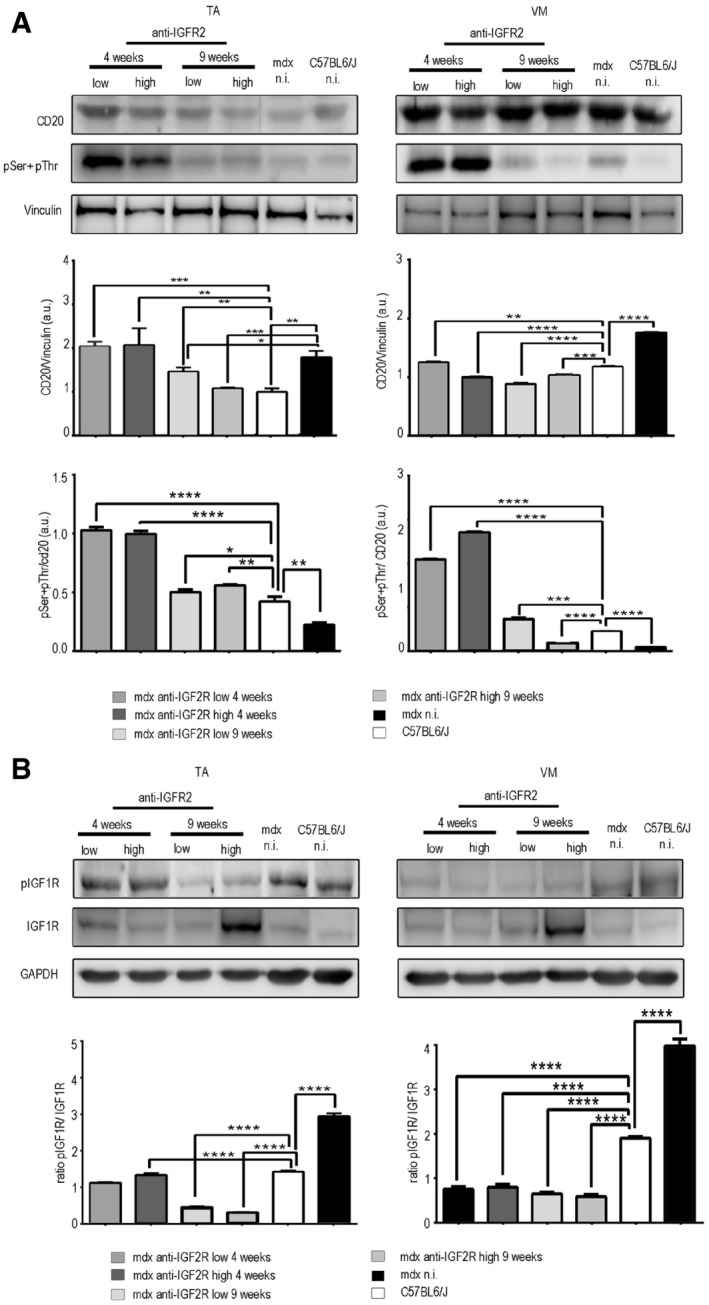
WB analysis performed in TA and VM muscles of mdx mice treated with anti‐IGF2R using antibodies against CD20, pSer + pThr and vinculin. Densitometry analysis of data expressed as the pSer + pThr/CD20 and CD20/vinculin ratio in arbitrary units. One‐way ANOVA *P < 0.05; **P < 0.01; ***P < 0.001; ****P < 0.0001 for the comparison with untreated mice (n = 10 mice per group). All values are expressed as the mean ± SEM.
Representative WB analysis performed on TA and VM muscles of mdx mice treated with anti‐IGF2R using anti‐IGF1R, anti‐phospho‐IGF1R and GAPDH. Densitometry analysis of data expressed as the pIGF1R/IGF1R ratio normalized to GAPDH content in arbitrary units. One‐way ANOVA. ****P < 0.0001 for the comparison with untreated mice (n = 10 mice per group). All values are expressed as the mean ± SEM.
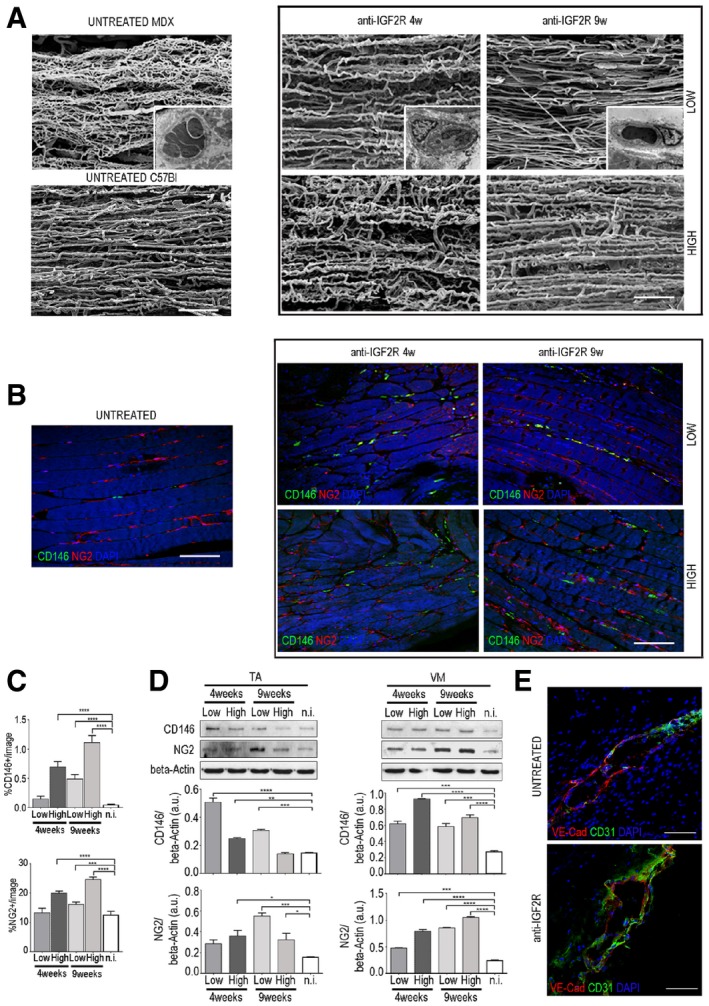
- A
Corrosion casting results showing the linearization of capillaries in IGF2R‐treated VM mdx muscles. Pericytes around capillaries are shown in the insert box. Scale bars = 100 μm.
- B, C
Representative immunofluorescence results (B) and quantification (C) of longitudinal sections of VM mdx muscles for the CD146‐ and NG2‐positive capillaries are shown. Scale bars = 75 μm. One‐way ANOVA. ***P < 0.001; ****P < 0.0001 for the comparison with untreated mice (n = 10 mice per group). All values are expressed as the mean ± SEM.
- D
Representative WB showing CD146 and NG2 expression in total protein lysates of TA and VM muscles of mdx mice treated with anti‐IGF2R. Densitometry analysis of data expressed as the ratio of the indicated antibody/β‐actin in arbitrary units. One‐way ANOVA. *P < 0.05; **P < 0.01; ***P < 0.001; ****P < 0.0001 for the comparison with untreated mice (n = 10 mice per group). All values are expressed as the mean ± SEM.
- E
Representative VE‐cadherin (red) and CD31 (green) expression in small vessels of VM muscles from untreated mdx and mdx treated with low dose of anti‐IGF2R for 4 weeks. Scale bars = 25 μm.
Similar articles
-
Alterations in Notch signalling in skeletal muscles from mdx and dko dystrophic mice and patients with Duchenne muscular dystrophy.Exp Physiol. 2014 Apr;99(4):675-87. doi: 10.1113/expphysiol.2013.077255. Epub 2014 Jan 17. Exp Physiol. 2014. PMID: 24443351
-
Skeletal Ryanodine Receptors Are Involved in Impaired Myogenic Differentiation in Duchenne Muscular Dystrophy Patients.Int J Mol Sci. 2021 Nov 30;22(23):12985. doi: 10.3390/ijms222312985. Int J Mol Sci. 2021. PMID: 34884796 Free PMC article.
-
Transplantation of Dystrophin Expressing Chimeric Human Cells of Myoblast/Mesenchymal Stem Cell Origin Improves Function in Duchenne Muscular Dystrophy Model.Stem Cells Dev. 2021 Feb;30(4):190-202. doi: 10.1089/scd.2020.0161. Epub 2021 Jan 22. Stem Cells Dev. 2021. PMID: 33349121
-
A mouse anti-myostatin antibody increases muscle mass and improves muscle strength and contractility in the mdx mouse model of Duchenne muscular dystrophy and its humanized equivalent, domagrozumab (PF-06252616), increases muscle volume in cynomolgus monkeys.Skelet Muscle. 2017 Nov 9;7(1):25. doi: 10.1186/s13395-017-0141-y. Skelet Muscle. 2017. PMID: 29121992 Free PMC article.
-
Pre-clinical evaluation of N-acetylcysteine reveals side effects in the mdx mouse model of Duchenne muscular dystrophy.J Physiol. 2017 Dec 1;595(23):7093-7107. doi: 10.1113/JP274229. Epub 2017 Sep 30. J Physiol. 2017. PMID: 28887840 Free PMC article.
Cited by
-
Unidirectional Crosstalk Between NTRK1 and IGF2 Drives ER Stress in Chronic Pain.Biomedicines. 2025 Jul 3;13(7):1632. doi: 10.3390/biomedicines13071632. Biomedicines. 2025. PMID: 40722704 Free PMC article.
-
Targeting the DP2 receptor alleviates muscle atrophy and diet-induced obesity in mice through oxidative myofiber transition.J Cachexia Sarcopenia Muscle. 2023 Feb;14(1):342-355. doi: 10.1002/jcsm.13136. Epub 2022 Dec 16. J Cachexia Sarcopenia Muscle. 2023. PMID: 36527201 Free PMC article.
-
Lineage tracing of nuclei in skeletal myofibers uncovers distinct transcripts and interplay between myonuclear populations.Nat Commun. 2024 Oct 30;15(1):9372. doi: 10.1038/s41467-024-53510-z. Nat Commun. 2024. PMID: 39477931 Free PMC article.
-
Dextrose prolotherapy at varying concentrations ameliorates tendon injury via IGF-2R: an integrated study of Mendelian randomization and an animal model.J Orthop Surg Res. 2025 Jun 2;20(1):556. doi: 10.1186/s13018-025-05977-9. J Orthop Surg Res. 2025. PMID: 40452028 Free PMC article.
-
Latent transforming growth factor binding protein-2 (LTBP2), an IPF biomarker of clinical decline, promotes TGF-beta signaling and lung fibrosis in mice.bioRxiv [Preprint]. 2025 May 11:2025.05.06.652563. doi: 10.1101/2025.05.06.652563. bioRxiv. 2025. PMID: 40654695 Free PMC article. Preprint.
References
Publication types
MeSH terms
Substances
Grants and funding
LinkOut - more resources
Full Text Sources
Other Literature Sources
Miscellaneous
