Mechanical Response of Neural Cells to Physiologically Relevant Stiffness Gradients
- PMID: 31793251
- PMCID: PMC8407326
- DOI: 10.1002/adhm.201901036
Mechanical Response of Neural Cells to Physiologically Relevant Stiffness Gradients
Abstract
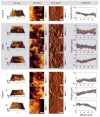
Understanding the influence of the mechanical environment on neurite behavior is crucial in the development of peripheral nerve repair solutions, and could help tissue engineers to direct and guide regeneration. In this study, a new protocol to fabricate physiologically relevant hydrogel substrates with controlled mechanical cues is proposed. These hydrogels allow the analysis of the relative effects of both the absolute stiffness value and the local stiffness gradient on neural cell behavior, particularly for low stiffness values (1-2 kPa). NG108-15 neural cell behavior is studied using well-characterized collagen gradient substrates with stiffness values ranging from 1 to 10 kPa and gradient slopes of either 0.84 or 7.9 kPa mm-1 . It is found that cell orientation is influenced by specific combinations of stiffness value and stiffness gradient. The results highlight the importance of considering the type of hydrogel as well as both the absolute value of the stiffness and the steepness of its gradient, thus introducing a new framework for the development of tissue engineered scaffolds and the study of substrate stiffness.
Keywords: mechanosensitivity; neurites; peripheral nervous system; stiffness gradients.
© 2019 The Authors. Published by WILEY-VCH Verlag GmbH & Co. KGaA, Weinheim.
Conflict of interest statement
The authors declare no conflict of interest.
Figures


Similar articles
-
Gradient Hydrogels for Optimizing Niche Cues to Enhance Cell-Based Cartilage Regeneration.Tissue Eng Part A. 2021 Jul;27(13-14):929-939. doi: 10.1089/ten.TEA.2020.0158. Epub 2020 Oct 19. Tissue Eng Part A. 2021. PMID: 32940136 Free PMC article.
-
Schwann cell durotaxis can be guided by physiologically relevant stiffness gradients.Biomater Res. 2018 May 9;22:14. doi: 10.1186/s40824-018-0124-z. eCollection 2018. Biomater Res. 2018. PMID: 29780613 Free PMC article.
-
The interplay of peptide affinity and scaffold stiffness on neuronal differentiation of neural stem cells.Biomed Mater. 2018 Feb 2;13(2):024102. doi: 10.1088/1748-605X/aa9a4b. Biomed Mater. 2018. PMID: 29133625
-
Synthetic hydrogels with stiffness gradients for durotaxis study and tissue engineering scaffolds.Tissue Eng Regen Med. 2016 Apr 5;13(2):126-139. doi: 10.1007/s13770-016-0026-x. eCollection 2016 Apr. Tissue Eng Regen Med. 2016. PMID: 30603392 Free PMC article. Review.
-
A review of gradient stiffness hydrogels used in tissue engineering and regenerative medicine.J Biomed Mater Res A. 2017 Jun;105(6):1799-1812. doi: 10.1002/jbm.a.36034. Epub 2017 Apr 3. J Biomed Mater Res A. 2017. PMID: 28187512 Review.
Cited by
-
Biomaterial and Therapeutic Approaches for the Manipulation of Macrophage Phenotype in Peripheral and Central Nerve Repair.Pharmaceutics. 2021 Dec 15;13(12):2161. doi: 10.3390/pharmaceutics13122161. Pharmaceutics. 2021. PMID: 34959446 Free PMC article. Review.
-
3D printing of functional nerve guide conduits.Burns Trauma. 2021 May 7;9:tkab011. doi: 10.1093/burnst/tkab011. eCollection 2021. Burns Trauma. 2021. PMID: 34212061 Free PMC article. Review.
-
Suggesting a mechanism for acupuncture as a global percutaneous needle fasciotomy that respects tensegrity principles for treating fibromyalgia.Front Med (Lausanne). 2023 Jan 27;9:952159. doi: 10.3389/fmed.2022.952159. eCollection 2022. Front Med (Lausanne). 2023. PMID: 36777160 Free PMC article.
-
Actuated Hydrogel Platforms To Study Brain Cell Behavior.Adv Healthc Mater. 2025 Apr;14(10):e2404484. doi: 10.1002/adhm.202404484. Epub 2025 Mar 16. Adv Healthc Mater. 2025. PMID: 40091290 Free PMC article. Review.
-
Associated changes in stiffness of collagen scaffolds during osteoblast mineralisation and bone formation.BMC Res Notes. 2022 Sep 24;15(1):310. doi: 10.1186/s13104-022-06203-z. BMC Res Notes. 2022. PMID: 36153566 Free PMC article.
References
Publication types
MeSH terms
Substances
Grants and funding
LinkOut - more resources
Full Text Sources

