. 2020 Feb;87(2):217-232.
doi: 10.1002/ana.25660. Epub 2019 Dec 27.

ASC-1 Is a Cell Cycle Regulator Associated with Severe and Mild Forms of Myopathy

Affiliations

ASC-1 Is a Cell Cycle Regulator Associated with Severe and Mild Forms of Myopathy

Rocío N Villar-Quiles et al. Ann Neurol. 2020 Feb.

Abstract

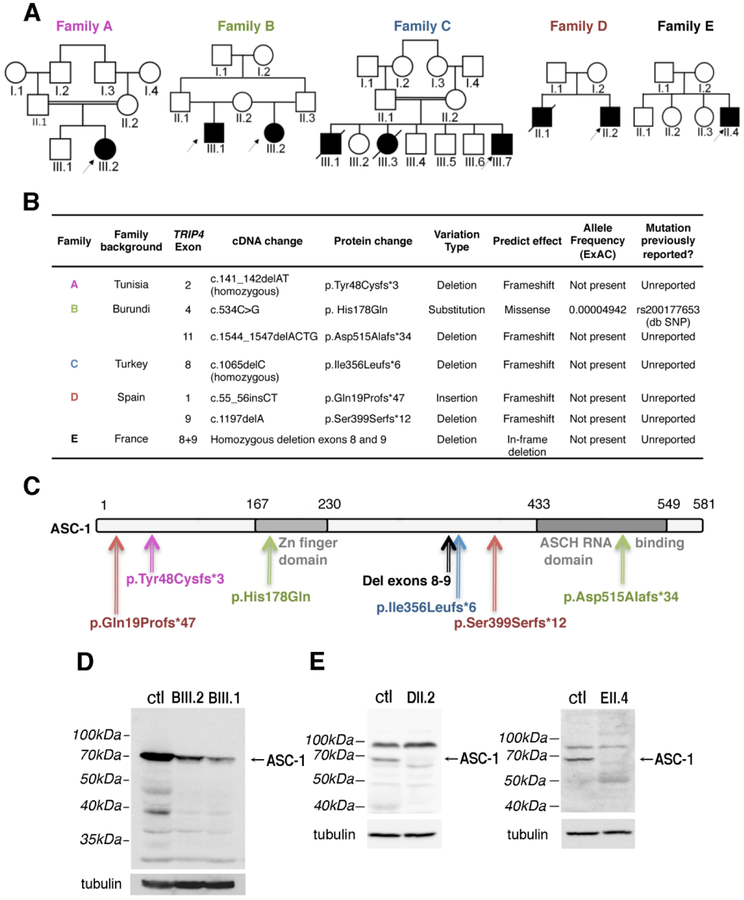
Objective: Recently, the ASC-1 complex has been identified as a mechanistic link between amyotrophic lateral sclerosis and spinal muscular atrophy (SMA), and 3 mutations of the ASC-1 gene TRIP4 have been associated with SMA or congenital myopathy. Our goal was to define ASC-1 neuromuscular function and the phenotypical spectrum associated with TRIP4 mutations.

Methods: Clinical, molecular, histological, and magnetic resonance imaging studies were made in 5 families with 7 novel TRIP4 mutations. Fluorescence activated cell sorting and Western blot were performed in patient-derived fibroblasts and muscles and in Trip4 knocked-down C2C12 cells.

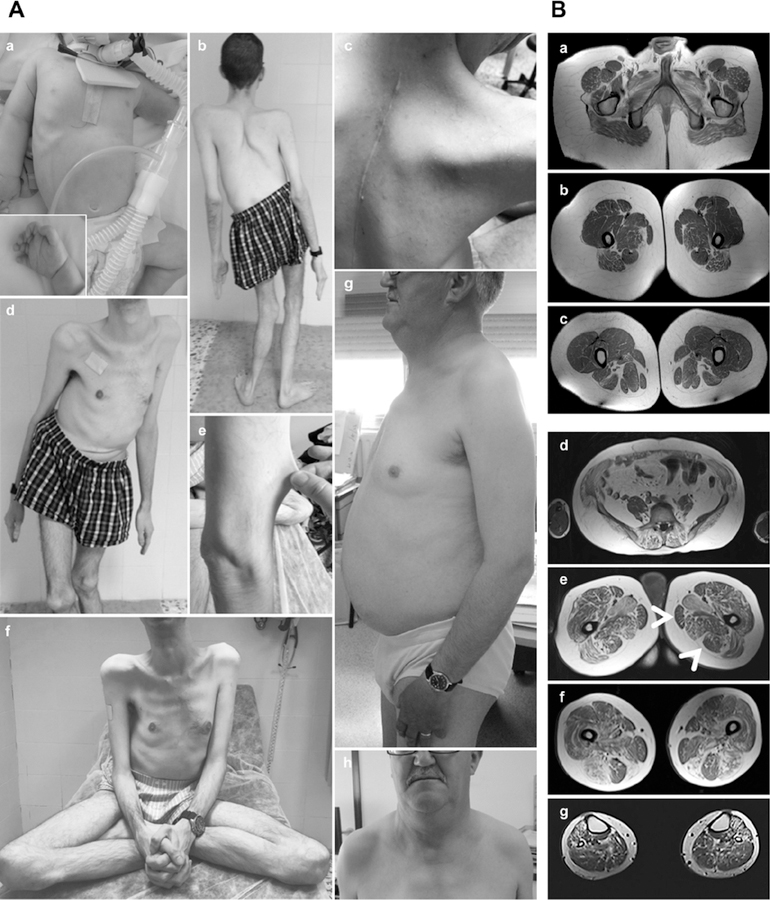
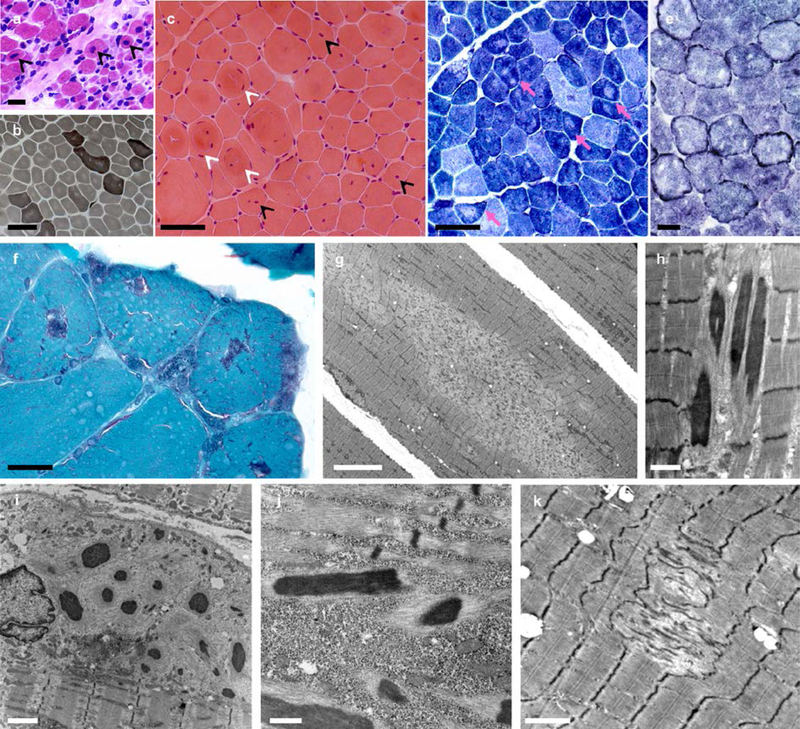
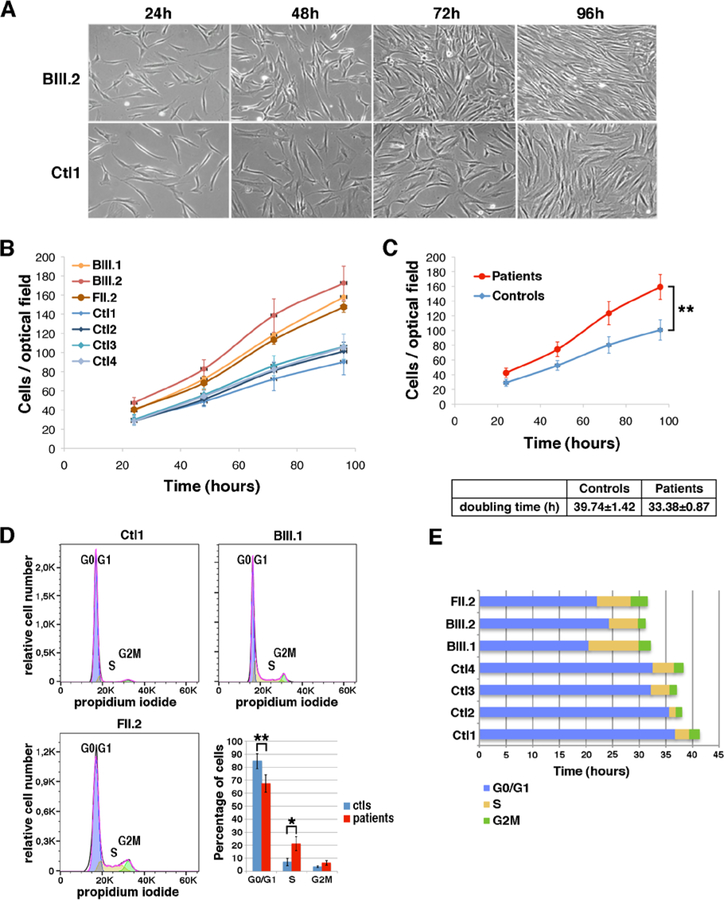
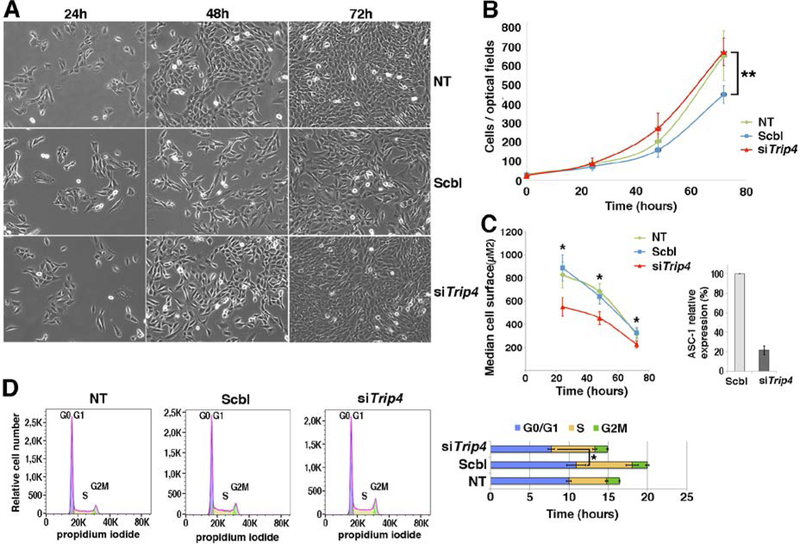
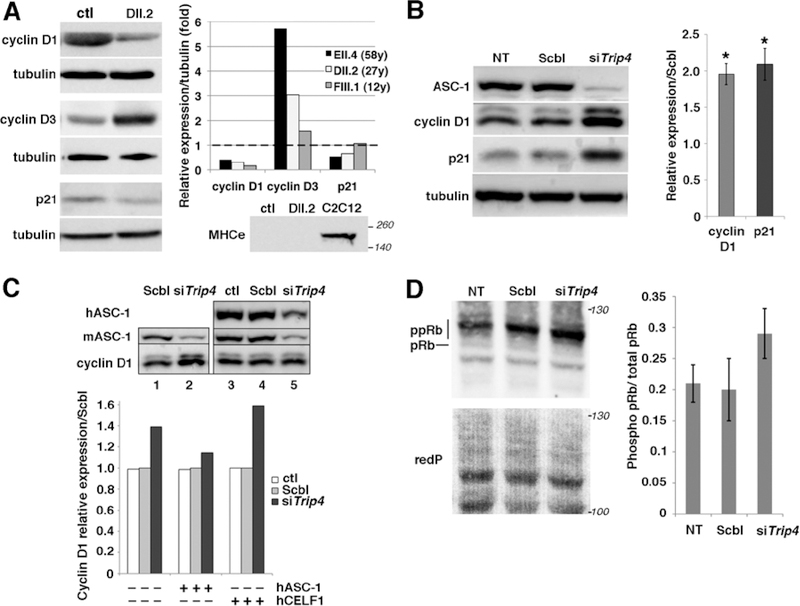
Results: All mutations caused ASC-1 protein depletion. The clinical phenotype was purely myopathic, ranging from lethal neonatal to mild ambulatory adult patients. It included early onset axial and proximal weakness, scoliosis, rigid spine, dysmorphic facies, cutaneous involvement, respiratory failure, and in the older cases, dilated cardiomyopathy. Muscle biopsies showed multiminicores, nemaline rods, cytoplasmic bodies, caps, central nuclei, rimmed fibers, and/or mild endomysial fibrosis. ASC-1 depletion in C2C12 and in patient-derived fibroblasts and muscles caused accelerated proliferation, altered expression of cell cycle proteins, and/or shortening of the G0/G1 cell cycle phase leading to cell size reduction.

Interpretation: Our results expand the phenotypical and molecular spectrum of TRIP4-associated disease to include mild adult forms with or without cardiomyopathy, associate ASC-1 depletion with isolated primary muscle involvement, and establish TRIP4 as a causative gene for several congenital muscle diseases, including nemaline, core, centronuclear, and cytoplasmic-body myopathies. They also identify ASC-1 as a novel cell cycle regulator with a key role in cell proliferation, and underline transcriptional coregulation defects as a novel pathophysiological mechanism. ANN NEUROL 2020;87:217-232.


Conflict of interest statement

POTENTIAL CONFLICTS OF INTEREST

The authors declare that they have no conflict of interest.

Figures

Fig. 1:
Fig. 1:. ASC-1 Related Myopathy phenotypical spectrum.
(A) Clinical findings in patients CIII.7 (a), DII.2 (b-f) and EII.4 (g,h). (a) Congenital presentation with neonatal hypotonia (frog position), poor limb movements and respiratory distress requiring tracheostomy and assisted ventilation. He had skin lesions, dysmorphic facial features (i.e flat face; not shown) and tapering fingers. (b-f) Patient DII.2, still ambulant at age 35 years: note severe scoliosis with dorsal lordosis and unbalanced hips (b,d), thoracic deformities (pectus excavatum) and elbow contractures (b) contrasting with prominent joint hyperlaxity (f). Dysmorphic features included large, thick neck and retrognathism and low-set ears (not shown). The skin phenotype was marked by follicular hyperkeratosis, xerosis with scratch lesions, prominent scars (but not keloid) and skin hyperelasticity (c,e). (g,h): The mildest patient (EII.4), still ambulant at 63 years, has proximal amyotrophy, pectus excavatum and dysmorphic facial features (flat face, thick neck, retrognathia). (B) Muscle imaging in two patients revealed predominant involvement of posterior thigh compartment with relative preservation of the semitendinosus muscle. (a-c): Lower limb MRI from a mild patient (BIII.1), still ambulant at age 19 years. Axial T1-weighted images showed mild muscle atrophy and fatty infiltration of glutei, iliopsoas and posterior thigh muscles with major involvement of adductor longus and relative preservation of gracillis, sartorius and semitendinosus muscles (arrows). Note marked increase in subcutaneous adipose tissue. (d-g): Muscle MRI from patient EII.4 (aged 56 years), showed the same pattern, including fatty infiltration of paravertebral muscles (d) and the posterior thigh compartment, notably gluteus maximus, adductor longus and semimembranosus (e,f). Note relative preservation of semitendinosus. Leg muscles showed diffuse involvement (g).
Fig. 2:
Fig. 2:. Spectrum of histopathological lesions.
Skeletal muscle biopsies from patients CIII.7 (a), AIII.2 (b-d, g), EII.4 (f, h-j) and DII.2 (e, k). Muscle biopsy from the most severe patient (a) showed mildly increased endomysial connective tissue, a subpopulation of very small fibers and abundant fibers with apparently normal diameter and centrally located nuclei (arrowheads). In milder patients, dystrophic features were absent and the pattern was more typical of a congenital myopathy, including FSV (b,c), internalized nuclei, often central, (c, black arrowheads), whorled fibers (c, white arrowheads) and type 1 fiber predominance (b). Intense oxidative rims beneath the sarcolemma, compatible with mitochondrial proliferation or mislocalization, were found in one patient in NADH-TR (e) and also in SDH and COX stains (not shown). There were multiple areas lacking oxidative activity (pink arrows in d) and showing mitochondrial depletion and sarcomere disorganization on EM (minicores) (g, k). Modified Gomori trichrome revealed purple stained lesions (f) which corresponded to electron-dense nemaline rods (h, j) on EM. Subsarcolemmal myofibrillar disorganization along with cytoplasmic bodies and/or subsarcolemmal rods were also observed (i). Transversal frozen sections, HE (a,c), ATPase pH 9.4 (b), NADH-TR (d,e), modified Gomori trichrome (f); electron microscopy (EM) (g-k). Scale bars= 25 µm (a,b), 50 µm (c,d), 25 µm (e,f), 10 µm (g), 1 µm (h), 2 µm (i,k), 500 nm (j).
Fig. 3:
Fig. 3:. TRIP4 mutations in the novel families.
(A) Pedigree of novel families. (B) Summary of the mutations identified. dbSNP: Single Nucleotide Polymorphism Database. ExAC: Exome Aggregation Consortium. (C) Schematic representation of the ASC-1 protein and localization of the patients’ mutations. (D-E) ASC-1 expression in patient samples. (D) Low expression of full-length ASC-1 (arrow) in fibroblasts from patients BIII.1 and BIII.2. (E) Full-length ASC-1 (arrows) was undetectable in muscle biopsies from patient DII.2 and EII.4. ctl: control fibroblasts (D), skeletal muscle control (E).
Fig. 4:
Fig. 4:. Accelerated proliferation and reduced G0/G1 phase of the cell cycle in patient fibroblasts.
(A) Bright-field pictures of control (Ctl1) and patient (BIII.2) fibroblasts cultures from 24 to 96 hours after seeding (B) proliferation curves from four control (blue) and three patient fibroblasts cultures (red). (C) Differences between the proliferation curves from control and patient cells were significant (ANOVA 3DF, *p-value<0.001). Mean population doubling time of control and patient cells was calculated for cells in exponential proliferation between 48 and 72h. (D) FACS analysis of cell cycle progression in non-synchronous proliferative control (Ctl1) or patient (BIII.1; FII.2) fibroblasts. Histogram showing the mean percentage of cells per phase in the four controls and three patients fibroblast samples (ANOVA 2DF, p-value <0.001; Tukey HSD *p-value 0.01 **p-value 0.002). (E) The duration of cell cycle phases G0/G1 (blue), S (yellow) and G2M (green) for each sample was determined as the percentage of cells in each phase multiplied by the doubling time corresponding to each sample.
Fig. 5:
Fig. 5:. Accelerated proliferation and G0/G1 phase reduction and reduced growth in Trip4KD myogenic cells.
(A) Bright-field pictures of Trip4KD C2C12 (siTrip4) compared to not treated (NT) or scramble (Scbl) transfected controls from 24 to 72 hours post siRNA transfection. (B) Proliferation curves of siTrip4, Scbl and NT cells. Overall, the proliferation curve of siTrip4 cells was higher than that from Scbl-transfected controls (ANOVA, **p-value <0.001), maintaining values comparable to non-transfected cells. Values are the mean of four independent measurements for each time per condition. Mean population doubling time (hours) was calculated for cells in exponential proliferation between 24 and 48h after transfection: NT 16.6±1, Scbl 20.1±4.4, siTrip4 15.1±1.5. (C) SiTrip4 cells exhibited a smaller cell surface (μm2) compared to NT or Scbl cells after 24, 48 or 72h of culture (Kruskal-Wallis, *p-value< 0.05). A strong ASC-1 reduction (>80%) of ASC-1 in Trip4KD cells was observed 48h after transfection. This was also observed within 48 hours with three independent siRNAs against Trip4 (data not shown). (D) FACS analysis of cell cycle in non-synchronous NT, Scbl and siTrip4 cells. Mean cell cycle distributions measured in three experiments showed a decrease in the percentage of cells in G0/G1 phase in siTrip4 condition compared to Scbl and NT (respectively 51±3.3; 54.3±6.1; 60.1±4.7), an increase in S phase (respectively 36.4±2.3; 35.6±3.9; 29.1±3.7) and in G2M (respectively 10.8±1.3; 9.64±1.1; 9.74±2.3). The duration of the cell cycle phases (±SEM), G0/G1 (blue), S (yellow) and G2M (green), was determined as mentioned in Fig. 4 (ANOVA *p-value <0.05). A parallel increase in the number of cells in S phase in both Scbl and siTrip4 samples could be explained by the stress induced by transfection.
Fig. 6:
Fig. 6:. Altered expression of cell cycle proteins in patient muscles and in Trip4KD myogenic cells.
(A) Western blot of lysates from control (ctl) and three patient frozen muscles revealed altered expression of cyclins D1 and D3 as well as p21 in patients DII.2 (left panel), EII.4 and FIII.1 (right panel, control expression normalized to 1, dashed line). Absence of embryonic myosin (MHCe) in both patient DII.2 and control muscle samples excluded that this might be due to active muscle regeneration (including the presence of immature myofibers) in patients (lower panel, C2C12 used as a positive control). (B) Increased cyclin D1 and p21 expression in Trip4KD C2C12 with <20% ASC-1 residual expression (data not shown) compared to non-transfected cells (NT) or cells transfected with siRNA control (Scbl) (left and right panel, normalized to Scbl transfected cells; Mann–Whitney U, *p-value <0.05). (C) Rescue of the altered levels of cyclin D1 in Trip4KD C2C12 by wild-type human ASC-1. Western blot of protein extracts from Scbl (lanes 1 and 4), siTrip4 (lanes 2 and 5) or ctl C2C12 (lane 3) double-transfected with hASC-1 (lanes 3–5) 24h after endogenous ASC-1 silencing (upper panel). Quantification of the relative expression of cyclin D1 over tubulin (normalized for Scbl) in ctl, Scbl and siTrip4 cells in the presence or absence of hASC-1. A vector expressing hCelf1 was used as a non-specific control (lower panel). mASC-1= murine endogenous ASC-1; hASC-1 = human ectopic ASC-1; hCelf1 = human ectopic Celf1. (D) Western blot analysis of pRb phosphorylation state in NT, Scbl and siTrip4 cells revealed a fast migrating band corresponding to the hypo-phosphorylated form of Rb (pRb, 110 kDa) and slower migrating bands corresponding to hyper-phosphorylated forms of Rb (ppRb, 116kDa) (left panel). Red ponceau (redP) staining of the membrane showed similar loading in each condition. In all conditions, the hyper-phosphorylated forms of Rb were predominant compared to the hypo-phosphorylated form as expected for cycling cells. Although variability precluded reaching statistical significance, quantification of the ratio ppRb/total pRb for each condition (N=4) showed an increase by nearly 50% of hyper-phosphorylated forms in siTrip4 cells (right panel).

References

    1. North KN, Wang CH, Clarke N, et al. Approach to the diagnosis of congenital myopathies. 2017;24(2):97–116. - PMC - PubMed
    1. Schorling D, Kirschner J, Bönnemann C. Congenital Muscular Dystrophies and Myopathies: An Overview and Update [Internet]. Neuropediatrics 2017;48(4):247–261. - PubMed
    1. Wang CH, Quijano-roy S, Deconinck N, et al. Diagnostic approach to the congenital muscular dystrophies. HHS Public Access, Neuromuscul Disord 2017;24(4):289–311. - PMC - PubMed
    1. Jungbluth H, Ochala J, Treves S, Gautel M. Current and future therapeutic approaches to the congenital myopathies. Semin. Cell Dev. Biol. 2017;64:191–200. - PubMed
    1. Kaplan J-C, Hamroun D. The 2016 version of the gene table of monogenic neuromuscular disorders (nuclear genome). Neuromuscul. Disord 2015;25(12):991–1020. - PubMed

Publication types

MeSH terms