. 2019:24:102046.
doi: 10.1016/j.nicl.2019.102046. Epub 2019 Oct 18.

EEG time signature in Alzheimer´s disease: Functional brain networks falling apart

Affiliations

EEG time signature in Alzheimer´s disease: Functional brain networks falling apart

Una Smailovic et al. Neuroimage Clin. 2019.

Abstract

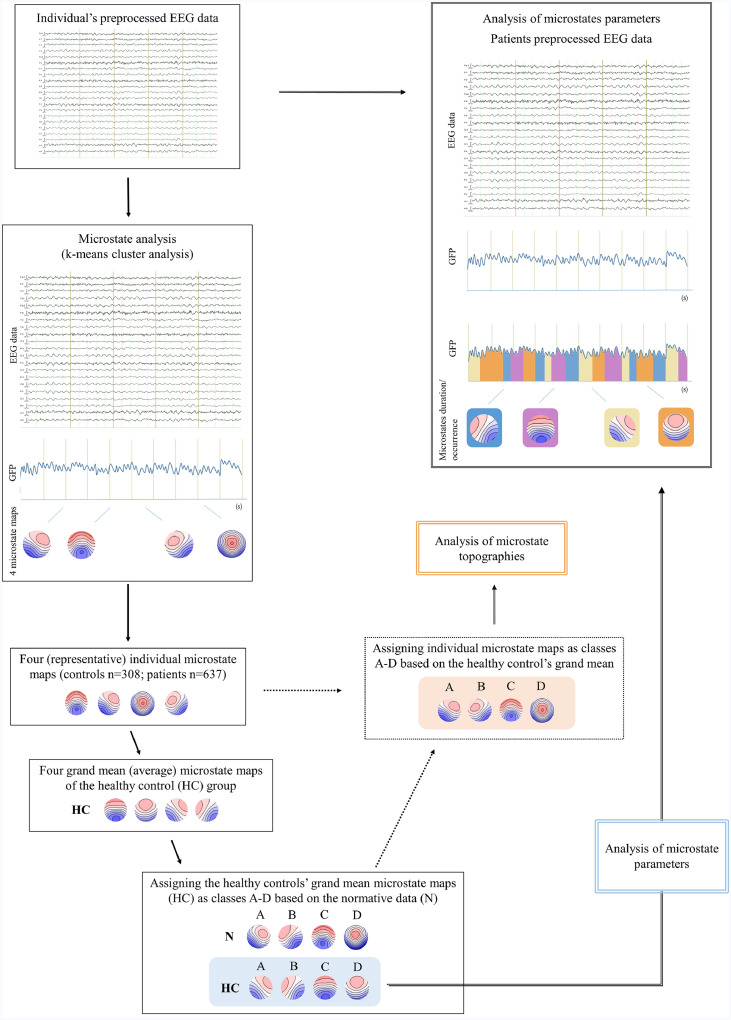
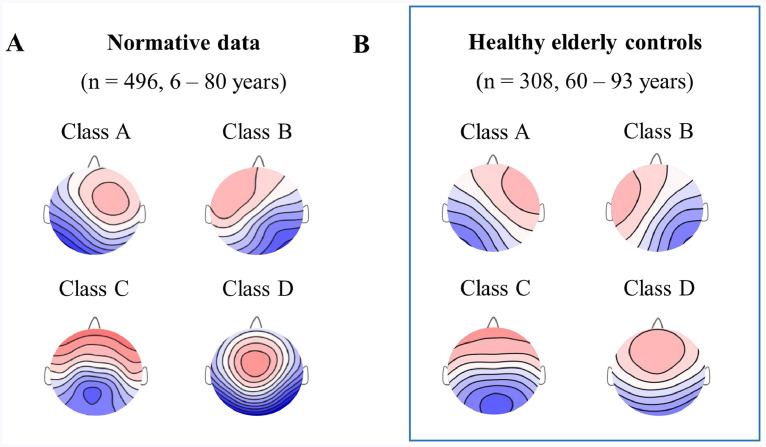
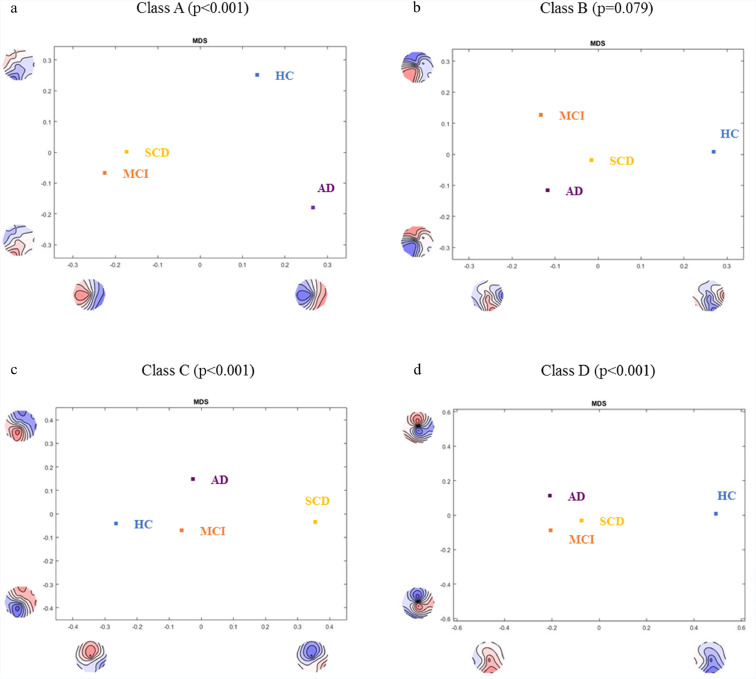
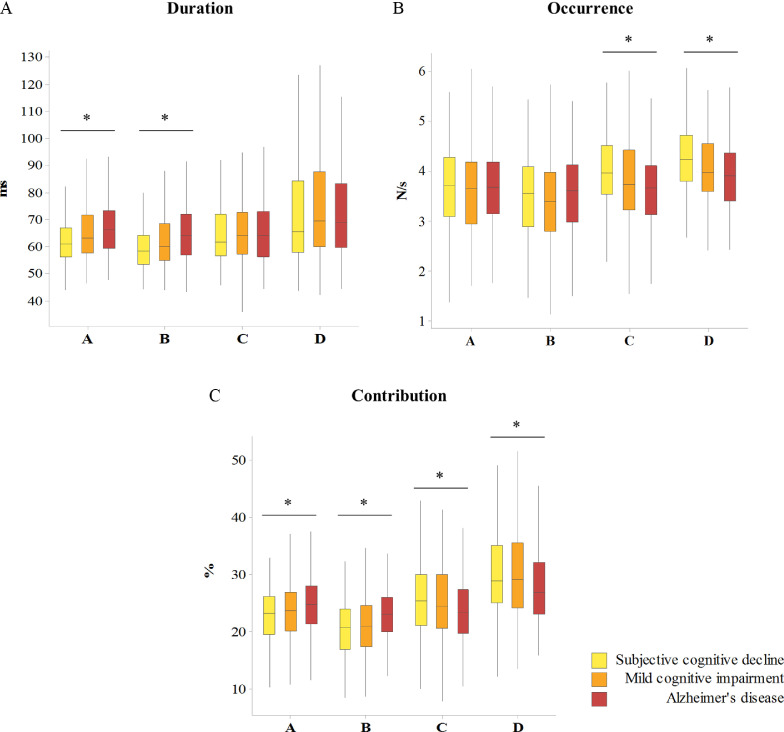
Spontaneous mental activity is characterized by dynamic alterations of discrete and stabile brain states called functional microstates that are thought to represent distinct steps of human information processing. Electroencephalography (EEG) directly reflects functioning of brain synapses with a uniquely high temporal resolution, necessary for investigation of brain network dynamics. Since synaptic dysfunction is an early event and best correlate of cognitive status and decline in patients along Alzheimer's disease (AD) continuum, EEG microstates might serve as valuable early markers of AD. The present study investigated differences in EEG microstate topographies and parameters (duration, occurrence and contribution) between a large cohort of healthy elderly (n = 308) and memory clinic patients: subjective cognitive decline (SCD, n = 210); mild cognitive impairment (MCI, n = 230) and AD (n = 197) and how they correlate to conventional cerebrospinal fluid (CSF) markers of AD. Four most representative microstate maps assigned as classes A, B (asymmetrical), C and D (symmetrical) were computed from the resting state EEGs since it has been shown previously that this is sufficient to explain most of the resting state EEG data. Statistically different topography of microstate maps were found between the controls and the patient groups for microstate classes A, C and D. Changes in the topography of microstate class C were associated with the CSF Aβ42 levels, whereas changes in the topography of class B were linked with the CSF p-tau levels. Gradient-like increase in the contribution of asymmetrical (A and B) and gradient-like decrease in the contribution of symmetrical (C and D) maps were observed with the more severe stage of cognitive impairment. Our study demonstrated extensive relationship of resting state EEG microstates topographies and parameters with the stage of cognitive impairment and AD biomarkers. Resting state EEG microstates might therefore serve as functional markers of early disruption of neurocognitive networks in patients along AD continuum.

Keywords: Alzheimer's disease; Biomarkers; Cerebrospinal fluid; Electroencephalography; Functional microstates.


Conflict of interest statement

The authors declare no conflict of interest.

Figures

Fig 1
Fig. 1
Steps of the EEG microstate analysis. The analysis started with the individual's preprocessed EEG that was subjected to the spatial k-means cluster analysis. The cluster analysis yielded four most representative microstate maps per individual. The next step involved computation of the average or grand mean microstate maps of the healthy elderly group (n = 308). The four healthy grand mean maps were then assigned as class A–D based on the similarity to the maps from the normative study. Following the same sorting procedure, the four individual microstate maps of both healthy controls and patients were assigned (sorted) as class A–D based on the similarity to the four healthy grand mean maps. Finally, sorted and assigned individual microstate maps (orange area) were used for the analysis of their topographical differences between the groups. The healthy controls’ grand mean maps (blue area) were further used for the computation of microstate parameters (duration, occurrence and contribution) in the original preprocessed patients’ EEG data. HC = grand mean microstate maps of healthy elderly controls, N = average (representative) microstates maps from the normative data (Koenig et al., 2002). (For interpretation of the references to color in this figure legend, the reader is referred to the web version of this article.)
Fig 2
Fig. 2
Microstate maps of the healthy population. Grand mean microstate maps of the (A) Normative data that included 496 controls aged 6 to 80 years but only 26 subjects above the age of 50 (Koenig et al., 2002), (B) Healthy elderly controls included in the present study (n = 308) aged between 60 and 93 years.
Fig 3
Fig. 3
Analysis of topographical differences in microstate maps. TANOVA of the individual microstate topographies between Controls, SCD, MCI and AD for the microstate class A (a), B (b), C (c) and D (d). The figure displays between-group spatial comparison of each microstate class that has been fed into a multidimensional scaling (MDS) analysis. MDS analysis downscales high-dimensional result spaces into lower dimensional ones by subjecting all mean group maps to the spatial principal component analysis (PCA) that allows visualization of the data. The maps shown on the x- and y-axes represent PCA eigenvector maps. Each group point on the graph is therefore represented in a way that groups with similar topographies will be found at closer whereas groups with dissimilar topographies will be found at the greater mutual distance. HC = healthy elderly controls, SCD = subjective cognitive decline, MCI = mild cognitive impairment, AD = Alzheimer's disease.
Fig 4
Fig. 4
Gradient-like differences in microstate parameters between memory clinic patient groups. Microstate duration (A), occurrence (B) and contribution (C) between subjective cognitive decline, mild cognitive impairment and Alzheimer's disease patients, using the average (grand mean) maps of the healthy control group for computation. Different bar colors present different diagnostic groups. The interquartile range is presented by the box; the median by the solid line; lower and upper 25% of distribution are presented by whiskers. Kruskal–Wallis test over the diagnostic groups. *p < 0.05.

References

    1. Badhwar A, Tam A, Dansereau C, Orban P, Hoffstaedter F, Bellec P. Resting-state network dysfunction in Alzheimer's disease: a systematic review and meta-analysis. Alzheimer's & dementia: diagnosis. Assess. Dis. Monitor. 2017;8:73–85. - PMC - PubMed
    1. Bartzokis G. Age-related myelin breakdown: a developmental model of cognitive decline and Alzheimer’s disease. Neurobiol Aging. 2004;25(1):5–18. - PubMed
    1. Blennow K. A Review of Fluid Biomarkers for Alzheimer's disease: moving from CSF to blood. Neurol. Therapy. 2017;6(Suppl 1):15–24. - PMC - PubMed
    1. Blennow K, Hampel H, Weiner M, Zetterberg H. Cerebrospinal fluid and plasma biomarkers in Alzheimer disease. Nat. Rev. Neurol. 2010;6(3):131–144. - PubMed
    1. Braak E., Griffing K., Arai K., Bohl J., Bratzke H., Braak H. Neuropathology of Alzheimer’s disease: what is new since A. Alzheimer? Eur Arch Psychiatry Clin Neurosci. 1999;249(3):14–22. - PubMed

Publication types