

Bias-adjustment in neuroimaging-based brain age frameworks: A robust scheme
- PMID: 31795063
- PMCID: PMC6861562
- DOI: 10.1016/j.nicl.2019.102063
Bias-adjustment in neuroimaging-based brain age frameworks: A robust scheme
Abstract
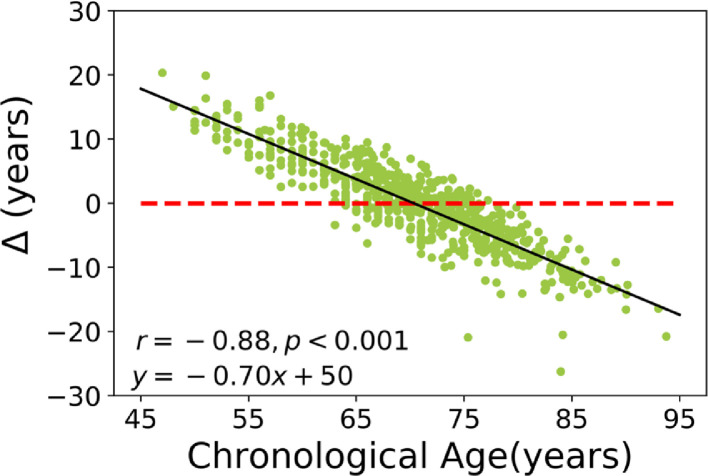
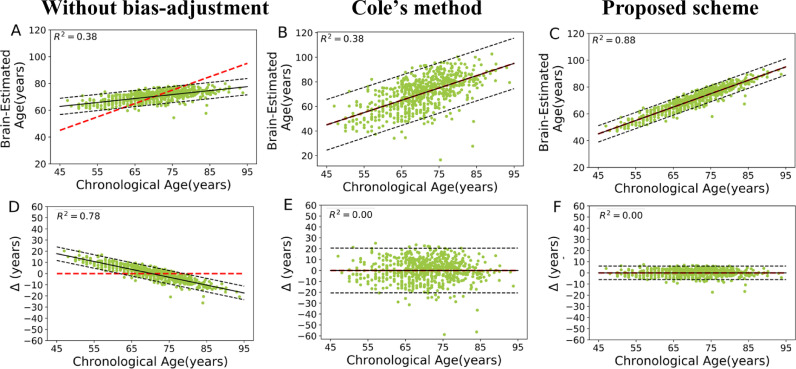
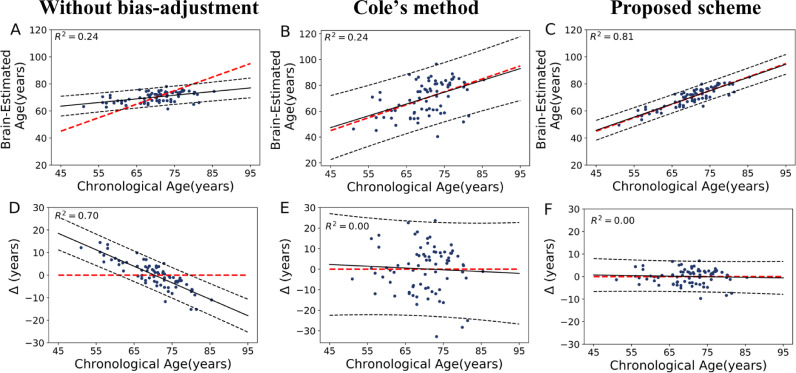
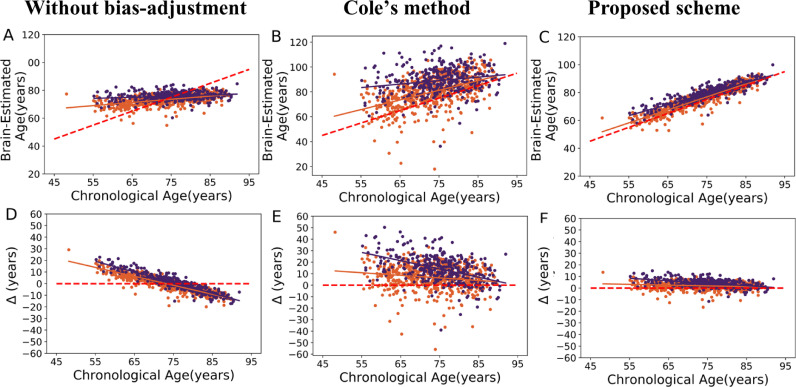
The level of prediction error in the brain age estimation frameworks is associated with the authenticity of statistical inference on the basis of regression models. In this paper, we present an efficacious and plain bias-adjustment scheme using chronological age as a covariate through the training set for downgrading the prediction bias in a Brain-age estimation framework. We applied proposed bias-adjustment scheme coupled by a machine learning-based brain age framework on a large set of metabolic brain features acquired from 675 cognitively unimpaired adults through fluorodeoxyglucose positron emission tomography data as the training set to build a robust Brain-age estimation framework. Then, we tested the reliability of proposed bias-adjustment scheme on 75 cognitively unimpaired adults, 561 mild cognitive impairment patients as well as 362 Alzheimer's disease patients as independent test sets. Using the proposed method, we gained a strong R2 of 0.81 between the chronological age and brain estimated age, as well as an excellent mean absolute error of 2.66 years on 75 cognitively unimpaired adults as an independent set; whereas an R2 of 0.24 and a mean absolute error of 4.71 years was achieved without bias-adjustment. The simulation results demonstrated that the proposed bias-adjustment scheme has a strong capability to diminish prediction error in brain age estimation frameworks for clinical settings.
Keywords: Bias-adjustment; Brain age; Brain metabolism; Estimation; Pet.
Copyright © 2019 The Authors. Published by Elsevier Inc. All rights reserved.
Figures
Comment in
-
Commentary: Correction procedures in brain-age prediction.Neuroimage Clin. 2020;26:102229. doi: 10.1016/j.nicl.2020.102229. Epub 2020 Feb 24. Neuroimage Clin. 2020. PMID: 32120292 Free PMC article. No abstract available.
References
-
- Beheshti I., Gravel P., Potvin O., Dieumegarde L., Duchesne S. A novel patch-based procedure for estimating brain age across adulthood. Neuroimage. 2019;197:618–624. - PubMed
-
- Boyle R., Jollans L., Rueda-Delgado L.M., Rizzo R., Yener G.G., McMorrow J.P., Knight S.P., Carey D., Robertson I.H., Emek-Savas D.D., Stern Y., Kenny R.A.M., Whelan R. Brain-predicted age difference score is related to specific cognitive functions: a multi-site replication analysis. bioRxiv. 2019 - PMC - PubMed
-
- Cole J.H., Annus T., Wilson L.R, Remtulla R, Hong Y.T, Fryer T.D, Acosta-Cabronero J, Cardenas-Blanco A, Smith R., Menon D.K, Zaman S.H, Nestor P.J., Holland A.J. Brain-predicted age in down syndrome is associated with beta amyloid deposition and cognitive decline. Neurobiol. Aging. 2017;56:41–49. - PMC - PubMed
Publication types
MeSH terms
LinkOut - more resources
Full Text Sources
