. 2019 Nov 29;8(12):1544.
doi: 10.3390/cells8121544.

Platyconic Acid A, Platycodi Radix-Derived Saponin, Suppresses TGF-1-induced Activation of Hepatic Stellate Cells via Blocking SMAD and Activating the PPAR Signaling Pathway

Affiliations

Platyconic Acid A, Platycodi Radix-Derived Saponin, Suppresses TGF-1-induced Activation of Hepatic Stellate Cells via Blocking SMAD and Activating the PPAR Signaling Pathway

Jae Ho Choi et al. Cells. .

Abstract

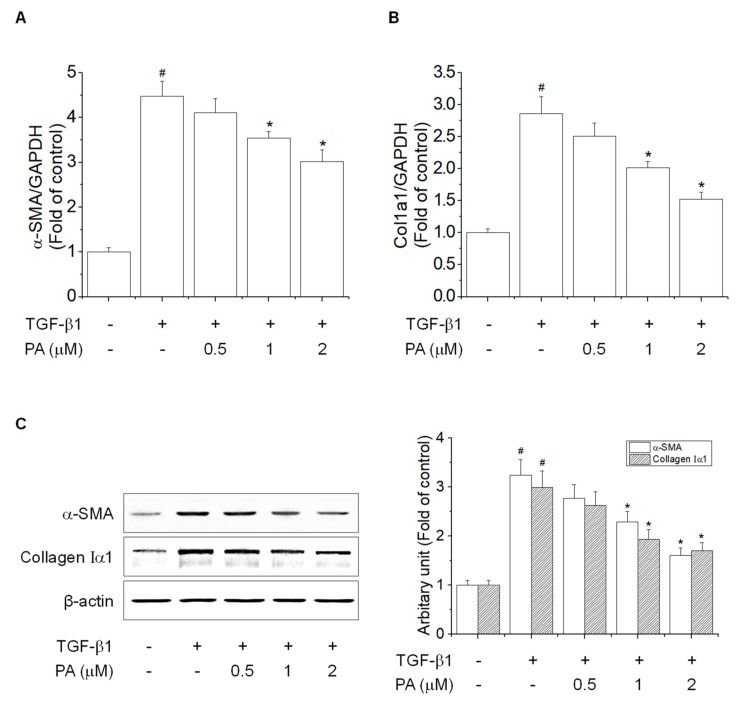
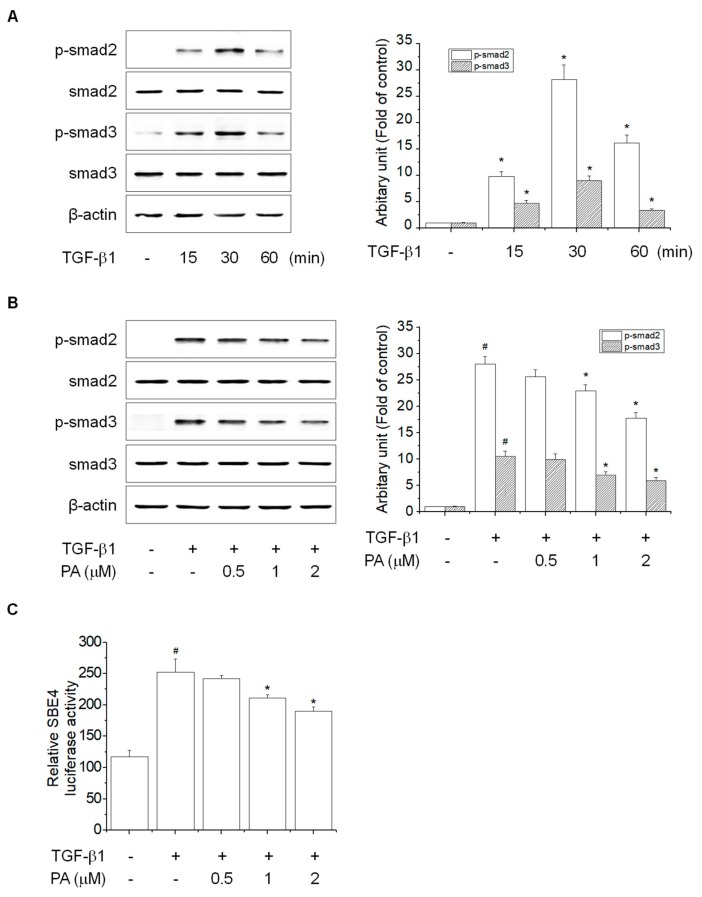
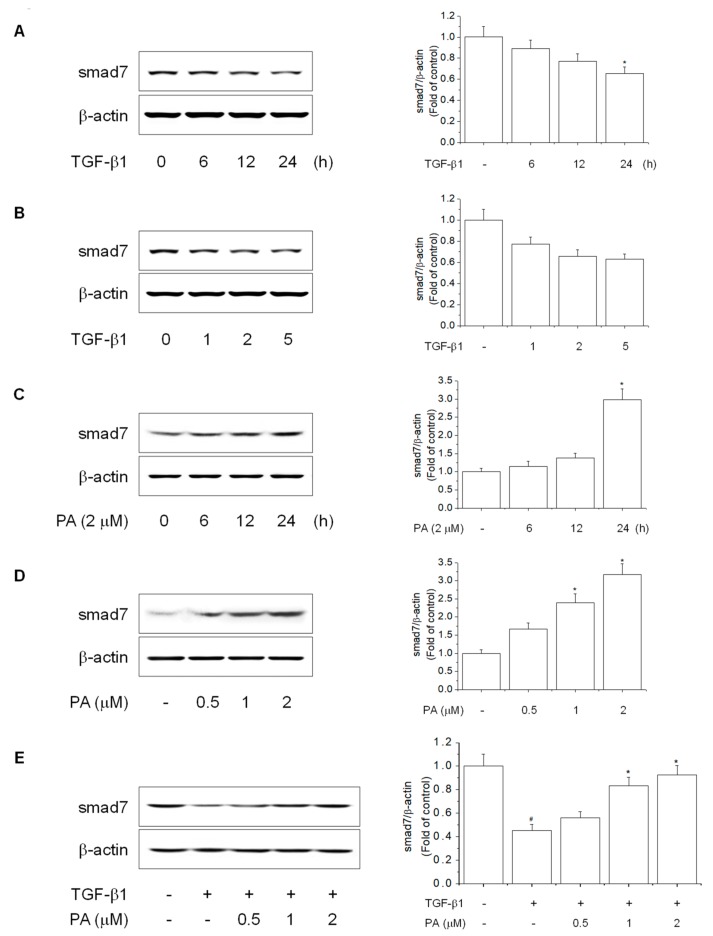
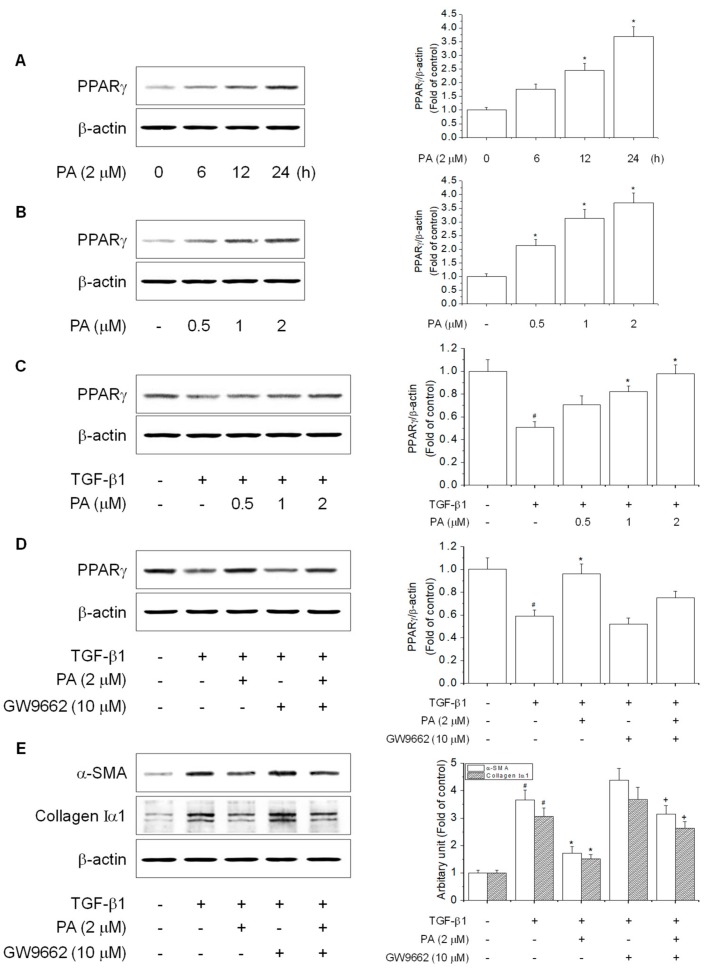
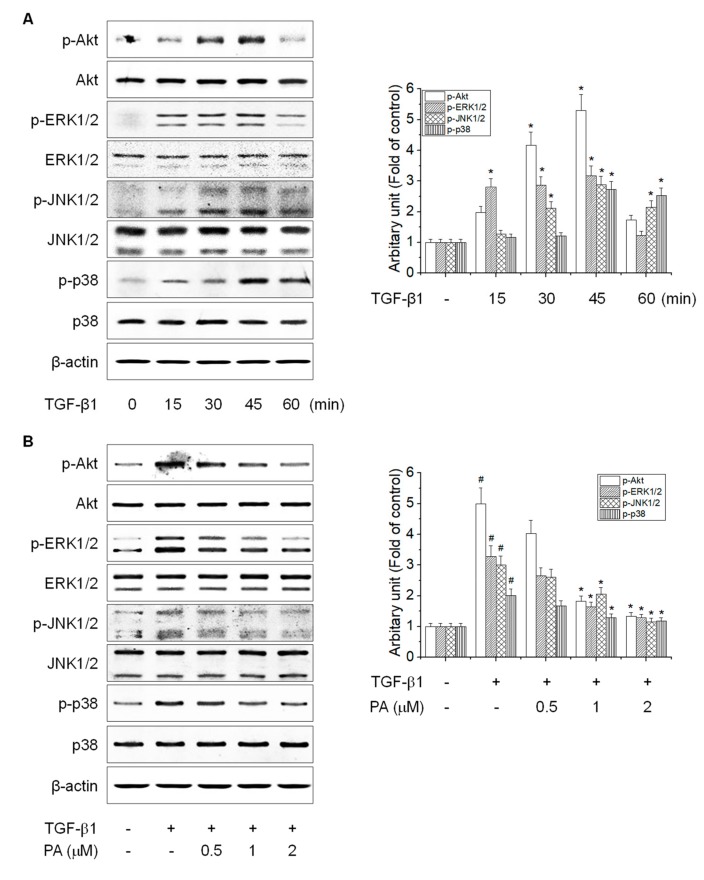
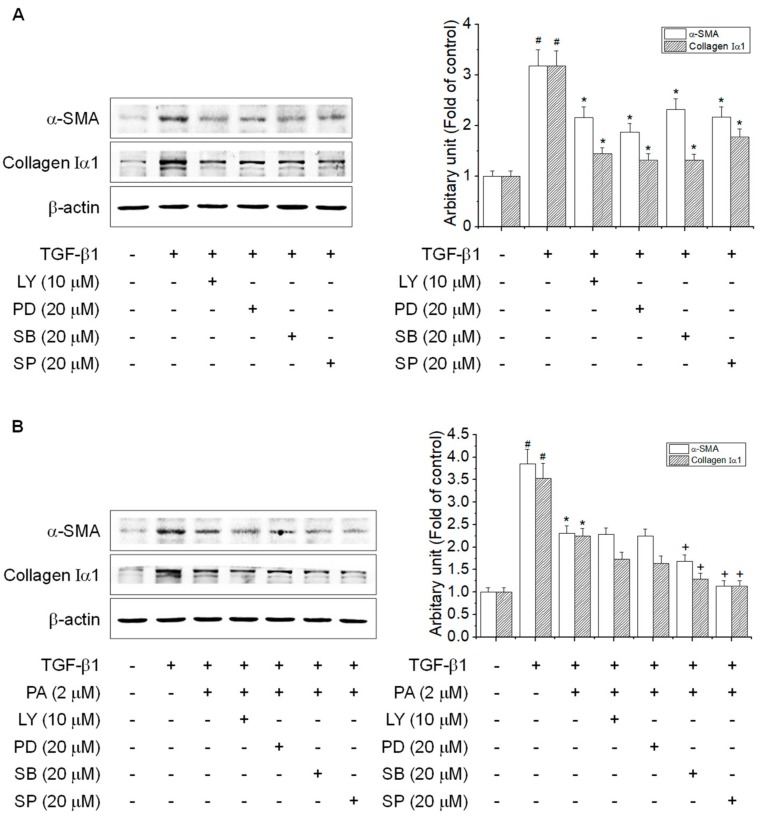
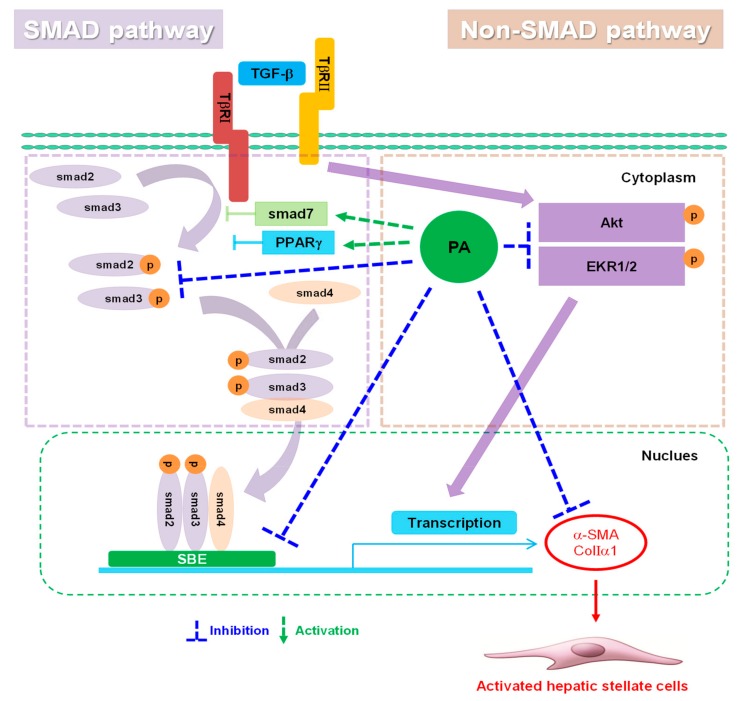
Platycodi radix is a widely sold health food worldwide, which contains numerous phytochemicals that are beneficial to health. Previously, we reported that saponin from the roots of Platycodi radix-derived saponin inhibited toxicant-induced liver diseases. Nevertheless, the inhibitory effect of platyconic acid A (PA), the active component of Platycodi radix-derived saponin, on the anti-fibrotic activity involving the SMAD pathway remains unclear. We investigated the inhibitory effects of PA on TGF-1-induced activation of hepatic stellate cells (HSCs). PA inhibited TGF-1-enhanced cell proliferation, as well as expression of -SMA and collagen 1 in HSC-T6 cells. PA suppressed TGF-1-induced smad2/3 phosphorylation and smad binding elements 4 (SBE4) luciferase activity. Reversely, PA restored TGF-1-reduced expression of smad7 and peroxisome proliferator-activated receptor (PPAR)γ. PA also repressed TGF-1-induced phosphorylation of Akt and MAPKs. In summary, the results suggest that the inhibitory effect of PA on HSCs occurs through the blocking of SMAD-dependent and SMAD-independent pathways, leading to the suppression of -SMA and collagen 1 expression.

Keywords: PPARγ; SMAD; TGF-1; hepatic stellate cells; platyconic acid A.


Conflict of interest statement

The authors declare no conflict of interest.

Figures

Figure 1
Figure 1
The effects of platyconic acid A (PA) on TGF-β1-induced cell proliferation in HSC-T6 cells. (A) The chemical structure of PA; (B,C) the effect of PA on viability and cytotoxicity in rat hepatic stellate cells (HSCs). Cells were treated with various concentrations of PA at 37 °C for 24 h, and cell viability was determined using the MTT assay, while cell cytotoxicity was analyzed using the LDH assay. The results are expressed as the means ± SD of three independent experiments. * Significantly different from the control (p < 0.01); (D) the inhibitory effect of PA on TGF-β1-induced cell proliferation in rat HSCs. Cells were pretreated with 0.5, 1, and 2 μM PA for 1 h, and then stimulated with TGF-β1 (5 ng/mL) for 24 h. Cell proliferation was determined using the WST-1 assay. The results are expressed as the means ± SD of three independent experiments. # Significantly different from the control (p < 0.01). * Significantly different from the TGF-β1-treated group (p < 0.01).
Figure 2
Figure 2
The effects of PA on TGF-β1-induced α- SMA and collagen Iα1 expression in HSC-T6 cells. (A,B) The inhibitory effect of PA on TGF-β1-induced α-SMA and collagen type I mRNA and protein expression in rat hepatic stellate cells. Cells were pretreated with 0.5, 1, and 2 μM PA for 1 h, and then stimulated with TGF-β1 (5 ng/mL) for 24 h. Total RNA extracted from cells was analyzed by the real-time polymerase chain reaction to determine α-SMA and ColIa1 mRNA expression; (C) the total protein extracted from cells was subjected to Western blotting to determine α-SMA and collagen Iα1 expression. Protein bands were imaged using densitometry and analyzed using ImageJ software. The relative expression levels of target proteins were normalized using β-actin as an internal control. The results are expressed as the means ± SD of three independent experiments. # Significantly different from the control (p < 0.01). * Significantly different from the TGF-β1-treated group (p < 0.01).
Figure 3
Figure 3
The effects of PA on the TGF-β1-induced SMAD signal pathway in HSC-T6 cells. (A) The effect of TGF-β1-induced smad2 and smad3 phosphorylation in rat hepatic stellate cells (HSCs). Cells were treated with TGF-β1 (5 ng/mL) for 0, 15, 30, and 60 min, and smad2 and smad3 phosphorylation was analyzed by Western blotting; (B) the inhibitory effect of PA on TGF-β1-induced smad2 and smad3 phosphorylation in rat HSCs. Cells were pretreated with 0.5, 1, and 2 μM PA for 1 h, and then stimulated with TGF-β1 (5 ng/mL) for 30 min. The total protein extracted from cells was subjected to Western blotting to assess smad2 and smad3 phosphorylation. Protein bands were imaged using densitometry and analyzed using ImageJ software. The relative phosphorylation levels of target proteins were normalized using β-actin as an internal control; (C) the inhibitory effect of PA on TGF-β1-induced SBE4 luciferase activity in rat HSCs. Cells were transiently transfected with luciferase reporter containing four copies of the smad binding element sites (SBE4), cultured with PA (0.5, 1, and 2 μM) and/or TGF-β1 (5 ng/mL) for 24 h, and the relative luciferase activity in the cell extract was determined. The results are expressed as the means ± SD of three independent experiments. # Significantly different from the control (p < 0.01). * Significantly different from the TGF-β1-treated group (p < 0.01).
Figure 4
Figure 4
The effects of PA on TGF-β1-reduced smad7 expression in HSC-T6 cells. (A,B) The effect of TGF-β1-reduced smad7 expression in rat hepatic stellate cells (HSCs). Cells were treated with TGF-β1 (5 ng/mL) for 0, 6, 12, and 24 h or TGF-β1 (1, 2, and 5 ng/mL) for 24 h, and smad7 expression was analyzed by Western blotting; (C,D) the effect of PA-induced smad7 expression in rat HSCs. Cells were treated with PA (2 μM) for 0, 6, 12, and 24 h or PA (0.5, 1, and 2 μM) for 24 h, and smad7 expression was analyzed by Western blotting; (E) the effect of PA on TGF-β1-reduced smad7 expression in rat HSCs. Cells were pretreated with 0.5, 1, and 2 μM PA for 1 h, and then stimulated with TGF-β1 (5 ng/mL) for 24 h. The total protein extracted from cells was subjected to Western blotting to determine smad7 expression. Protein bands were imaged using densitometry and analyzed using ImageJ software. The relative expression levels of target proteins were normalized using β-actin as an internal control. The results are presented as the means ± SD of three independent experiments. # Significantly different from the control (P < 0.01). * Significantly different from the TGF-β1-treated group (p < 0.01).
Figure 5
Figure 5
The effects of PA on TGF-β1-reduced PPARγ expression in HSC-T6 cells. (A,B) The effect of PA-induced PPARγ expression in rat hepatic stellate cells (HSCs). Cells were treated with PA (2 μM) for 0, 6, 12, and 24 h or PA (0.5, 1, and 2 μM) for 24 h, and PPARγ expression was analyzed by Western blotting. The effect of PA on TGF-β1-reduced PPARγ expression in rat HSCs; (C) cells were pretreated with various concentrations of PA (0.5, 1, and 2 μM) for 1 h, and then stimulated with TGF-β1 (5 ng/mL) for 24 h. Total protein extracted from cells was subjected to Western blotting to determine PPARγ expression; (D,E) cells were treated with TGF-β1 (5 ng/mL) for 24 h in the presence of PA and/or GW9662 (10 μM). Total protein extracted from cells was subjected to Western blotting to determine the expression of PPARγ and α-SMA and collagen Iα1. Protein bands were imaged using densitometry and analyzed using ImageJ software. The relative expression levels of target proteins were normalized using β-actin as an internal control. The results are presented as the means ± SD of three independent experiments. # Significantly different from the control (p < 0.01). * Significantly different from the TGF-β1-treated group (p < 0.01). + Significantly different from the PA-treated group (p < 0.01).
Figure 6
Figure 6
The effects of PA on the TGF-β1-induced Akt and MAPK signal pathways in HSC-T6 cells. (A) The effect of TGF-β1-induced Akt and MAPKs phosphorylation in rat hepatic stellate cells (HSCs). HSCs were treated with TGF-β1 (5 ng/mL) for 0, 15, 30, 45, and 60 min, and Akt and MAPKs phosphorylation was analyzed by Western blotting; (B) the inhibitory effect of PA on TGF-β1-induced Akt and MAPK phosphorylation in rat HSCs. Cells were pretreated with 0.5, 1, and 2 μM PA for 1 h, and then stimulated with TGF-β1 (5 ng/mL) for 45 min. Total protein extracted from cells was subjected to Western blotting to assess Akt, ERK1/2, JNK1/2, and p38 MAPK phosphorylation. Protein bands were imaged using densitometry and analyzed using ImageJ software. The relative phosphorylation levels of target proteins were normalized using β-actin as an internal control. The results are presented as the means ± SD of three independent experiments. # Significantly different from the control (p < 0.01). * Significantly different from the TGF-β1-treated group (p < 0.01).
Figure 7
Figure 7
The effects of PA on TGF-β1-induced α-SMA and collagen Iα1 expression via suppression of the Akt and MAPK signal pathways in HSC-T6 cells. (A,B) The inhibitory effects of PA on TGF-β1-induced α-SMA and collagen Iα1 expression via suppression of Akt and MAPK in rat hepatic stellate cells (HSCs); (A) cells were treated with TGF-β1 (5 ng/mL) for 24 h in the presence of LY294002 (LY; 10 μM), PD98059 (PD; 20 μM), SB203580 (SB; 20 μM), or SP600125 (SP; 20 μM); (B) cells were treated with TGF-β1 (5 ng/mL) for 24 h in the presence of PA and LY294002 (LY; 10 μM), PD98059 (PD; 20 μM), SB203580 (SB; 20 μM), or SP600125 (SP; 20 μM). Total protein extracted from cells was subjected to Western blotting to determine α-SMA and collagen Iα1 expression. Protein bands were imaged using densitometry and analyzed using ImageJ software. The relative expression levels of target proteins were normalized using β-actin as an internal control. The results are presented as the means ± SD of three independent experiments. # Significantly different from the control (p < 0.01). * Significantly different from the TGF-β1-treated group (p < 0.01). + Significantly different from the PA-treated group (p < 0.01).
Figure 8
Figure 8
Schematic diagram illustrating the mechanism by which platyconic acid A (PA) inhibits hepatic stellate cell (HSC) activation. PA significantly suppressed α-SMA and collagen Iα1 expression in rat HSCs by blocking the transforming growth factor (TGF)-β1-dependent SMAD signaling pathways and TGF-β1-independent non-SMAD signaling pathways. The mechanism of the TGF-β1-dependent SMAD signaling pathway involved attenuation of smad2/3 by enhancing smad7 and the PPARγ. The mechanism of the TGF-β1-independent non-SMAD signaling pathway involved inhibition of Akt and ERK1/2. Therefore, PA, the active component of Platycodi radix-derived saponin, is a useful chemotherapeutic agent that may prevent HSCs activation.

Similar articles

Cited by

References

    1. Roy S., Trautwein C., Luedde T., Roderburg C. A General Overview on Non-coding RNA-Based Diagnostic and Therapeutic Approaches for Liver Diseases. Front. Pharmacol. 2018;9:805. doi: 10.3389/fphar.2018.00805. - DOI - PMC - PubMed
    1. Neuman M.G., French S.W., Zakhari S., Malnick S., Seitz H.K., Cohen L.B., Salaspuro M., Voinea-Griffin A., Barasch A., Kirpich I.A., et al. Alcohol, microbiome, life style influence alcohol and non-alcoholic organ damage. Exp. Mol. Pathol. 2017;102:162–180. doi: 10.1016/j.yexmp.2017.01.003. - DOI - PubMed
    1. Wallace M.C., Friedman S.L., Mann D.A. Emerging and disease-specific mechanisms of hepatic stellate cell activation. Semin. Liver Dis. 2015;35:107–118. doi: 10.1055/s-0035-1550060. - DOI - PubMed
    1. Yin C., Evason K.J., Asahina K., Stainier D.Y. Hepatic stellate cells in liver development, regeneration, and cancer. J. Clin. Investig. 2013;123:1902–1910. doi: 10.1172/JCI66369. - DOI - PMC - PubMed
    1. Zhou Y., Yang S., Zhang P. Effect of Exogenous Fetuin-A on TGF-β/Smad Signaling in Hepatic Stellate Cells. Biomed. Res. Int. 2016;2016:8462615. doi: 10.1155/2016/8462615. - DOI - PMC - PubMed

Publication types

MeSH terms

LinkOut - more resources