

The first order statistics of backscatter from the fractal branching vasculature
- PMID: 31795650
- PMCID: PMC6853797
- DOI: 10.1121/1.5132934
The first order statistics of backscatter from the fractal branching vasculature
Abstract
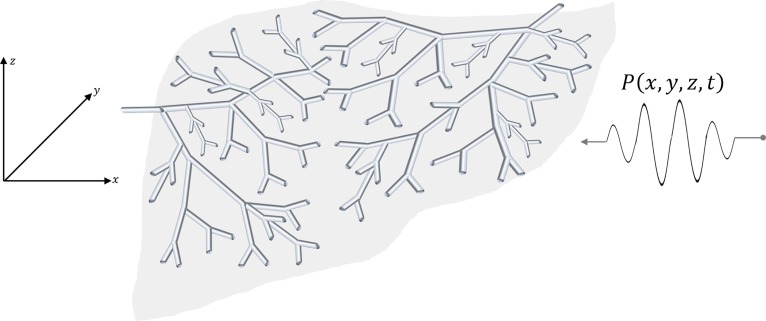
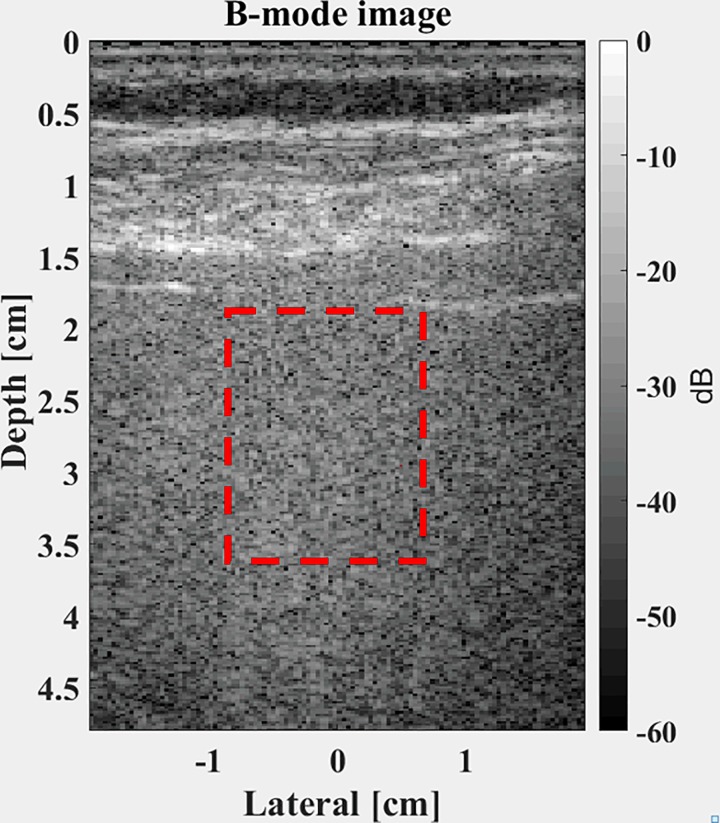
The issue of speckle statistics from ultrasound images of soft tissues such as the liver has a long and rich history. A number of theoretical distributions, some related to random scatterers or fades in optics and radar, have been formulated for pulse-echo interference patterns. This work proposes an alternative framework in which the dominant echoes are presumed to result from Born scattering from fluid-filled vessels that permeate the tissue parenchyma. These are modeled as a branching, fractal, self-similar, multiscale collection of cylindrical scatterers governed by a power law distribution relating to the number of branches at each radius. A deterministic accounting of the echo envelopes across the scales from small to large is undertaken, leading to a closed form theoretical formula for the histogram of the envelope of the echoes. The normalized histogram is found to be related to the classical Burr distribution, with the key power law parameter directly related to that of the number density of vessels vs diameter, frequently reported in the range of 2 to 4. Examples are given from liver scans to demonstrate the applicability of the theory.
Figures


Similar articles
-
Speckle from branching vasculature: dependence on number density.J Med Imaging (Bellingham). 2020 Mar;7(2):027001. doi: 10.1117/1.JMI.7.2.027001. Epub 2020 Apr 11. J Med Imaging (Bellingham). 2020. PMID: 32313816 Free PMC article.
-
Burr, Lomax, Pareto, and Logistic Distributions from Ultrasound Speckle.Ultrason Imaging. 2020 Jul-Sep;42(4-5):203-212. doi: 10.1177/0161734620930621. Epub 2020 Jun 2. Ultrason Imaging. 2020. PMID: 32484398 Free PMC article.
-
Generalized formulations producing a Burr distribution of speckle statistics.J Med Imaging (Bellingham). 2022 Mar;9(2):023501. doi: 10.1117/1.JMI.9.2.023501. Epub 2022 Apr 1. J Med Imaging (Bellingham). 2022. PMID: 35387205 Free PMC article.
-
Ultrasound Backscatter Envelope Statistics Parametric Imaging for Liver Fibrosis Characterization: A Review.Ultrason Imaging. 2020 Mar;42(2):92-109. doi: 10.1177/0161734620907886. Epub 2020 Feb 26. Ultrason Imaging. 2020. PMID: 32100633 Review.
-
Ultrasonic imaging of microscopic structures in living organs.Int Rev Exp Pathol. 1996;36:73-92. Int Rev Exp Pathol. 1996. PMID: 9005227 Review.
Cited by
-
Ultrasound Characterization of Oral Soft Tissues in vivo Using the Burr Speckle Model.ArXiv [Preprint]. 2024 Sep 24:arXiv:2409.14314v2. ArXiv. 2024. PMID: 39398210 Free PMC article. Preprint.
-
Speckle statistics of biological tissues in optical coherence tomography.Biomed Opt Express. 2021 Jun 17;12(7):4179-4191. doi: 10.1364/BOE.422765. eCollection 2021 Jul 1. Biomed Opt Express. 2021. PMID: 34457407 Free PMC article.
-
First-Order Speckle Statistics for the Detection of Microstructural Anisotropy.IEEE Trans Ultrason Ferroelectr Freq Control. 2025 Jun;72(6):744-754. doi: 10.1109/TUFFC.2025.3562784. IEEE Trans Ultrason Ferroelectr Freq Control. 2025. PMID: 40257868
-
Clusters of Ultrasound Scattering Parameters for the Classification of Steatotic and Normal Livers.Ultrasound Med Biol. 2021 Oct;47(10):3014-3027. doi: 10.1016/j.ultrasmedbio.2021.06.010. Epub 2021 Jul 24. Ultrasound Med Biol. 2021. PMID: 34315619 Free PMC article.
-
Speckle from branching vasculature: dependence on number density.J Med Imaging (Bellingham). 2020 Mar;7(2):027001. doi: 10.1117/1.JMI.7.2.027001. Epub 2020 Apr 11. J Med Imaging (Bellingham). 2020. PMID: 32313816 Free PMC article.
References
-
- Abramowitz, M. , and Stegun, I. A. (1964). Handbook of Mathematical Functions with Formulas, Graphs, and Mathematical Tables ( U.S. Government Printing Office, Washington, DC: ).
-
- Albini, F. A. , and Nagelberg, E. R. (1962). “ Scattering of a plane wave by an infinite inhomogeneous, dielectric cylinder—an application of the Born approximation,” J. Appl. Phys. 33, 1706–1713.10.1063/1.1728813 - DOI
-
- Bracewell, R. N. (1965a). The Fourier Transform and its Applications ( McGraw-Hill, New York: ), Chap. 8.
-
- Bracewell, R. N. (1965b). The Fourier Transform and its Applications ( McGraw-Hill, New York: ), Chap. 12.
Publication types
MeSH terms
Grants and funding
LinkOut - more resources
Full Text Sources