. 2019 Nov;36(sup1):47-63.
doi: 10.1080/02656736.2019.1685686.

Enhancing the abscopal effect of radiation and immune checkpoint inhibitor therapies with magnetic nanoparticle hyperthermia in a model of metastatic breast cancer

Affiliations

Enhancing the abscopal effect of radiation and immune checkpoint inhibitor therapies with magnetic nanoparticle hyperthermia in a model of metastatic breast cancer

Arlene L Oei et al. Int J Hyperthermia. 2019 Nov.

Abstract

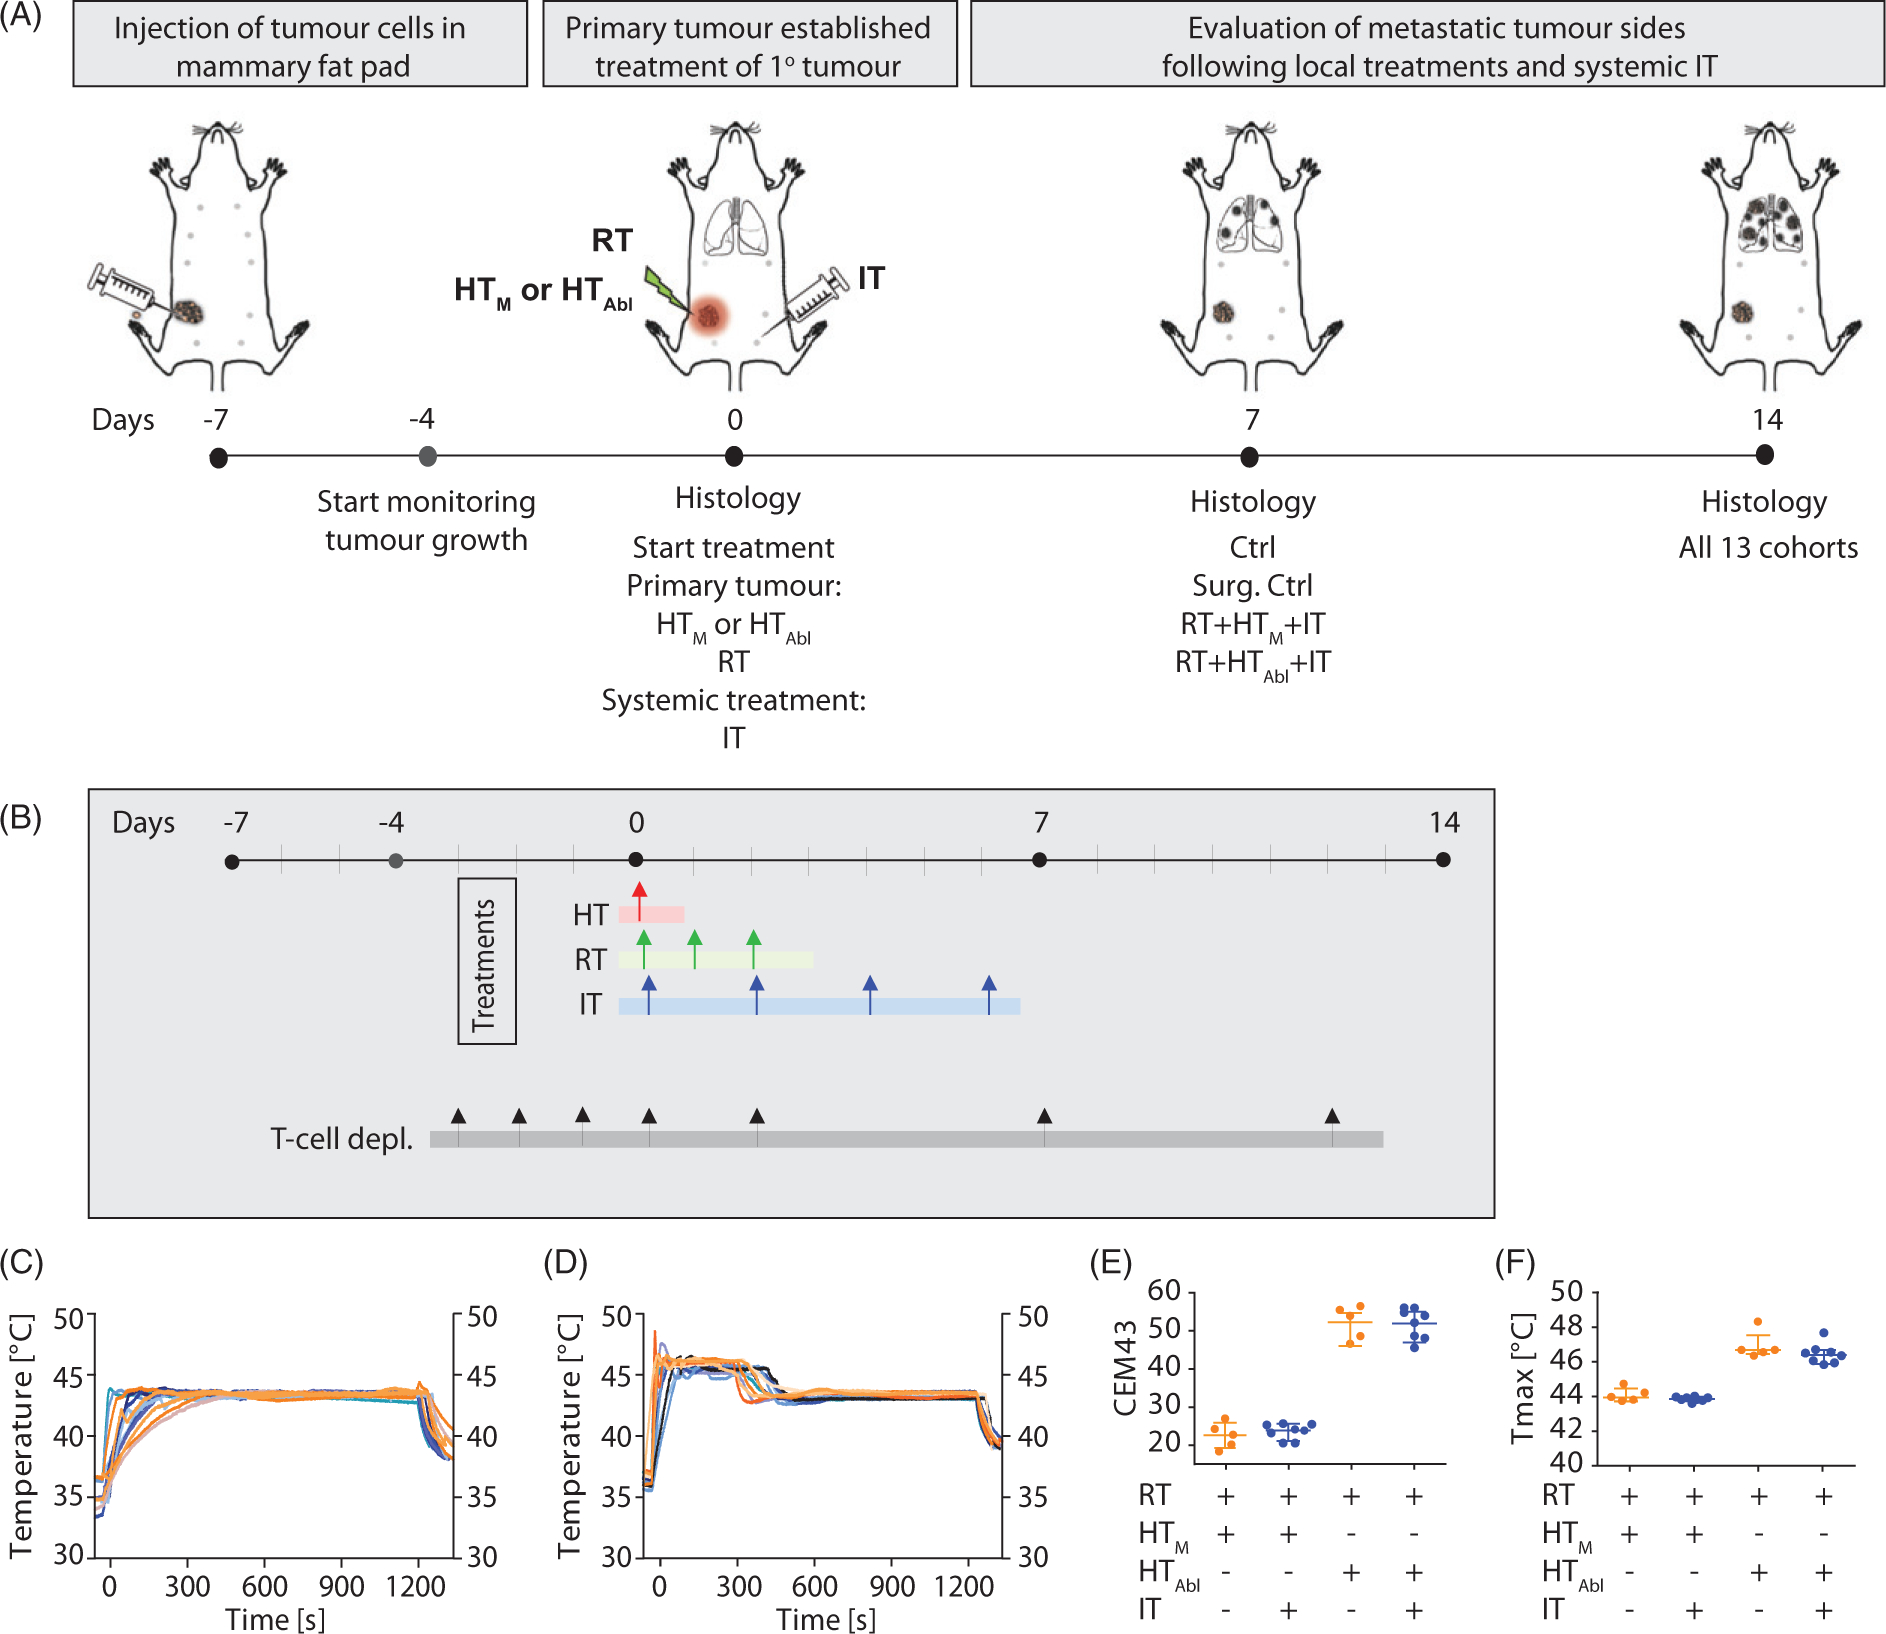
Purpose: Enhancing immune responses in triple negative breast cancers (TNBCs) remains a challenge. Our study aimed to determine whether magnetic iron oxide nanoparticle (MION) hyperthermia (HT) can enhance abscopal effects with radiotherapy (RT) and immune checkpoint inhibitors (IT) in a metastatic TNBC model.Methods: One week after implanting 4T1-luc cells into the mammary glands of BALB/c mice, tumors were treated with RT (3 × 8 Gy)±local HT, mild (HTM, 43 °C/20 min) or partially ablative (HTAbl, 45 °C/5 min plus 43 °C/15 min),±IT with anti-PD-1 and anti-CTLA-4 antibodies (both 4 × 10 mg/kg, i.p.). Tumor growth was measured daily. Two weeks after treatment, lungs and livers were harvested for histopathology evaluation of metastases.Results: Compared to untreated controls, all treatment groups demonstrated a decreased tumor volume; however, when compared against surgical resection, only RT + HTM+IT, RT + HTAbl+IT and RT + HTAbl had similar or smaller tumors. These cohorts showed more infiltration of CD3+ T-lymphocytes into the primary tumor. Tumor growth effects were partially reversed with T-cell depletion. Combinations that proved most effective for primary tumors generated modest reductions in numbers of lung metastases. Conversely, numbers of lung metastases showed potential to increase following HT + IT treatment, particularly when compared to RT. Compared to untreated controls, there was no improvement in survival with any treatment.Conclusions: Single-fraction MION HT added to RT + IT improved local tumor control and recruitment of CD3+ T-lymphocytes, with only a modest effect to reduce lung metastases and no improvement in overall survival. HT + IT showed potential to increase metastatic dissemination to lungs.

Keywords: Magnetic nanoparticle hyperthermia; immune checkpoint therapy; ionizing radiation; metastatic cancer; triple negative breast cancer.


Figures

Figure 1.
Figure 1.
(A) Schematic of experimental design. Luciferin containing 4T1-cells were injected in the fourth mammary fat pad of female BALB/c mice seven days before treatment. Three days after tumor implantation, tumors were measurable and the growth of the primary tumor was measured until the end of the experiment. On day of treatment (D0), primary tumors were treated with local RT±HT (HTM: mild or HTAbl partially ablative). Mice were sacrificed at D0, D7 and D14. Primary tumors and organs were harvested for staining of particular cell types or to identify the number of metastases. Thermometry measurements of mild vs. partially ablative hyperthermia. Graphs represent thermometry data of (B) HTM, heating at 43 °C for 20 min and (C) HTAbl, heating at 45 °C for 5min plus 43 °C for 15 min. (D) Almost two times higher CEM43 is measured after HTAbl vs. HTM. (E) Maximum temperatures reached are higher after HTM compared to HTAbl.
Figure 2.
Figure 2.
Growth of primary tumors after focal RT and HT combined with systemic immune checkpoint inhibitors. (A) Growth of individual tumors after any combination of treatment of RT, HTM or HTAbl and IT. Mice were treated on day 0. (B) As in A but data points represent mean tumor volume and error bars the standard error. (C) Scatter plot of tumor volumes measured at 14 days after treatment and at euthanasia. Horizontal bars identify median values and boxes define interquartile range with whiskers marking minimum and maximum for all groups. All cohorts had at least five mice per group.
Figure 2.
Figure 2.
Growth of primary tumors after focal RT and HT combined with systemic immune checkpoint inhibitors. (A) Growth of individual tumors after any combination of treatment of RT, HTM or HTAbl and IT. Mice were treated on day 0. (B) As in A but data points represent mean tumor volume and error bars the standard error. (C) Scatter plot of tumor volumes measured at 14 days after treatment and at euthanasia. Horizontal bars identify median values and boxes define interquartile range with whiskers marking minimum and maximum for all groups. All cohorts had at least five mice per group.
Figure 3.
Figure 3.
Effects of treatment on the primary tumor at day 14 post-treatment. (A) Representative images of hematoxylin-eosin (H&E) stained tumor tissue sections demonstrating large necrotic areas after any treatment including RT. (B) Representative sections of tumor stained with and CD3 antibody for immunohistochemical analysis of CD3+ T-lymphocytes infiltration into primary tumors after treatment. (C) Scatter plot of enumerated CD3+ cells showing a progressive increase of T-lymphocyte infiltration into tumors resulting from therapy. A higher number of CD3+ cells was observed in tumors following RT + HTAbl and RT + IT + HTM and RT + IT + HTAbl. As in Figure 2, horizontal bars identify median values and boxes define interquartile range with whiskers marking minimum and maximum for all groups.
Figure 4.
Figure 4.
Growth of primary tumors after focal RT and HT combined with systemic immune checkpoint inhibitors compared with pharmacologic T-cell inhibition. (A) As in Figure 2, growth of individual tumors after treatment with RT, HTM and IT, compared with tumor volumes measured on mice after treatment and with pharmacologic T-lymphocyte inhibition. Mice were treated on Day 0. (B) As in A but data points represent mean tumor volume and error bars the standard error. (C) Scatter plot of tumor volumes measured at 14 days after treatment and at euthanasia. Horizontal bars identify median values and boxes define interquartile range with whiskers marking minimum and maximum for all groups. (D) Kaplan-Meier representation of results of pilot survival study. Despite evidence of improved local tumor control with combination therapy and evidence of increased trafficking of T-lymphocytes to tumors, no improvement in survival was measured. All cohorts had at least five mice.
Figure 5.
Figure 5.
Combination treatments show potential to reduce numbers of metastases in lungs. (A) Image of representative H&E stained lung tissue sections obtained from control (no treatment) mice at days 0, 7 and 14 and displayed at different magnifications (left). (right) Number of metastases counted per lung represented by 3–5 mice not receiving treatment (untreated controls) per group on days 0, 7 and 14 shows progression of disease as measured by increasing numbers of lung metastases. (B) As in A, but with columns showing representative images by treatment group (left). (right) As in A, scatter plot showing numbers of lung metastases counted RT + HTM+IT and RT + HTAbl+IT groups and compared to untreated control mice at 7 days (Day 7) after treatment. (C) Representative images of H&E stained lung tissues at 14 days after treatment. (D) Quantification of numbers of metastases in lungs from three nonconsecutive tissue sections, for all treatment groups. Data points display total number of counted metastases in lungs for each mouse obtained from all three tissue sections. (E) Representative images of lung tumors after CD3 staining. (F) Scatter plot of analysis of immunohistochemistry of lung tissue sections stained with anti-CD3 antibody showing relative numbers of CD3+ lymphocytes in the lung metastases following treatments. (G) As in D, data were collected from a second and smaller treatment study comparing effects of pharmacologic T-cell depletion on lung metastases following treatment. For all scatter plots, horizontal bars identify median values and boxes define interquartile range with whiskers marking minimum and maximum for all groups.
Figure 5.
Figure 5.
Combination treatments show potential to reduce numbers of metastases in lungs. (A) Image of representative H&E stained lung tissue sections obtained from control (no treatment) mice at days 0, 7 and 14 and displayed at different magnifications (left). (right) Number of metastases counted per lung represented by 3–5 mice not receiving treatment (untreated controls) per group on days 0, 7 and 14 shows progression of disease as measured by increasing numbers of lung metastases. (B) As in A, but with columns showing representative images by treatment group (left). (right) As in A, scatter plot showing numbers of lung metastases counted RT + HTM+IT and RT + HTAbl+IT groups and compared to untreated control mice at 7 days (Day 7) after treatment. (C) Representative images of H&E stained lung tissues at 14 days after treatment. (D) Quantification of numbers of metastases in lungs from three nonconsecutive tissue sections, for all treatment groups. Data points display total number of counted metastases in lungs for each mouse obtained from all three tissue sections. (E) Representative images of lung tumors after CD3 staining. (F) Scatter plot of analysis of immunohistochemistry of lung tissue sections stained with anti-CD3 antibody showing relative numbers of CD3+ lymphocytes in the lung metastases following treatments. (G) As in D, data were collected from a second and smaller treatment study comparing effects of pharmacologic T-cell depletion on lung metastases following treatment. For all scatter plots, horizontal bars identify median values and boxes define interquartile range with whiskers marking minimum and maximum for all groups.

References

    1. Carey LA, Perou CM, Livasy CA. Race, breast cancer subtypes, and survival in the Carolina Breast Cancer Study. JAMA. 2006;295(21): 2492–2502. - PubMed
    1. Anders C, Carey LA. Understanding and treating triple-negative breast cancer. Oncology. 2008;22(11):1233–1239. discussion 12391240,1243. - PMC - PubMed
    1. Dent R, Trudeau M, Pritchard KI, et al. Triple-negative breast cancer: clinical features and patterns of recurrence. Clin Cancer Res. 2007;13(15):4429–4434. - PubMed
    1. Kassam F, Enright K, Dent R, et al. Survival outcomes for patients with metastatic triple-negative breast cancer: implications for clinical practice and trial design. Clin Breast Cancer. 2009;9(1): 29–33. - PubMed
    1. Chen MT, Sun HF, Zhao Y, et al. Comparison of patterns and prognosis among distant metastatic breast cancer patients by age groups: a SEER population-based analysis. Sci Rep. 2017;7(1): 9254. - PMC - PubMed

Publication types

Substances