. 2019 Dec 3;39(1):81.
doi: 10.1186/s40880-019-0424-2.

Bortezomib inhibits growth and sensitizes glioma to temozolomide (TMZ) via down-regulating the FOXM1-Survivin axis

Affiliations

Bortezomib inhibits growth and sensitizes glioma to temozolomide (TMZ) via down-regulating the FOXM1-Survivin axis

Jun-Hai Tang et al. Cancer Commun (Lond). .

Abstract

Background: High-grade glioma (HGG) is a fatal human cancer. Bortezomib, a proteasome inhibitor, has been approved for the treatment of multiple myeloma but its use in glioma awaits further investigation. This study aimed to explore the chemotherapeutic effect and the underlying mechanism of bortezomib on gliomas.

Methods: U251 and U87 cell viability and proliferation were detected by 3-(4,5-dimethyl-2-thiazolyl)-2,5-diphenyl-2-H-tetrazolium bromide (MTT) assay, tumor cell spheroid growth, and colony formation assay. Cell apoptosis and cell cycle were detected by flow cytometry. Temozolomide (TMZ)-insensitive cell lines were induced by long-term TMZ treatment, and cells with stem cell characteristics were enriched with stem cell culture medium. The mRNA levels of interested genes were measured via reverse transcription-quantitative polymerase chain reaction, and protein levels were determined via Western blotting/immunofluorescent staining in cell lines and immunohistochemical staining in paraffin-embedded sections. Via inoculating U87 cells subcutaneously, glioma xenograft models in nude mice were established for drug experiments. Patient survival data were analyzed using the Kaplan-Meier method.

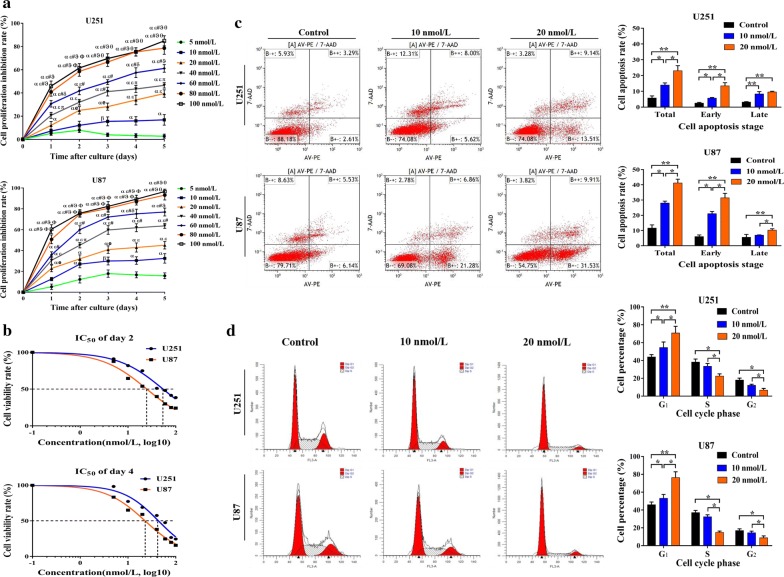
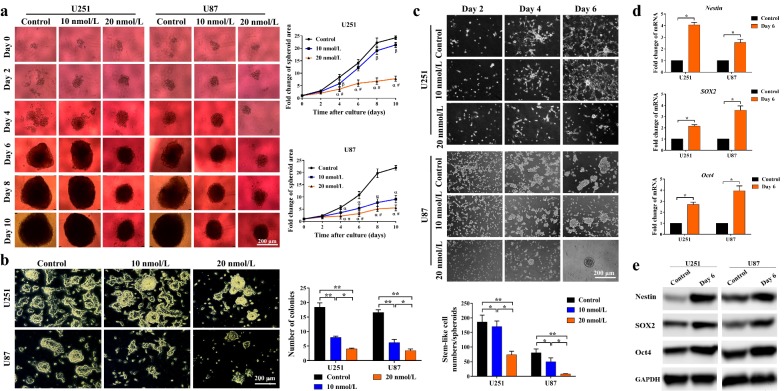
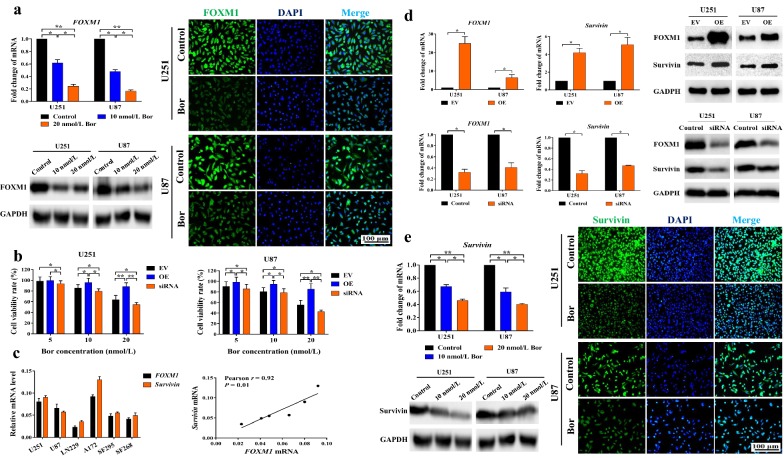
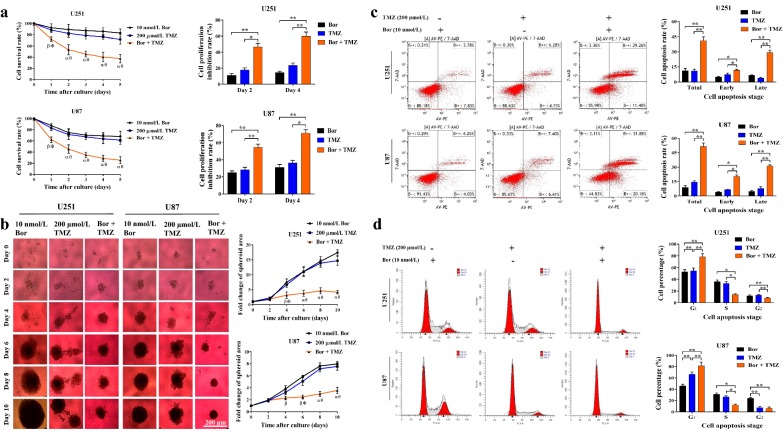
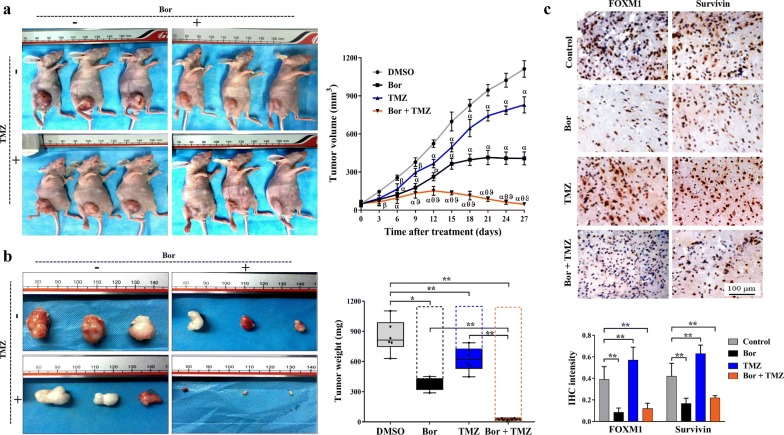
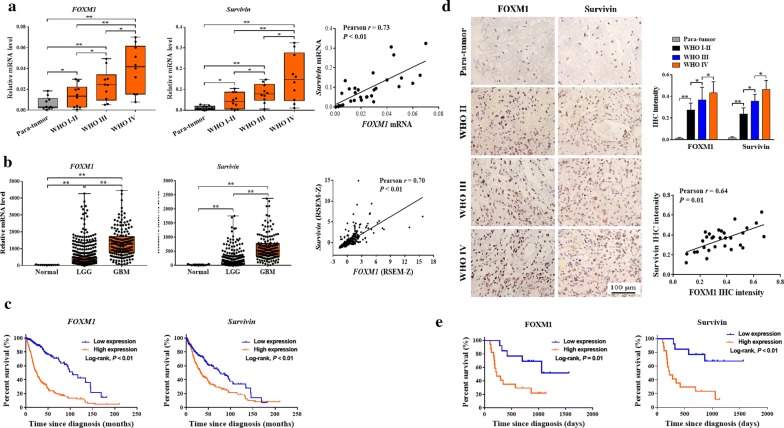
Results: Bortezomib inhibited the viability and proliferation of U251 and U87 cells in a dose- and time-dependent manner by inducing apoptosis and cell cycle arrest. Bortezomib also significantly inhibited the spheroid growth, colony formation, and stem-like cell proliferation of U251 and U87 cells. When administrated in combination, bortezomib showed synergistic effect with TMZ in vitro and sensitized glioma to TMZ treatment both in vitro and in vivo. Bortezomib reduced both the mRNA and protein levels of Forkhead Box M1 (FOXM1) and its target gene Survivin. The FOXM1-Survivin axis was markedly up-regulated in established TMZ-insensitive glioma cell lines and HGG patients. Expression levels of FOXM1 and Survivin were positively correlated with each other and both related to poor prognosis in glioma patients.

Conclusions: Bortezomib was found to inhibit glioma growth and improved TMZ chemotherapy efficacy, probably via down-regulating the FOXM1-Survivin axis. Bortezomib might be a promising agent for treating malignant glioma, alone or in combination with TMZ.

Keywords: Bortezomib; Chemotherapy; FOXM1; Glioma; Survivin; Temozolomide (TMZ).


Conflict of interest statement

The authors declare that they have no competing interests.

Figures

Fig. 1
Fig. 1
Effects of bortezomib on the proliferation, apoptosis, and cell cycle of glioma cells. a MTT assay measured the viability of U251 and U87 cell lines under 0 (Control, DMSO), 5, 10, 20, 40, 60, 80, and 100 nmol/L bortezomib treatment. The cell proliferation inhibition rate of each treatment group was compared with that of every other group detected on the same day. ɑP < 0.01, βP < 0.05, compared with the 5 nmol/L group; εP < 0.01, eP < 0.05, compared with 10 nmol/L group; #P < 0.01, πP < 0.05, compared with 20 nmol/L group; ϑP < 0.01, δP < 0.05, compared with 40 nmol/L group; θP < 0.01, ФP < 0.05, compared with 60 nmol/L group. b Day 2 and Day 4 IC50 of bortezomib in U251 and U87 cells were calculated with the method of “log(inhibitor) vs. normalized response-Variable slope” using GraphPad Prism 7.0. c Left part, representative images of cell apoptosis detected via flow cytometry. U251 and U87 cells were treated with 10 and 20 nmol/L bortezomib for 48 h. Right part, percentages of early-stage (lower right quadrant), late-stage (upper right quadrant), and total apoptotic cells were compared among the three groups. *P < 0.05; **P < 0.01. d Left part, representative images of cell cycle detected via flow cytometry. U251 and U87 cells were treated with 10 and 20 nmol/L bortezomib for 48 h. Right part, percentages of cells in G0/1 (left red sharp peak), S (middle gray flat peak), and G2/M (right sharp peak) phases were calculated and compared among groups. *P < 0.05; **P < 0.01. All experiments were repeated at least three times. DMSO dimethyl sulfoxide, IC50 50% inhibitory concentration
Fig. 2
Fig. 2
Effects of bortezomib on the spheroid growth, colony formation, and stemness of glioma cells. a Left part, representative images of U251 and U87 cell spheroids treated with 0 (Control), 10, and 20 nmol/L bortezomib. Right part, the growth speed is represented by the fold changes of the spheroid area compared with its own area on day 1. Images of spheroids were taken every 2 days (scale bar, 200 μm). Average fold change of the spheroid area was compared between every two groups detected on the same day. ɑP < 0.01, βP < 0.05, compared with control group; #P < 0.01, πP < 0.05, compared with 10 nmol/L bortezomib group. b Bortezomib reduced glioma cell colony formation. Left part, representative images of U251 and U87 colonies on the 10th day (with phase-contrast mode, scale bar, 200 μm). Cells were cultured in medium with 0 (Control, DMSO), 10, or 20 nmol/L bortezomib for the first 3 days and then in normal medium for another 7 days. Right part, the average number of cell colonies observed under 5 random microscopic fields was calculated. c Upper part, representative images of stem-like cells/spheroids derived from U251 and U87 cells in stem cell culture medium (scale bar, 200 μm). Cells were treated with 0 (Control, DMSO), 10, or 20 nmol/L bortezomib for 24 h before seeding. Bottom part, the average number of stem-like cells/spheroids (more than 20 cells) observed under 5 random microscopic fields on day 6 was calculated. d, e RT-qPCR and Western blotting detected the mRNA and protein levels of cells/spheroids enriched after stem cell medium culture. *P < 0.05; **P < 0.01. All experiments were repeated at least three times. DMSO dimethyl sulfoxide, RT-qPCR reverse transcription-quantitative polymerase chain reaction, GAPDH glyceraldehyde-3-phosphate dehydrogenase
Fig. 3
Fig. 3
Bortezomib down-regulated the FOXM1–Survivin axis in glioma cells. a Left part, measuring FOXM1 in U251 and U87 after treatment with 0 (Control, DMSO), 10, or 20 nmol/L bortezomib for 48 h at the mRNA level (RT-qPCR, left upper part) and protein level (Western blotting, left lower part). Right part, immunofluorescent staining of FOXM1 in U251 and U87 cells after bortezomib treatment for 48 h (scale bar, 100 μm). b Same number of FOXM1-overexpressed, FOXM1 siRNA-transfected, and EV-transfected cells were treated with bortezomib for 48 h. Cell viability was measured by MTT assay. c FOXM1 and Survivin mRNA levels in 6 glioma cell lines were detected by RT-qPCR. The correlation between FOXM1 and Survivin mRNA levels was analyzed via GraphPad Prism 7.0 using Pearson R test. d FOXM1 and Survivin mRNA (RT-qPCR, left part) and protein expression (Western blotting, right part) in FOXM1-overexpressed, FOXM1 siRNA-transfected, and EV-transfected cells. e Left part, Survivin mRNA (RT-qPCR, left upper part) and protein expression (Western blotting, left lower part) in U251 and U87 cells after treatment with bortezomib for 48 h. Right part, immunofluorescent staining of Survivin in U251 and U87 cells after treatment with bortezomib for 48 h (scale bar, 100 μm). *P < 0.05; **P < 0.01. RT-qPCR reverse transcription-quantitative polymerase chain reaction, DMSO dimethyl sulfoxide, GAPDH glyceraldehyde-3-phosphate dehydrogenase, DAPI 4′,6-diamidino-2-phenylindole, siRNA short interfering RNA, Bor bortezomib, EV empty vector, OE overexpression, MTT 3-(4,5-dimethyl-2-thiazolyl)-2,5-diphenyl-2-H-tetrazolium bromide
Fig. 4
Fig. 4
Bortezomib sensitized glioma cells to TMZ. U251 and U87 cells were treated with bortezomib (10 nmol/L), TMZ (200 μmol/L) or a combination of the two drugs. a Left part, viability of U251 and U87 cells was measured by MTT assay. Cell survival rates were compared among groups. Right part, on day 4 and day 2, cell proliferation inhibition rates were calculated. ɑP < 0.01, βP < 0.05, compared with 10 nmol/L bortezomib group; θP < 0.01, ФP < 0.05, compared with 200 μmol/L TMZ group; *P < 0.05; **P < 0.01. b Left part, representative images of U251 and U87 spheroids taken every 2 days (scale bar, 200 μm). Right part, growth speed represented by the fold change of surface area compared with the surface area on day 1. Fold changes (in average) from the same day were compared among the three groups. ɑP < 0.01, βP < 0.05, compared with 10 nmol/L bortezomib group; θP < 0.01, ФP < 0.05, compared with 200 μmol/L TMZ group. c Left part, representative images of cell apoptosis after 48-h treatment detected via flow cytometry. Right part, percentages of early-stage (lower right quadrant) and late-stage (upper right quadrant) apoptotic cells and their sum were compared among the three groups. d Left part, representative images of cell cycle detected via flow cytometry after 48-h treatment. Right part, percentages of cells in G0/1 (left red sharp peak), S (middle gray flat peak), and G2/M (right sharp peak) phase were calculated and compared among groups. *P < 0.05; **P < 0.01. All experiments were repeated at least three times. MTT 3-(4,5-dimethyl-2-thiazolyl)-2,5-diphenyl-2-H-tetrazolium bromide, DMSO dimethyl sulfoxide, Bor bortezomib, TMZ temozolomide
Fig. 5
Fig. 5
FOXM1–Survivin axis was up-regulated in TMZ-insensitive glioma cells. a RT-qPCR (mRNA level, upper part) and Western blotting (protein level, lower part) measuring the expression of FOXM1 and Survivin in TMZ-insensitive U251 and U87 cells induced by 200 μmol/L and 500 μmol/L TMZ (In200-U251/U87 and In500-U251/U87). b Immunofluorescent staining of FOXM1 in normal (Control) and In500-U251/U87 cells (scale bar, 100 μm). c RT-qPCR detecting mRNA levels of FOXM1 and Survivin in In500-U251/U87 cells after cultivating in medium with 500 μmol/L TMZ or equivalent DMSO for 7 days. d Immunofluorescent staining of FOXM1 protein in In500-U251/U87 cells after cultivating in medium with 500 μmol/L TMZ or equivalent DMSO for 7 days (scale bar, 100 μm). e Cell viability rates were calculated after In500-U251/U87 cells were treated with 10 or 20 nmol/L bortezomib, 800 μmol/L TMZ, bortezomib + TMZ, or drug vehicle (DMSO, control) for 48 h. *P < 0.05; **P < 0.01. RT-qPCR reverse transcription-quantitative polymerase chain reaction, TMZ temozolomide, DAPI 4′,6-diamidino-2-phenylindole, DMSO dimethyl sulfoxide, Bor bortezomib, ns no significance
Fig. 6
Fig. 6
Bortezomib inhibited glioma growth and sensitized glioma to TMZ in vivo. a Left part, representative images of subcutaneously xeno-transplanted glioma models in nude mice. About 1 week after subcutaneous injection of U87 cells, the mice were selected and randomized into four groups and were initiated treatment with bortezomib, TMZ, TMZ + bortezomib, or drug vehicle (DMSO). Right part, in vivo tumors volume was measured every 3 days with a vernier caliper, and same day collected data were compared among groups. ɑP < 0.01, βP < 0.05, compared with DMSO group; θP < 0.01, compared with bortezomib group; ϑP < 0.01, compared with TMZ group. b Left part, representative images of glioma lesions taken from the mice of each group. After treatment for 28 days, the nude mice were euthanized, and glioma lesions were taken off in intact. Right part, the weight of fresh glioma lesions. c Top part, representative images of IHC staining of FOXM1 and Survivin in glioma tissues from mice (scale bar, 100 μm). Bottom part, the IHC staining intensity of FOXM1 and Survivin were further quantified via Image-pro Plus 6.0. *P < 0.05; **P < 0.01. Bor bortezomib, TMZ temozolomide, DMSO dimethyl sulfoxide, IHC immunohistochemistry
Fig. 7
Fig. 7
The FOXM1–Survivin axis was up-regulated in gliomas and related to poor prognosis. a RT-qPCR measuring mRNA levels of FOXM1 and Survivin in para-tumor brain tissues (n = 10), WHO grade I–II gliomas (n = 10), WHO grade III gliomas (n = 10), and WHO grade IV gliomas (GBMs, n = 10). The correlation between FOXM1 and Survivin mRNA levels was analyzed via GraphPad Prism 7.0 using Pearson R test. b TCGA data of FOXM1/Survivin mRNA expression (mRNA Expression z-Scores, RNA SeqV2 RSEM) in LGGs (n = 530), GBMs (n = 166), and normal brain tissues (n = 10). The correlation between FOXM1 and Survivin mRNA levels (696 samples in total) was analyzed using GraphPad Prism 7.0 and Pearson R test. c Kaplan–Meier survival analysis of the prognostic role of FOXM1/Survivin using TCGA data (692 samples in total). The samples were divided into a high and low FOXM1/Survivin expression group using their relative median mRNA level. d Left part, representative images of IHC staining of FOXM1 and Survivin in para-tumor brain tissues and gliomas (scale bar, 100 μm). Right part, IHC intensity was measured and processed by Image-pro Plus 6.0. The correlation between FOXM1 and Survivin IHC intensity was analyzed using GraphPad Prism 7.0 and Pearson R test. e Kaplan–Meier survival analysis of the prognostic role of FOXM1 and Survivin. The samples were divided into high and low FOXM1/Survivin expression groups by the median IHC intensity. *P < 0.05; **P < 0.01. RT-qPCR reverse transcription-quantitative polymerase chain reaction, PT para-tumor brain tissue, WHO World Health Organization, LGG low-grade glioma, GBM glioblastoma multiforme, TCGA The Cancer Genome Atlas, RSEM RNA-seq by expectation maximization, IHC immunohistochemistry

Similar articles

Cited by

References

    1. Wesseling P, Capper D. WHO 2016 classification of gliomas. Neuropathol Appl Neurobiol. 2018;44(2):139–150. doi: 10.1111/nan.12432. - DOI - PubMed
    1. Batash R, Asna N, Schaffer P, Francis N, Schaffer M. Glioblastoma multiforme, diagnosis and treatment; recent literature review. Curr Med Chem. 2017;24:3002–3009. doi: 10.2174/0929867324666170516123206. - DOI - PubMed
    1. Stupp R, Hegi ME, Mason WP, van den Bent MJ, Taphoorn MJB, Janzer RC, et al. Effects of radiotherapy with concomitant and adjuvant temozolomide versus radiotherapy alone on survival in glioblastoma in a randomised phase III study: 5-year analysis of the EORTC-NCIC trial. Lancet Oncol. 2009;10:459–466. doi: 10.1016/S1470-2045(09)70025-7. - DOI - PubMed
    1. Touat M, Idbaih A, Sanson M, Ligon KL. Glioblastoma targeted therapy: updated approaches from recent biological insights. Ann Oncol. 2017;28:1457–1472. doi: 10.1093/annonc/mdx106. - DOI - PMC - PubMed
    1. Barth RF, Zhang Z, Liu T. A realistic appraisal of boron neutron capture therapy as a cancer treatment modality. Cancer Commun (Lond). 2018;38(1):36. doi: 10.1186/s40880-018-0280-5. - DOI - PMC - PubMed

Publication types

MeSH terms