. 2019 Dec 17;116(51):25602-25613.
doi: 10.1073/pnas.1915562116. Epub 2019 Dec 3.

Molecular determinants of chaperone interactions on MHC-I for folding and antigen repertoire selection

Affiliations

Molecular determinants of chaperone interactions on MHC-I for folding and antigen repertoire selection

Andrew C McShan et al. Proc Natl Acad Sci U S A. .

Abstract

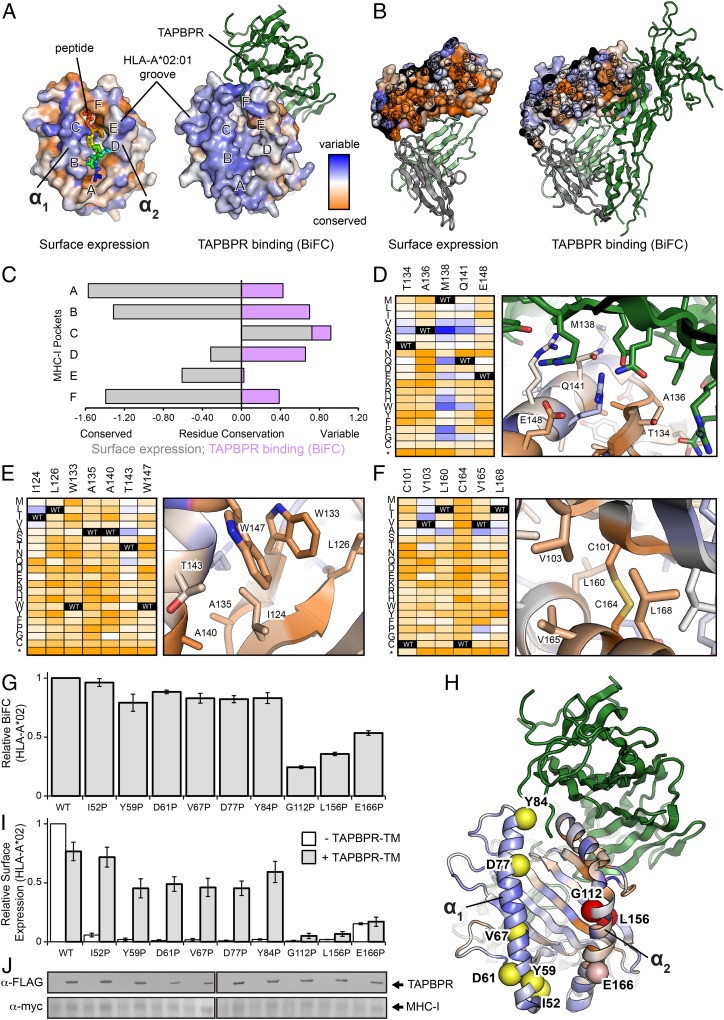
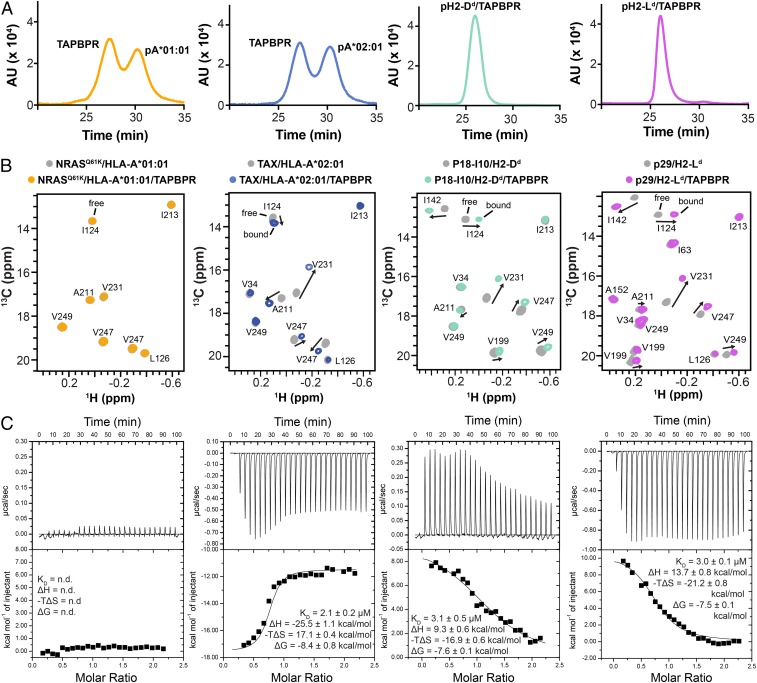
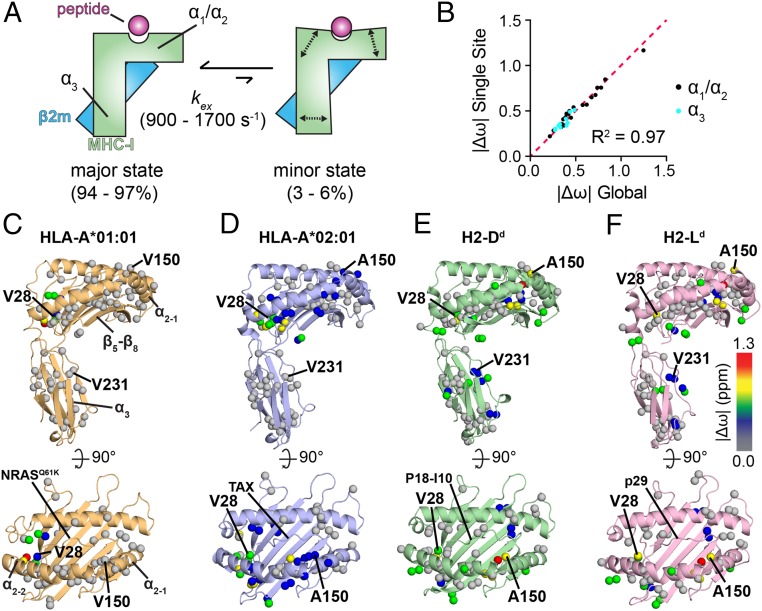
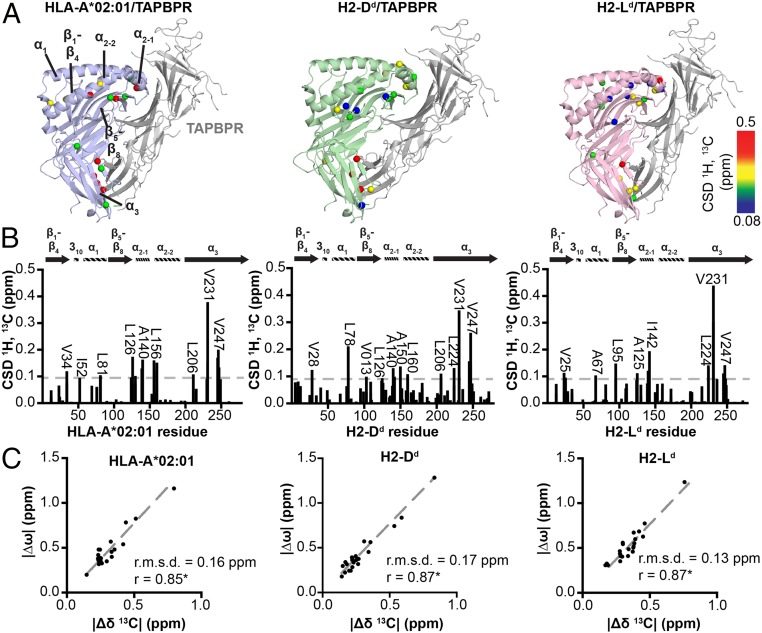
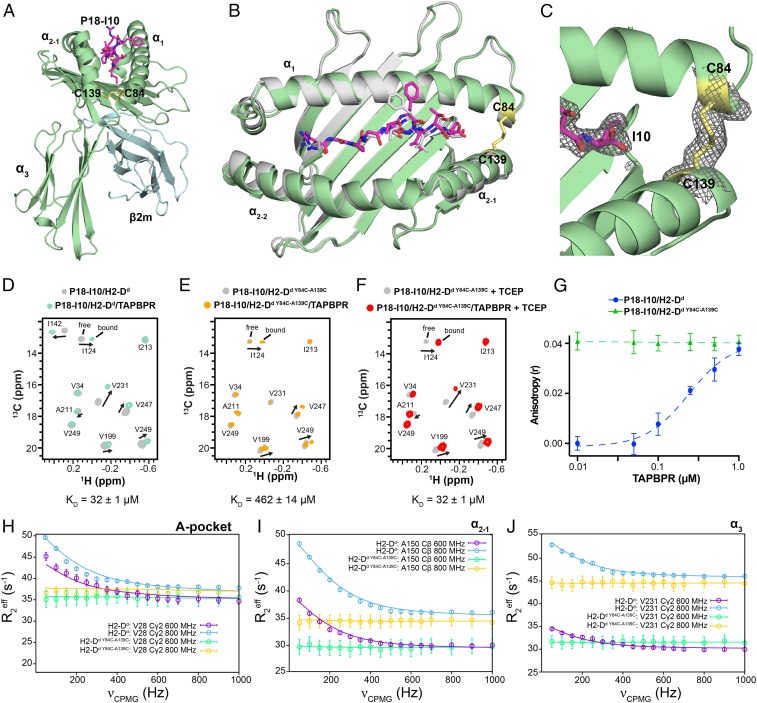
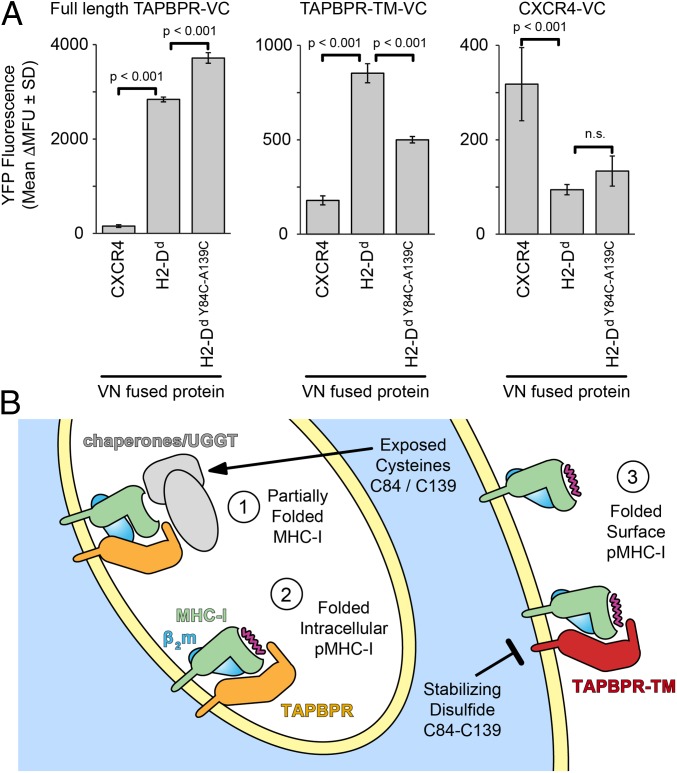
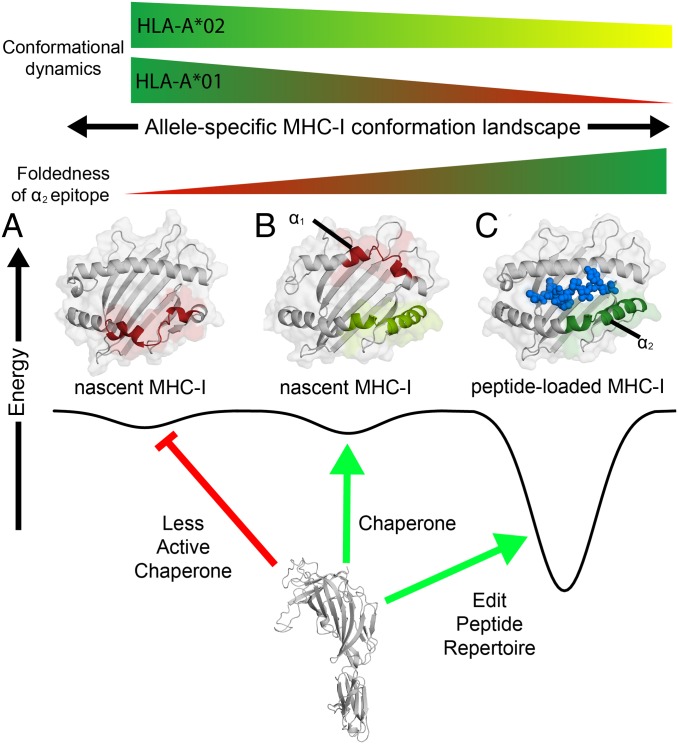
The interplay between a highly polymorphic set of MHC-I alleles and molecular chaperones shapes the repertoire of peptide antigens displayed on the cell surface for T cell surveillance. Here, we demonstrate that the molecular chaperone TAP-binding protein related (TAPBPR) associates with a broad range of partially folded MHC-I species inside the cell. Bimolecular fluorescence complementation and deep mutational scanning reveal that TAPBPR recognition is polarized toward the α2 domain of the peptide-binding groove, and depends on the formation of a conserved MHC-I disulfide epitope in the α2 domain. Conversely, thermodynamic measurements of TAPBPR binding for a representative set of properly conformed, peptide-loaded molecules suggest a narrower MHC-I specificity range. Using solution NMR, we find that the extent of dynamics at "hotspot" surfaces confers TAPBPR recognition of a sparsely populated MHC-I state attained through a global conformational change. Consistently, restriction of MHC-I groove plasticity through the introduction of a disulfide bond between the α12 helices abrogates TAPBPR binding, both in solution and on a cellular membrane, while intracellular binding is tolerant of many destabilizing MHC-I substitutions. Our data support parallel TAPBPR functions of 1) chaperoning unstable MHC-I molecules with broad allele-specificity at early stages of their folding process, and 2) editing the peptide cargo of properly conformed MHC-I molecules en route to the surface, which demonstrates a narrower specificity. Our results suggest that TAPBPR exploits localized structural adaptations, both near and distant to the peptide-binding groove, to selectively recognize discrete conformational states sampled by MHC-I alleles, toward editing the repertoire of displayed antigens.

Keywords: NMR spectroscopy; major histocompatibility complex; molecular chaperone; peptide editing; peptide repertoire.


Conflict of interest statement

The authors declare no competing interest.

Figures

Fig. 1.
Fig. 1.
TAPBPR recognizes a local conformation of the HLA-A*02:01 α2 domain. (A) Sequence conservation from deep mutagenesis mapped to the surface of HLA-A*02:01. Conserved residues are colored in dark orange, while residues exhibiting mutational tolerance in pale and blue. Residue conservation for HLA-A*02:01 surface expression is shown on the structure of the free pMHC-I molecule (PDB ID code 1HHJ), with bound nonamer peptide colored from blue (residue 1) to red (residue 9). HLA-A*02:01 conservation for TAPBPR (dark green) binding is plotted on the structure of the empty MHC-I, in complex with TAPBPR (PDB ID code 5WER). The location of the A- to F-pockets of the MHC-I groove are noted. (B) Cross sections through the core of the α2 domain, colored by conservation as in A. TAPBPR is dark green, β2m is pale green, and the α3 domain is gray. (C) Conservation and variation of residues in the MHC-I pockets for surface expression (gray) or TAPBPR binding by BiFC (purple). (DF) Heat maps of mutation log2 enrichment ratios for HLA-A*02:01/TAPBPR BiFC (depleted mutations are orange, enriched mutations are dark blue) shown alongside modeled structures of the (D) α2 domain/TAPBPR interface, (E) the hydrophobic core between the α2–1 helix and β-sheet, and (F) the core between the α2–2 helix and β-sheet. (G) Relative BiFC signal between TAPBPR-TM-VC and MHC-I–VN for different proline substitutions in either the α1 or α2 helices, or β-sheet underlying the α2 helix. (H) Location of proline substitutions on the MHC-I groove mapped onto the TAPBPR complex structure (PDB ID code 5WER). (I) Relative surface expression for the different MHC-I proline substitutions in the presence or absence of TAPBPR-TM. (J) Immunoblots comparing total expression levels for TAPBPR-TM (α-FLAG) and HLA-A*02:01 (α-myc) constructs. Lanes are aligned with graphs above.
Fig. 2.
Fig. 2.
TAPBPR interactions with peptide-loaded MHC-I molecules are allele-dependent. (A) SEC traces of 1:1 molar ratio of TAPBPR with different pMHC-I heavy chains, each refolded with human β2m and a high-affinity peptide. (B) Representative 2D 1H-13C HMQC spectra of heavy-chain 13C AILV methyl labeled pMHC-I at 105 μM without TAPBPR (gray) and in the presence of 3-fold molar excess TAPBPR. From left to right: NRASQ61K/HLA-A*01:01/hβ2m (orange), TAX/HLA-A*02:01/hβ2m (blue), P18-I10/H2-Dd/hβ2m (green), and NIH/H2-Ld/hβ2m (purple). Experiments were performed at a 1H NMR field of 800 MHz at 25 °C. Arrows indicate significant chemical-shift changes in MHC-I heavy-chain NMR resonances upon TAPBPR binding. (C) Representative ITC data titrating ∼100 to 150 μM pMHC-I (from Left to Right: NRASQ61K/HLA-A*01:01, TAX/HLA-A*02:01, P18-I10/H2-Dd, and p29/H2-Ld) into a sample containing 12 μM TAPBPR and 1 mM peptide. Black lines are the fits of the isotherm. Fitted values for KD, ΔH, -TΔS, and ΔG were determined using a 1-site binding model. n.d., not determined. Errors were determined from experimental replicates (n = 2).
Fig. 3.
Fig. 3.
Dynamic profiles of different pMHC-I molecules probed by methyl NMR. (A) Summary of microsecond to millisecond timescale conformational exchange of peptide-bound MHC-I molecules between a major, ground state and a minor, excited state. Experimentally determined populations of the major and minor states and the exchange rate (kex) are noted in SI Appendix, Table S2. (B) Comparison of |Δω| values obtained from a global fit of CPMG data for all sites together (x axis) or independent fits of each site (y axis), shown for methyl groups in the groove (black) or α3 domain (cyan). (CF) The sites that participate in the global conformational exchange process are represented as spheres on the structure of each pMHC-I viewed from the side (Upper) or above the groove (Lower). hβ2m is omitted for clarity. (C) NRASQ61K/HLA-A*01:01/hβ2m (PDB ID 6MPP), orange; (D) TAX/HLA-A*02:01/hβ2m (PDB ID code 1DUZ) (32), blue; (E) P18-I10/H2-Dd/hβ2m (PDB ID code 3ECB) (30), green; and (F) NIH/H2-Ld/hβ2m (PDB ID code 1LD9) (29), purple. Methyl groups undergoing dispersion are shown as spheres and color-coded based on |Δω| values obtained from a global fit of each pMHC-I. Methyl sites of increased dynamics are shown with warmer colors.
Fig. 4.
Fig. 4.
Dynamic surfaces of pMHC-I structures correlate with TAPBPR recognition sites. (A) Methyl CSDs upon chaperone binding plotted onto the structure of MHC-I/TAPBPR complexes: TAX/HLA-A*02:01/hβ2m (blue), P18-I10/H2-Dd/hβ2m (green), and NIH/H2-Ld/hβ2m (pink) with TAPBPR shown in gray. The H2-Dd/TAPBPR crystal structure was obtained from PDB ID 5WER. The other structures are Rosetta homology models using PDB ID 5WER as a template (70). Affected regions are labeled. ΔCSDs are colored based on the scale shown at right. (B) Methyl CSDs measured from NMR titration experiments upon TAPBPR binding are shown as a function of heavy-chain methyl residue number. Select methyl groups affected are noted. The gray dotted line represents the average CSD + 1 SD. (C) The absolute value of the difference in the 13C chemical shift of the major and minor states of unchaperoned pMHC-I obtained from CPMG relaxation dispersion data (|Δω|, ppm) is shown as a function of the absolute value of the difference in the 13C chemical shift between the free and TAPBPR bound pMHC-I states determined from NMR titrations (|Δδ13C|, ppm). The slope (dotted gray line), the Pearson correlation coefficient (r), and the root mean square deviation (r.m.s.d.) are given for each correlation graph. The correlations are statistically significant with a P < 0.0001. HLA-A*01:01 is not included because there is no detectable TAPBPR binding under the NMR sample conditions (see Fig. 2).
Fig. 5.
Fig. 5.
Restriction of dynamics in the pMHC-I groove abrogates binding to TAPBPR. (A) View of the P18-I10/H2-Dd Y84C-A139C/hβ2m complex solved at 2.4-Å resolution (PDB ID code 6NPR). The H2-Dd heavy chain is colored green, hβ2m cyan and P18-I10 magenta. The oxidized disulfide bond between C84 and C139 of H2-Dd is shown in yellow. (B) Overlay of the MHC-I groove (residues 1 to 180) and bound P18-I10 peptide for wild-type H2-Dd (PDB ID code 3ECB, gray) and H2-Dd Y84C-A139C (colored as in A). The α3 domain and hβ2m are omitted for clarity. Backbone r.m.s.d. over the entire pMHC-I is 1.4/1.7 Å; (backbone/all-atom). (C) View of the P18-I10/H2-Dd Y84C-A139C structure showing the 2FoFc electron density map at 1.0 σ (gray mesh) around the P18-I10 peptide (magenta) and C84-C139 disulfide bond (yellow). (DF) Representative 2D 1H-13C HMQC spectra from NMR titrations between TAPBPR and isotopically labeled (at the heavy chain) (D) wild-type P18-I10/H2-Dd/hβ2m, (E) P18-I10/H2-Dd Y84C-A139C/hβ2m, and (F) P18-I10/H2-Dd Y84C-A139C/hβ2m in the presence of 1 mM TCEP. The NMR spectra shown were performed with 3-fold molar excess TAPBPR. Dissociation constants obtained from NMR line shape fitting in TITAN are noted. (G) Fluorescence anisotropy experiments comparing exchange of TAMRA-labeled P18-I10 peptide with wild-type H2-Dd and H2-Dd Y84C-A139C as a function of TAPBPR concentration. (HJ) Comparison of representative 13C-SQ CPMG relaxation dispersion profiles for methyl groups of the heavy chain between wild-type P18-I10/H2-Dd/hβ2m (800 MHz, blue; 600 MHz, purple) and P18-I10/H2-Dd Y84C-A139C/hβ2m (800 MHz, yellow; 600 MHz, green) performed at 25 °C. Both experiments were performed in the presence of 3-fold molar excess P18-I10 peptide.
Fig. 6.
Fig. 6.
Restriction of MHC-I dynamics diminishes TAPBPR association on a cell membrane. (A) Cells were cotransfected with VC-fused FLAG-TAPBPR (Left), FLAG-TAPBPR-TM (Center), or FLAG-CXCR4 (Right), and with VN-fused myc-H2-Dd or myc-CXCR4. Yellow fluorescence (shown as average Δmean fluorescence units ± SD, n = 4) was measured after gating for equivalent expression levels. P values are calculated from 2-tailed Student’s t test. n.s., not significant. (B) Nascent MHC-I (step 1) within intracellular compartments associates with quality control machinery. The presence of additional, partially reduced cysteines is hypothesized to enhance chaperone associations, including direct or indirect recruitment of TAPBPR. As MHC-I completes its folding, it may transiently interact with TAPBPR (step 2) before mature pMHC-I traffics to the plasma membrane (step 3). The stabilizing disulfide diminishes direct interactions between folded pMHC-I molecules and TAPBPR.
Fig. 7.
Fig. 7.
Chaperone recognition of a dynamic MHC-I conformational landscape. Conceptual example of the interaction between the chaperone TAPBPR and different MHC-I conformations of varying energetic and structural features. The vertical axis is free energy and the horizontal axis represents the conformational landscape of the MHC-I, which is influenced by specific polymorphisms in the MHC-I groove (α12) and α3 domains. (A) TAPBPR does not associate with an MHC-I state comprising a misfolded α2 domain (red). (B) In the chaperoning function, TAPBPR interacts with nascent MHC-I conformations consisting of a folded α2 domain (light green) with an oxidized disulfide bond between the conserved Cys-101/164, even if the α1 domain remains in a misfolded state (red). (C) As a peptide editor, TAPBPR recognizes properly conformed molecules loaded with peptides toward exchange of the bound peptide cargo, for those alleles that exhibit μs-ms time scale conformational dynamics at the α2–1 helix (green). The peptide in the properly conformed pMHC-I state is shown as blue spheres.

References

    1. Rock K. L., Reits E., Neefjes J., Present yourself! By MHC class I and MHC class II molecules. Trends Immunol. 37, 724–737 (2016). - PMC - PubMed
    1. Thomas C., Tampé R., Proofreading of peptide-MHC complexes through dynamic multivalent interactions. Front. Immunol. 8, 65 (2017). - PMC - PubMed
    1. Neerincx A., Boyle L. H., Properties of the tapasin homologue TAPBPR. Curr. Opin. Immunol. 46, 97–102 (2017). - PubMed
    1. Hermann C., et al. , TAPBPR alters MHC class I peptide presentation by functioning as a peptide exchange catalyst. eLife 4, e09617 (2015). - PMC - PubMed
    1. Neerincx A., et al. , TAPBPR bridges UDP-glucose:glycoprotein glucosyltransferase 1 onto MHC class I to provide quality control in the antigen presentation pathway. eLife 6, e23049 (2017). - PMC - PubMed

Publication types

MeSH terms

Associated data