. 2019 Dec 3;12(610):eaax2057.
doi: 10.1126/scisignal.aax2057.

Biased M1 receptor-positive allosteric modulators reveal role of phospholipase D in M1-dependent rodent cortical plasticity

Affiliations

Biased M1 receptor-positive allosteric modulators reveal role of phospholipase D in M1-dependent rodent cortical plasticity

Sean P Moran et al. Sci Signal. .

Abstract

Highly selective, positive allosteric modulators (PAMs) of the M1 subtype of muscarinic acetylcholine receptor have emerged as an exciting new approach to potentially improve cognitive function in patients suffering from Alzheimer's disease and schizophrenia. Discovery programs have produced a structurally diverse range of M1 receptor PAMs with distinct pharmacological properties, including different extents of agonist activity and differences in signal bias. This includes biased M1 receptor PAMs that can potentiate coupling of the receptor to activation of phospholipase C (PLC) but not phospholipase D (PLD). However, little is known about the role of PLD in M1 receptor signaling in native systems, and it is not clear whether biased M1 PAMs display differences in modulating M1-mediated responses in native tissue. Using PLD inhibitors and PLD knockout mice, we showed that PLD was necessary for the induction of M1-dependent long-term depression (LTD) in the prefrontal cortex (PFC). Furthermore, biased M1 PAMs that did not couple to PLD not only failed to potentiate orthosteric agonist-induced LTD but also blocked M1-dependent LTD in the PFC. In contrast, biased and nonbiased M1 PAMs acted similarly in potentiating M1-dependent electrophysiological responses that were PLD independent. These findings demonstrate that PLD plays a critical role in the ability of M1 PAMs to modulate certain central nervous system (CNS) functions and that biased M1 PAMs function differently in brain regions implicated in cognition.


Conflict of interest statement

Competing interests: P.J.C., C.W.L., and C.M.N. are inventors on patents (AU2012328476; EP2770997; CA2853826; US9,586,964; and US8,772,509) that protect different classes of muscarinic acetylcholine receptor allosteric modulators. All other authors declare that they have no competing interests.

Figures

Fig. 1.
Fig. 1.. M1 receptor activation leads to PLD activity in hM1-CHO cells, and M1 PAMs show differential signal bias in potentiating M1-mediated PLD signaling.
(A) rM1-CHO cells were treated with DMSO (basal) or 100 µM CCh alone or in combination with 2 µM VU0255035 (M1 antagonist), 2 µM ML299 (PLD1,2 inhibitor), 1 µM VU0359595 (PLD1 inhibitor), or 750 nM VU0364739 (PLD2 inhibitor). PLD activity was measured by quantification of the PLD product pButanol. The extent of PLD activity in response to 100 µM CCh alone was set at 100%. The effects of the M1 receptor antagonist or various pharmacological inhibitors of PLD were compared to the maximal effect elicited by 100 µM CCh (one-way ANOVA F4,10 = 29.34; P = 0.0001, with post hoc Dunnett’s test using 100 µM CCh alone as the control group, ***P < 0.001). (B) Structures of the M1 receptor PAMs VU0453595, VU0405652, and VU0405645. (C) rM1-CHO cells were treated with an EC20 concentration of ACh in the presence of the indicated concentrations of VU0453595, VU0405652, and VU0405645 and then were assayed for Ca2+ signaling with the Functional Drug Screening System (FDSS7000). (D) Using rM1-CHO cells under the same conditions described earlier, the extent of PLD activation relative to a maximal response of 100 µM CCh alone was evaluated for 4 µM CCh in the presence of DMSO, 10 µM VU0453595, 10 µM VU0405652, or 10 µM VU0405645 (one-way ANOVA F3,8 = 55.1; P = 0.0001, with post hoc Dunnett’s test using 4 µM CCh; *P < 0.05, **P < 0.01, and ***P < 0.001). Data in (A), (C), and (D) are means ± SEM from three independent experiments each performed in triplicate.
Fig. 2.
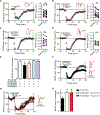
Fig. 2.. PLD1, but not PLD2, is necessary for CCh-dependent LTD in the mPFC.
(A) Schematic of the field excitatory postsynaptic potentials (fEPSPs) recorded from layer V of the mouse mPFC in response to electrical stimulation in the superficial layers II to III. (B) Time course graph for fEPSP slope normalized to the average baseline. Carbachol (CCh) (50 µM) induced a long-term depression (LTD) of fEPSP slope [68.0 ± 4.44%, n/N = 26/20 (n = number of slices/N = number of mice)]. (C) Time course graph for fEPSP slope with a 10-min pretreatment with the PLD1,2 inhibitor ML299 (2 µM) followed by a 10-min co-application of ML299 and 50 µM CCh (93.8 ± 6.74%, n/N = 21/10). (D) Time course graph for fEPSP slope normalized to baseline with a 10-min pretreatment with the PLD1-specific inhibitor VU0359595 (370 nM) and 10-min co-application of 50 µM CCh (101 ± 10.1%, n/N = 7/6). (E) Time course graph for fEPSP slope normalized to baseline with a 10-min pretreatment with the PLD2-selective inhibitor VU0364739 (750 nM) and 10-min co-application of 50 µM CCh (69.3 ± 13.0, n/N = 8/4). Insets in (B) to (E) show representative fEPSP traces for each condition for baseline (red trace) and 50 min after CCh washout (black trace). (F) Quantification of the average fEPSP slope 46 to 50 min after drug washout [shaded areas in (B) to (E)] (one-way ANOVA F3,58 = 5.21; P = 0.0029, with post hoc Dunnett’s test using 50 µM CCh alone as the control group; *P < 0.05 and **P < 0.01). (G) Left: Time course graph of fEPSP slope normalized to baseline with bath application of CCh (100 µM) in littermate controls (59.6 ± 6.06 n/N = 9/6) and PLD1 KO mice (92.2 ± 3.21, n/N = 9/6). Right: Representative fEPSP traces for baseline (red trace) and 50 min after CCh washout (black trace) for PLD1 KO animals (top) and littermate controls (bottom). (H) Quantification of the average fEPSP slope 46 to 50 min after drug washout [shaded area in (G)] (Student’s t test; P = 0.0002; ***P < 0.001). (I) Time course graph for fEPSP slope normalized to baseline with 10-min bath application of the group II metabotropic glutamate receptor agonist LY379268 (200 nM) in PLD1 KO mice (59.4 ± 11.4%, n/N = 5/3). (J) Quantification of the average fEPSP slope 46 to 50 min after LY379268 (200 nM) washout [shaded area in (I)] for PLD1 KO mice and littermate controls (55.7 ± 11.6%, n/N = 7/3; Student’s t test; P = 0.828). Inset shows representative fEPSP traces for each condition for baseline (red trace) and 50 min after LY379268 washout (black trace). Scale bars, 0.25 mV (y axis) and 5 ms (x axis). Data are means ± SEM. n.s., not significant.
Fig. 3.
Fig. 3.. Biased M1 PAMs fail to potentiate a submaximal mLTD in the mPFC and actively block CCh-dependent LTD.
(A) Left: Time course graph for fEPSP slope normalized to the average baseline. Right: Comparison of fEPSP slope during baseline and 46 to 50 min after CCh (10 µM) washout (shaded area). A 10-min bath application of CCh (10 µM) induced a minimal LTD of fEPSP slope (88.9 ± 6.05, n/N = 15/13; paired t test; P > 0.05). (B) A 10-min pretreatment with the nonbiased M1 PAM VU0453595 (10 M) followed by a 10-min co-application of VU0453595 + CCh (10 µM) (81.5 ± 4.70%, n/N = 14/11; paired t test; P = 0.01). (C) A 10-min pretreatment with the biased M1 PAM VU0405652 (10 µM) followed by a 10-min co-application of VU0405652 + 10 µM CCh (93.5 ± 3.28%, n/N = 9/8; paired t test; P > 0.05). (D) A 10-min pretreatment with the biased M1 PAM VU0405645 (10 µM) followed by a 10-min co-application of VU0405645 + CCh (10 µM) (91.9 ± 4.67%, n/N = 7/7; paired t test; P > 0.05). Insets contain representative fEPSP traces for each condition for baseline (red trace) and 50 min after CCh washout (black trace). Scale bars, 0.5 mV and 5 ms. Data are means ± SEM. **P ≤ 0.01. (E) Summary of the last 5 min of the recordings from the time course experiments (&P < 0.05, paired t test). (F) Left: Time course graph for fEPSP slope normalized to the average baseline. CCh (50 µM, black) (70.0 ± 7.78%, n/N = 9/7) alone compared to a 10-min pretreatment with VU0405645 (10 µM) and a 10-min co-application of CCh (50 µM, white) (101 ± 8.59%, n/N = 11/8). Right: Representative fEPSP traces for each condition for baseline (red trace) and 50 min after CCh washout (black trace). Scale bars, 0.5 mV and 5 ms. (G) Time course graph of normalized fEPSP slope of a 10-min pretreatment with VU0405652 (75 µM) and 10-min application of CCh (50 µM, red) (102 ± 9.46%, n/N = 7/3) compared to CCh alone [shaded time course corresponds to CCh (50 µM) from (F); the solid white line represents the mean fEPSP slope, and the gray shaded region around the line shows ±SEM]. (H) Quantification of the average fEPSP slope 46 to 50 min after CCh washout (shaded area) (one-way ANOVA F3,25 = 4.554; P = 0.0216, with post hoc Dunnett’s test using CCh alone as the control group; *P < 0.05).
Fig. 4.
Fig. 4.. PLD is not required for the M1-dependent increase in sEPSC frequency in mPFC layer V pyramidal neurons, and both biased and nonbiased M1 PAMs potentiate this response.
(A) Sample traces (left) and the cumulative probability of interevent interval (IEI) (right) of sEPSCs during baseline and during application of CCh (100 µM) as indicated for a typical cell. (B) Sample traces (left) and the IEI cumulative probability (right) of sEPSCs in baseline with the PLD1,2 inhibitor ML299 (2 µM) and during application of a combination of ML299 and CCh (100 µM) for a typical cell. (C) Quantification of the average increase in sEPSC frequency between treatment with CCh alone [357.0 ± 81.6%, n/N = 7/3 (n = number of cells/N = number of animals)] and CCh in the presence of ML299 (427.0 ± 76.5%, n/N = 8/3) (Student’s t test; P > 0.05). (D) Sample traces (left) and IEI cumulative probability (right) of sEPSCs in baseline and during application of CCh (10 µM) from a typical cell. (E to G) Sample traces (left) and IEI cumulative probability (right) of sEPSCs in baseline, during application of the indicated PAM, and during treatment with a PAM and CCh as indicated for typical cells. (H) Quantification of the peak effect on sEPSC frequency for CCh (10 µM) alone (147 ± 15.4%, n/N = 7/3), CCh with VU0453595 (10 µM) (416 ± 38.2%, n/N = 8/4), CCh with VU0405652 (10 µM) (316 ± 43.3%, n/N = 10/5), and CCh with VU0405645 (10 µM) (332.4 ± 63.7%, n/N = 11/4). One-way ANOVA F3,35 = 5.77; P = 0.0026, with post hoc Dunnett’s test using CCh alone as the control group; *P < 0.05 and **P < 0.01. Data are means ± SEM. (I) Schematic of whole-cell recordings from mPFC layer V pyramidal neurons (regular spiking cells) clamped at −70 mV.
Fig. 5.
Fig. 5.. PLD is not necessary for M1-dependent effects on the excitability of striatal SPNs, and both biased and nonbiased M1 PAMs potentiate this response.
(A) Sample traces of membrane potential responses to a depolarization current step from an SPN during baseline and in the presence of DMSO and CCh (10 µM). (B) Effect of pretreatment with ML299 (2 µM) and then co-application of CCh (10 µM) on SPN excitability. (C) Bar graph summarizing the changes in the number of spikes per pulse after CCh (10 µM) application in the presence of ML299 (12.0 ± 3.38, n/N = 6/5) or DMSO (16.9 ± 4.67, n/N = 5/5) showed no statistically significant difference between groups (Student’s t test; P > 0.05). (D to G) Sample traces of membrane potential responses to a depolarization current step from an SPN during baseline, in the presence of the indicated M1 PAM (3 µM) or DMSO, and then M1 PAM/DMSO + CCh (0.5 µM). (H) Bar graph summarizing the changes in the number of spikes per pulse after CCh (0.5 µM) application in the presence of DMSO (1.83 ± 0.49, n/N = 9/7), VU0453595 (14.2 ± 3.05, n/N = 6/6), VU0405652 (9.02 ± 2.31, n/N = 7/6), and VU0405645 (9.00 ± 2.37, n/N = 6/5) (one-way ANOVA F3,24 = 6; P = 0.0017, with post hoc Dunnett’s test using CCh + DMSO as the control group; *P < 0.05 and ***P < 0.001). Data are means ± SEM. (I) Schematic of whole-cell recordings from SPN neurons under current clamp conditions performed in the dorsal lateral striatum (DLS).

Similar articles

Cited by

References

    1. Masters CL, Bateman R, Blennow K, Rowe CC, Sperling RA, Cummings JL, Alzheimer’s disease. Nat. Rev. Dis. Primers 1, 15056 (2015). - PubMed
    1. Lieberman JA, M. B, Psychotic disorders. N. Engl. J. Med 379, 270–280 (2018). - PubMed
    1. Scarr E, Hopper S, Vos V, Seo MS, Everall IP, Aumann TD, Chana G, Dean B, Low levels of muscarinic M1 receptor-positive neurons in cortical layers III and V in Brodmann areas 9 and 17 from individuals with schizophrenia. J. Psychiatry Neurosci 43, 338–346 (2018). - PMC - PubMed
    1. Euston DR, Gruber AJ, McNaughton BL, The role of medial prefrontal cortex in memory and decision making. Neuron 76, 1057–1070 (2012). - PMC - PubMed
    1. Heinrich JN, Butera JA, Carrick T, Kramer A, Kowal D, Lock T, Marquis KL, Pausch MH, Popiolek M, Sun S-C, Tseng E, Uveges AJ, Mayer SC, Pharmacological comparison of muscarinic ligands: Historical versus more recent muscarinic M1-preferring receptor agonists. Eur. J. Pharmacol 605, 53–56 (2009). - PubMed

Publication types

MeSH terms

LinkOut - more resources