. 2019 Dec 3;12(610):eaav5918.
doi: 10.1126/scisignal.aav5918.

The interaction of ceramide 1-phosphate with group IVA cytosolic phospholipase A2 coordinates acute wound healing and repair

Affiliations

The interaction of ceramide 1-phosphate with group IVA cytosolic phospholipase A2 coordinates acute wound healing and repair

H Patrick MacKnight et al. Sci Signal. .

Abstract

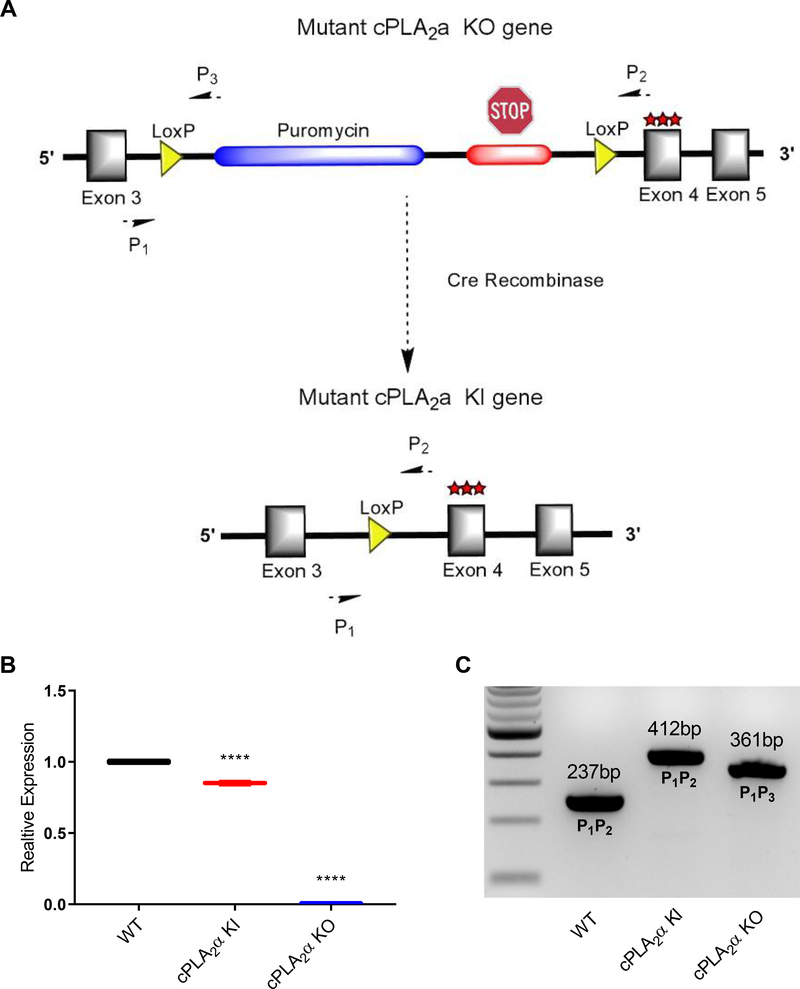
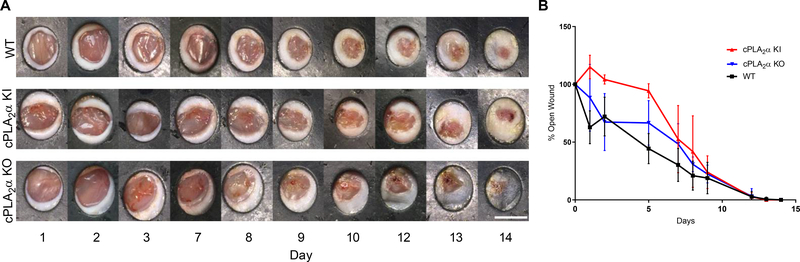
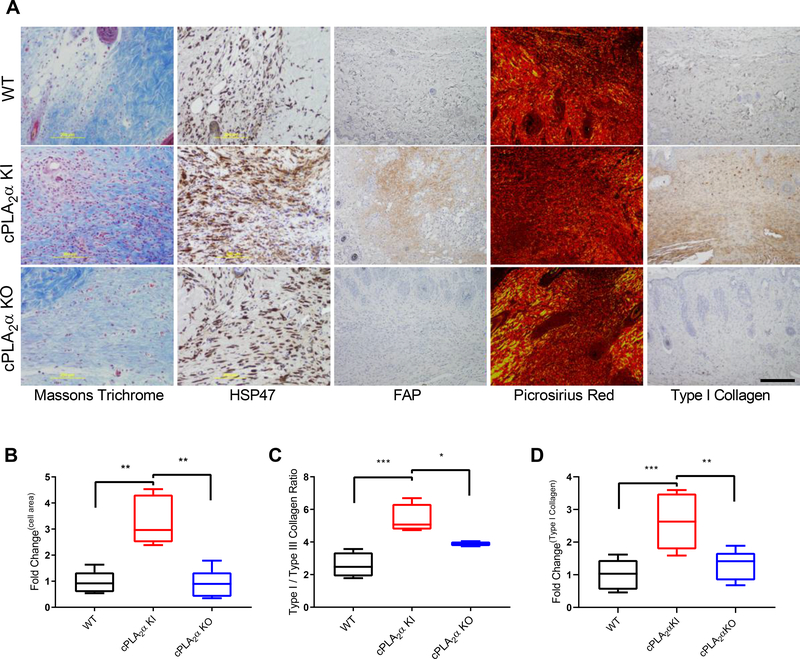
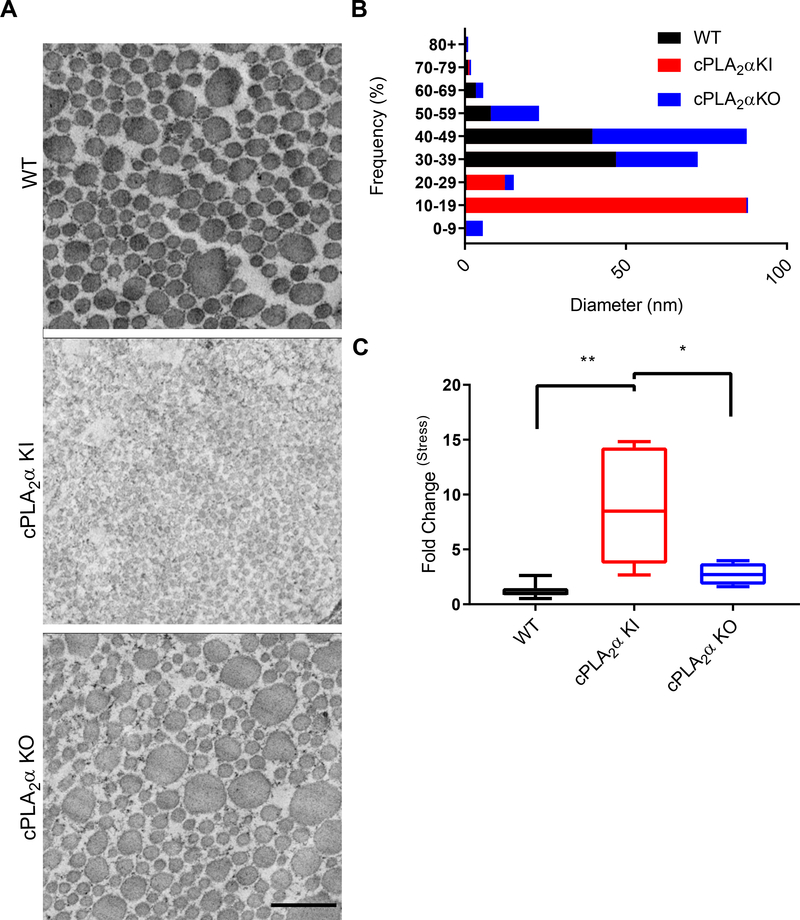
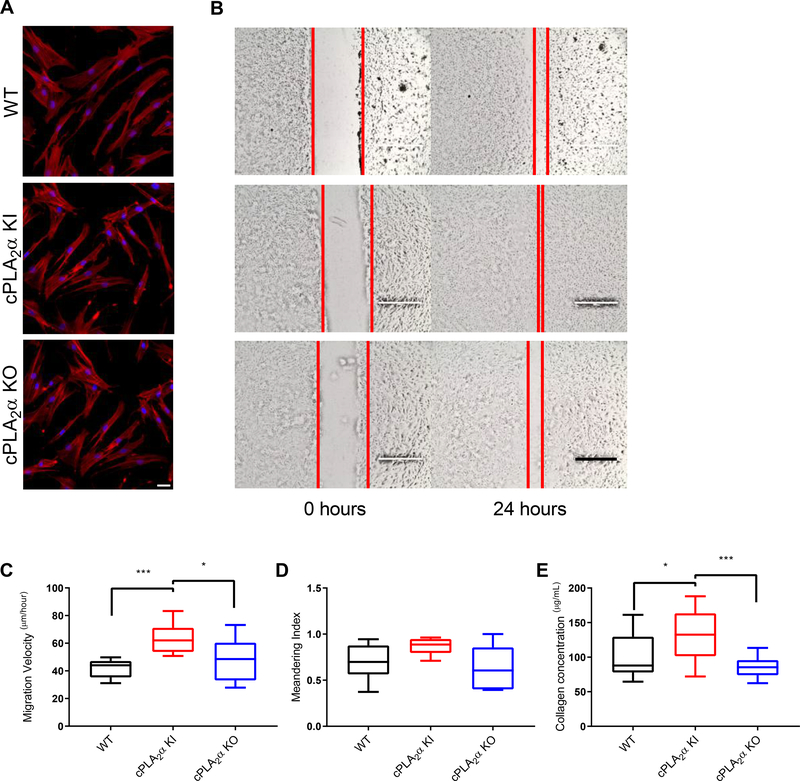
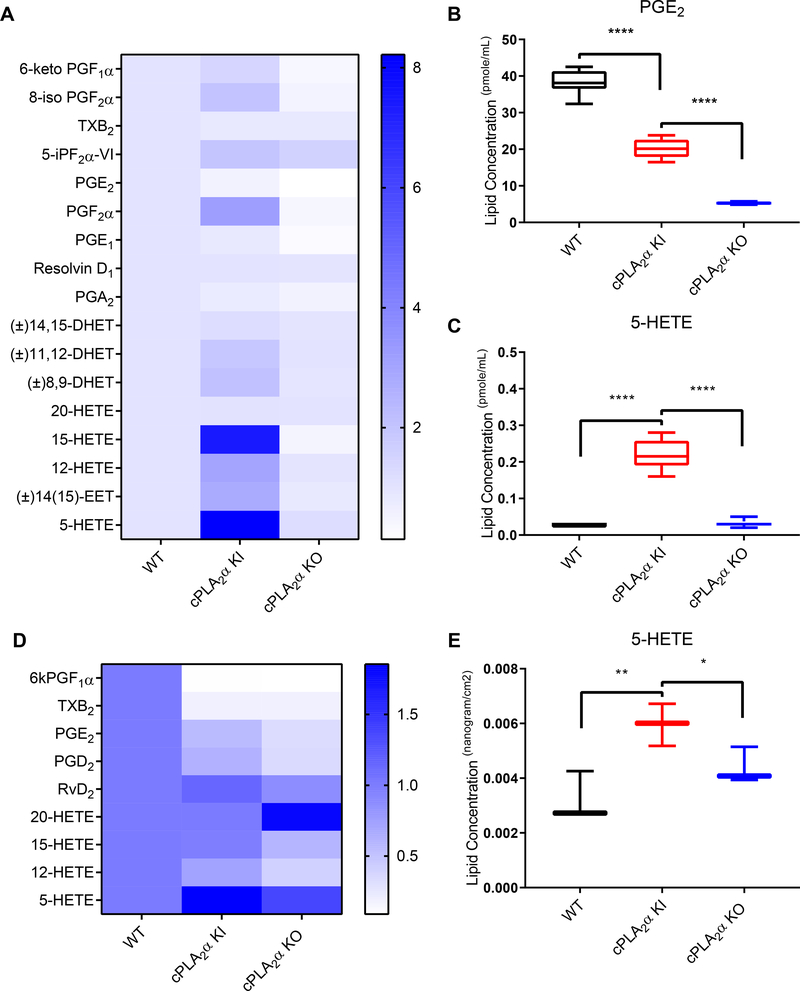
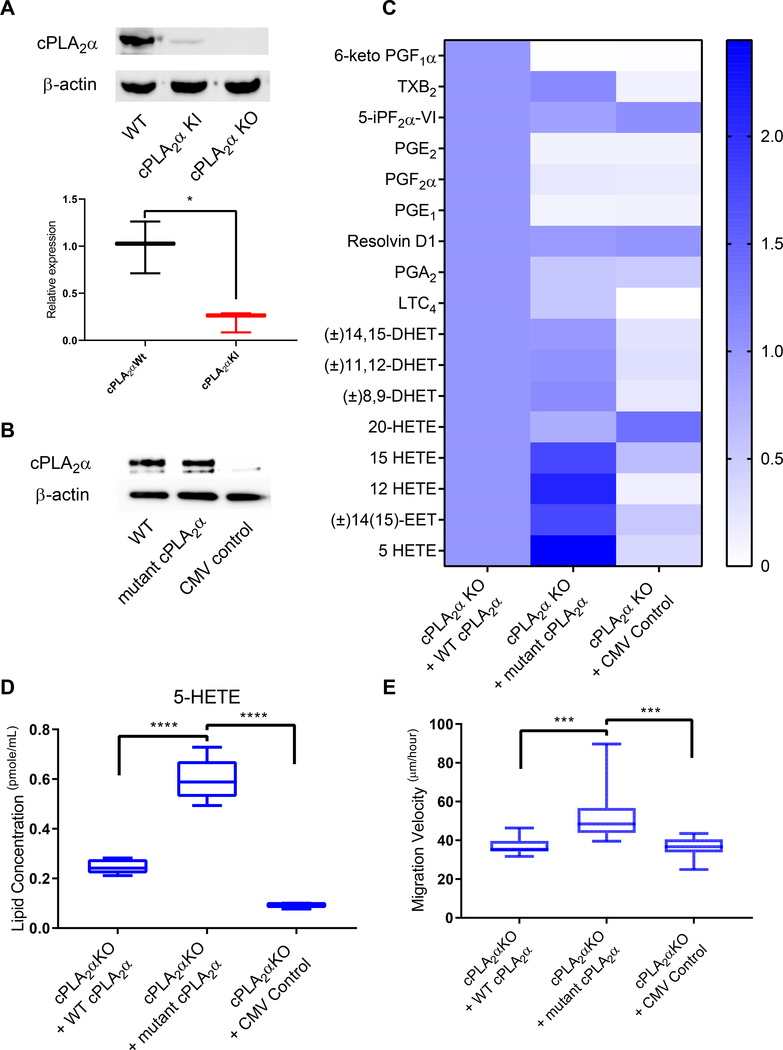
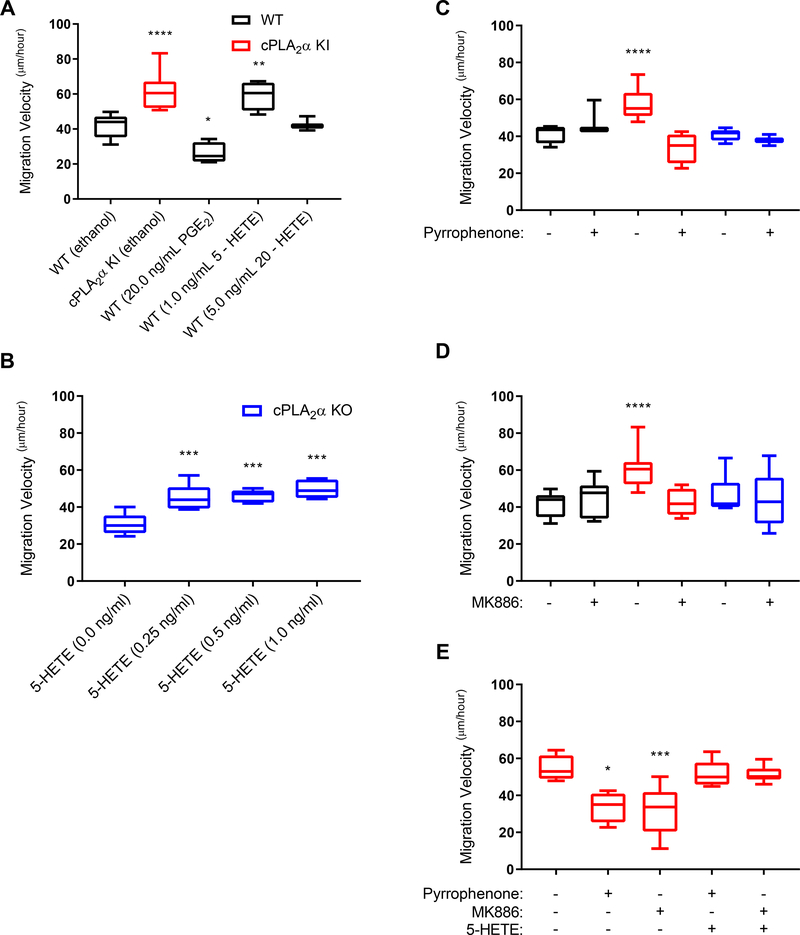
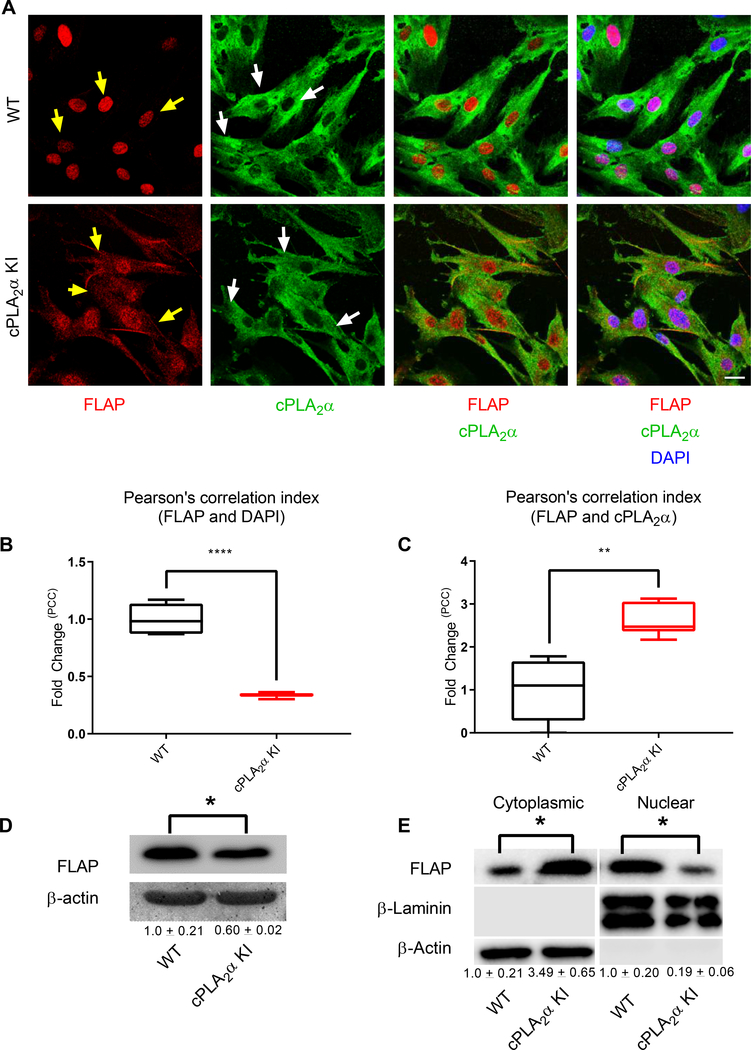
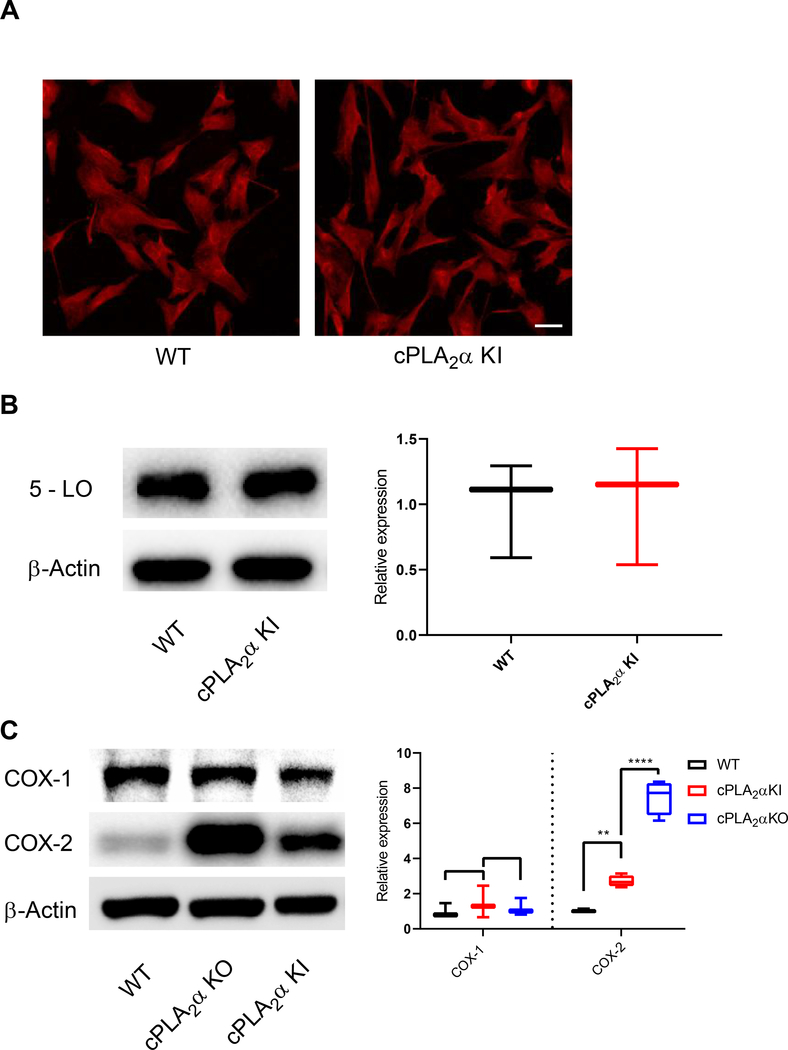
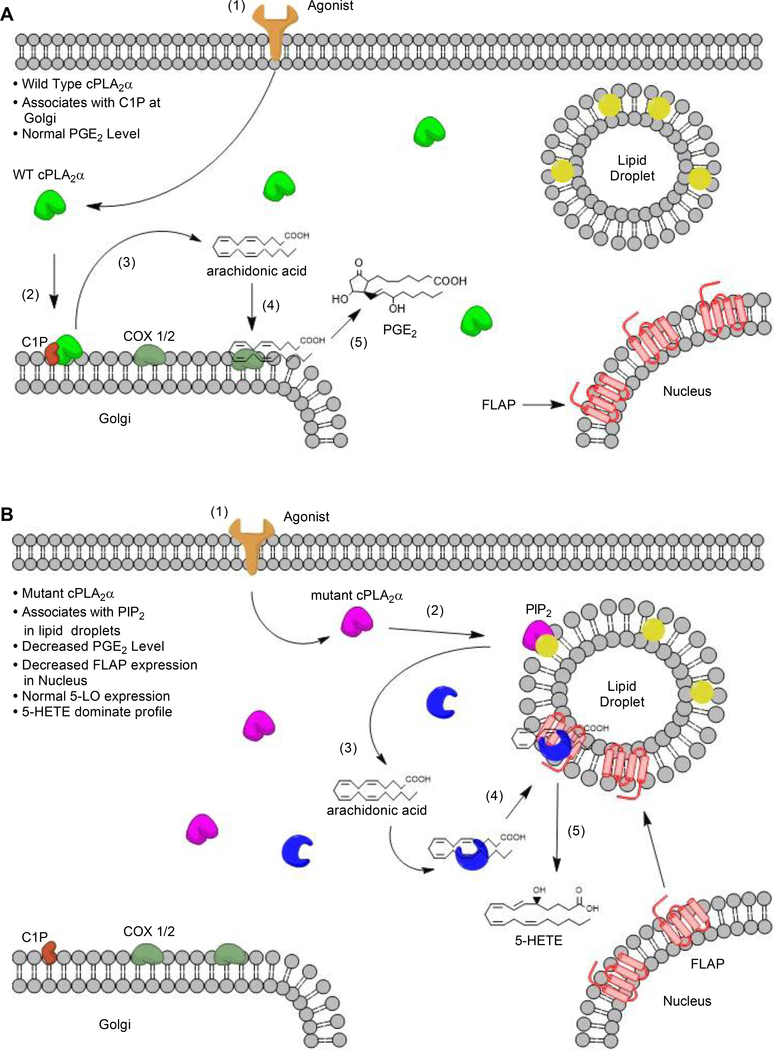
The sphingolipid ceramide 1-phosphate (C1P) directly binds to and activates group IVA cytosolic phospholipase A2 (cPLA2α) to stimulate the production of eicosanoids. Because eicosanoids are important in wound healing, we examined the repair of skin wounds in knockout (KO) mice lacking cPLA2α and in knock-in (KI) mice in which endogenous cPLA2α was replaced with a mutant form having an ablated C1P interaction site. Wound closure rate was not affected in the KO or KI mice, but wound maturation was enhanced in the KI mice compared to that in wild-type controls. Wounds in KI mice displayed increased infiltration of dermal fibroblasts into the wound environment, increased wound tensile strength, and a higher ratio of type I:type III collagen. In vitro, primary dermal fibroblasts (pDFs) from KI mice showed substantially increased collagen deposition and migration velocity compared to pDFs from wild-type and KO mice. KI mice also showed an altered eicosanoid profile of reduced proinflammatory prostaglandins (PGE2 and TXB2) and an increased abundance of certain hydroxyeicosatetraenoic acid (HETE) species. Specifically, an increase in 5-HETE enhanced dermal fibroblast migration and collagen deposition. This gain-of-function role for the mutant cPLA2α was also linked to the relocalization of cPLA2α and 5-HETE biosynthetic enzymes to the cytoplasm and cytoplasmic vesicles. These findings demonstrate the regulation of key wound-healing mechanisms in vivo by a defined protein-lipid interaction and provide insights into the roles that cPLA2α and eicosanoids play in orchestrating wound repair.


Conflict of interest statement

Competing interests: The authors declare that they have no competing interests.

Figures

Fig. 1.
Fig. 1.. cPLA2α KI and KO mice.
(A) Schematic representation of the cassette inserted into intron 3 of the endogenous cPLA2a locus. The cassette contains a puromycin resistance gene followed by a premature stop codon flanked by loxP sites. Insertion of the cassette causes cPLA2α KO. The cassette also contains a triple mutation at the C1P binding site (R57A, K58A, R59A) encoded in exon 4. CRE-mediated recombination excises the puromycin resistance gene and premature stop codon, generating KI mice that produce cPLA2α with the mutated C1P binding site instead of wild-type cPLA2α. (B) RNAs from primary dermal fibroblasts from WT, KI, and KO mice were converted to cDNA and used for quantitative PCR analysis using primers specific to cPLA2a. Samples were compared using ANOVA followed by Tukey’s post-hoc test. Data shown are means ± SD, n = 3–6 mice per genotype, ****P< 0.0001. (C) Genotyping of WT, KI, and KO mice using end point multiplex PCR using primers specific for the WT, KI, and KO alleles.
Fig. 2.
Fig. 2.. Ablation of the C1P-cPLA2α interaction does not affect the wound closure rate in vivo.
(A) Images of acute wounds over 14 days in WT, cPLA2α KI, and cPLA2α KO mice using a previously described stinted excisional wound model (38). Scale bar, 6mm. (B) Wound closure rate was calculated as percent-opened wound for WT, KI, and KO mice over course of 14 days. Samples were compared using ANOVA followed by Tukey’s post-hoc test. Data shown are means ± SD, n = 4–8 mice per genotype.
Fig. 3.
Fig. 3.. Fibroblast infiltration and collagen deposition are increased in wounds in KI mice.
(A) Representative image showing Masson’s trichrome stain, HSP47 distribution, FAP distribution, Picrosirius red staining, and Type I collagen distribution in wound sections from WT, cPLA2α KI, and cPLA2α KO mice 10 days after excisional wounding. Scale bar, 200μm. (B) Graphical representation of FAP+ cells per field. The values are presented relative to that for WT, which was set to 1. (C) Graphical representation of the ratio of type I to type III collagen estimated from polarized light imaging of Picrosirius red –stained wound sections. (D) Graphical representation of the surface area that was positive for type I collagen in wound sections. The values are presented relative to that for WT, which was set to 1. Samples were compared using ANOVA followed by Tukey’s post-hoc test. Data shown are means ± SD, n = 4–7 mice per genotype, *P< 0.05, **P< 0.01, ***P< 0.001, ****P< 0.0001.
Fig. 4.
Fig. 4.. Healed wounds from KI mice have thinner collagen fibers and increased tensile strength.
(A) Transmission electron microscopy (TEM) showing collagen fibers in stinted excisional wounds from WT, cPLA2α KI, and cPLA2α KO mice after 10 days of healing. Scale bar, 500 nm. (B) Graphical representations of collagen fiber diameter measured from TEM images. (C) Quantification of wound tensile strength in 2 cm incisional wounds from WT, KI, and KO mice 10 days after wounding. The values are presented relative to that for WT, which was set to 1. Samples were compared using ANOVA followed by Tukey’s post-hoc test. Data shown are means ± SD, n = 2–3 mice per group for TEM, n = 4–7 mice per group for wound tensile strength, *P< 0.05, **P< 0.01.
Fig. 5.
Fig. 5.. Loss of the C1P-cPLA2α interaction causes an increase in migration velocity and collagen deposition in primary dermal fibroblasts.
(A) Actin distribution in primary dermal fibroblasts (pDFs) collected from WT, cPLA2α KI, and cPLA2α KO mice. Scale bar, 40μm. (B) Monolayers of pDFs from WT, KI, and KO mice were scratch-wounded and followed for 24 hours. Red lines indicate the borders of the scratch wound. Scale bar, 200μm. (C) Migration velocity of pDFs from WT, KI, and KO mice after scratch-wounding. (D) Quantification of cell meandering in scratch-wounded pDFs from WT, KI, and KO mice. (E) Collagen deposition of pDFs from WT, KI, and KO mice. Samples were analyzed for type I collagen levels using an ELISA-based assay for soluble type I collagen. Data were compared using ANOVA followed by Tukey’s post-hoc test. Data shown are means ± SD, n = 6–12 cell isolates per genotype (5–6 mice per genotype were utilized to generate the cell isolates) for migration and meandering assays, n = 15–16 cell isolates per genotype (8–10 mice per genotype were used to generate the cell isolates) for collagen deposition assay, *P< 0.05, **P< 0.01, ***P< 0.001, ****P< 0.0001.
Fig. 6.
Fig. 6.. Genetic ablation of the C1P-cPLA2α interaction alters eicosanoid synthesis in primary dermal fibroblasts and healed excisional wounds.
(A) Complete lipid profile of pDFs from WT, cPLA2α KI, and cPLA2α KO mice shown as fold change in comparison to WT pDFs. (B) Quantification of PGE2 in pDFs from WT, KI, and KO mice. (C) Quantification of 5-HETE in pDFs from WT, KI, and KO mice. (D) Partial lipid profiles from excisional wounds in WT, KI, and KO mice. (E) Quantification of 5-HETE in excisional wounds from WT, KI, and KO mice. Samples were compared using ANOVA followed by Tukey’s post-hoc test. Data shown are means ± SD, n = n = 6–8 cell isolates per genotype (4–5 mice per genotype were used to generate the cell isolates) for (A–C), n = 3 mice (one wound per mouse) per genotype in (D, E). *P< 0.05, **P< 0.01, ***P< 0.001, ****P< 0.0001.
Fig. 7.
Fig. 7.. Expression of mutant cPLA2α reproduces the KI phenotype in KO pDFs.
(A) Immunoblotting and quantification of cPLA2α in pDFs from WT, cPLA2α KI, and cPLA2α KO mice. β-actin is a loading control. n = 3 cell isolates per genotype (3–4 mice per genotype were utilized to generate the cell isolates). (B) Immunoblotting for cPLA2α in cPLA2α KO pDFs in which an adenoviral (CMV) expression system (30) was used to drive expression of WT cPLA2α or C1P-binding mutant cPLA2α. Empty vector is a negative control. Data is representative of n = 3 independent experiments using cells isolated from different cPLA2α KO mice. (C) Lipid profiles of WT and KI pDFs expressing WT or mutant cPLA2α from the CMV vector. (D) Quantification of 5-HETE in KO pDFs expressing WT or mutant cPLA2α from the CMV vector. For (C) and (D), n = 3 (empty CMV control) and n = 9 (WT and mutant cPLA2α) cell isolates from 5 cPLA2α KO mice. (E) Migration velocity in KO pDFs expressing WT or mutant cPLA2α from the CMV vector. n = 12 cell isolates per genotype (6–9 mice per genotype were used to generate the cell isolates). Samples were compared using ANOVA followed by Tukey’s post-hoc test. Data shown are means ± SD*P< 0.05, **P< 0.01, ***P< 0.001, ****P< 0.0001.
Fig. 8.
Fig. 8.. Exogenous eicosanoids and small molecule inhibitors of cPLA2α and FLAP alter the migration velocity of dermal fibroblasts.
(A) Migration velocity of pDFs from WT and cPLA2α mice treated with ethanol or the indicated concentrations of PGE2, 5-HETE, or 20-HETE. (B) Migration velocity of pDFs from KO mice treated with increasing concentrations of 5-HETE. (C–E) Migration velocity of pDFs from WT, KI, and KO mice in the presence of pyrrophenone (C), MK886 (D), or the indicated combinations of pyrrophenone, MK886, and 5-HETE (E). Samples were compared using ANOVA followed by Tukey’s post-hoc test. Data shown are means ± SD, n = 3–10 cell isolates per genotype (3–8 mice per genotype were used to generate the cell isolates) for each treatment group. *P< 0.05, **P< 0.01, ***P< 0.001, ****P< 0.0001.
Fig. 9.
Fig. 9.. Primary dermal fibroblasts from KI mice show altered localization of cPLA2α and FLAP.
(A) Immunofluorescence showing FLAP (nuclear and cytosolic, yellow arrows) and cPLA2α (Golgi/perinuclear and cytosolic, white arrows) in pDFs from WT and cPLA2α KI mice. Nuclei are labelled with DAPI. Scale bar, 40 μm. (B) Cytosolic localization of FLAP correlated to nuclear staining was quantified as fold-change in the Pearson’s Correlation Coefficient (PCC) in KI pDFs relative to that in WT pDFs. (C) C-localization of FLAP with cPLA2α was quantified as fold-change in the PCC in KI pDFs relative to that in WT pDFs. (D) Immunoblotting and quantification (numbers below blots) of FLAP in pDFs from WT and KI mice. (E) Immunoblotting and quantification of FLAP in nuclear and cytoplasmic fractions of WT and KI pDFs. Colocalization was determined using Pearson’s correlation index, samples were compared using unpaired students t-test with Welch’s correction. Data shown are means ± SD, n = 5–6 cell isolates per genotype (4–6 mice per genotype were used to generate the cell isolates) for confocal microscopy, n = 4 cell isolates per genotype (3 mice per genotype were used to generate the cell isolates) for immunoblot analysis, *P< 0.05, **P< 0.01, ***P< 0.001, ****P< 0.0001.
Fig. 10.
Fig. 10.. Dermal fibroblasts from KI mice show no changes in the localization and abundance of 5-lipoxygenase.
(A) Immunofluorescence showing 5 - LO in pDFs from WT and cPLA2α KI mice. Scale bar, 40 μm. (B) Immunoblotting and quantification of 5 - LO in pDFs from WT and KI mice. (C) Immunoblotting and quantification of COX-1 and COX-2 in WT, KI, and KO pDFs. Data shown are means ± SD, n = 5–6 cell isolates per genotype (3–4 mice per genotype were used to generate the cell isolates) for confocal microscopy, n = 3 cell isolates per genotype (3 mice per genotype were used to generate the cell isolates) for immunoblot analysis, *P< 0.05, **P< 0.01, ***P< 0.001, ****P< 0.0001.
Fig. 11.
Fig. 11.. Schematic depiction of the proposed mechanism for C1P-mediated regulation of cPLA2α activity in wound repair.
(A) Under normal conditions, an inflammatory stimulus (for example, proinflammatory cytokines or mechanical trauma) initiates a signal cascade (1) that leads to the activation of cPLA2α and its translocation to intracellular membranes, such as the Golgi apparatus, where it binds to C1P (2). There, cPLA2α preferentially cleaves arachidonic acid–containing phospholipids at the sn-2 position, releasing free fatty acids (3). Free arachidonic acid can be converted by intracellular enzymes such as COX-1 and COX-2 (4) into PGE2 through a multi-step process (5). (B) When cPLA2α cannot bind to C1P, agonist-mediated signaling (1) leads to the activation of cPLA2α and its translocation to intracellular lipid droplets, where it binds to PIP2 (2). There, cPLA2α preferentially cleaves arachidonic acid–containing phospholipids, releasing free fatty acids (3). Free arachidonic acid binds to 5-LO (4), which interacts with FLAP at lipid droplets (4) instead of at the nucleus. FLAP-mediated activation of 5-LO enzymatic activity stimulates the production of 5-HETE, leading to a 5-HETE–dominated eicosanoid profile.

Similar articles

Cited by

References

    1. Enoch S, and Price P. 2004. Pathophysiology-Of-Healing @ www.worldwidewounds.com..
    1. Clark RAF 1988. Wound Repair. In The Molecular and Cellular Biology of Wound Repair Springer US, Boston, MA. 3–50.
    1. Versteeg HH, Heemskerk JWM, Levi M, and Reitsma PH. 2013. New Fundamentals in Hemostasis. Physiol. Rev 93: 327–358. - PubMed
    1. Kim M-H, Liu W, Borjesson DL, Curry F-RE, Miller LS, Cheung AL, Liu F-T, Isseroff RR, and Simon SI. 2008. Dynamics of neutrophil infiltration during cutaneous wound healing and infection using fluorescence imaging. J. Invest. Dermatol 128: 1812–20. - PMC - PubMed
    1. Koh TJ, and DiPietro LA. 2011. Inflammation and wound healing: the role of the macrophage. Expert Rev. Mol. Med 13: e23. - PMC - PubMed

Publication types

MeSH terms