

Spatially Distributed Amyloid-β Reduces Glucose Metabolism in Mild Cognitive Impairment
- PMID: 31796668
- PMCID: PMC7029335
- DOI: 10.3233/JAD-190560
Spatially Distributed Amyloid-β Reduces Glucose Metabolism in Mild Cognitive Impairment
Abstract
Background: Several positron emission tomography (PET) studies have explored the relationship between amyloid-β (Aβ), glucose metabolism, and the APOEɛ4 genotype. It has been reported that APOEɛ4, and not aggregated Aβ, contributes to glucose hypometabolism in pre-clinical stages of Alzheimer's disease (AD) pathology.
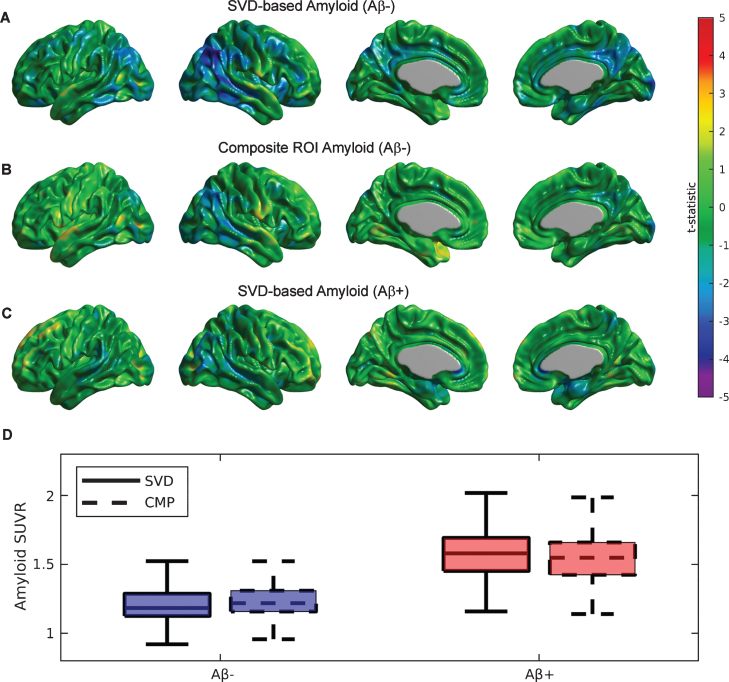
Objective: We hypothesize that typical measurements of Aβ taken either from composite regions-of-interest with relatively high burden actually cover significant patterns of the relationship with glucose metabolism. In contrast, spatially weighted measures of Aβ are more related to glucose metabolism in cognitively normal (CN) aging and mild cognitive impairment (MCI).
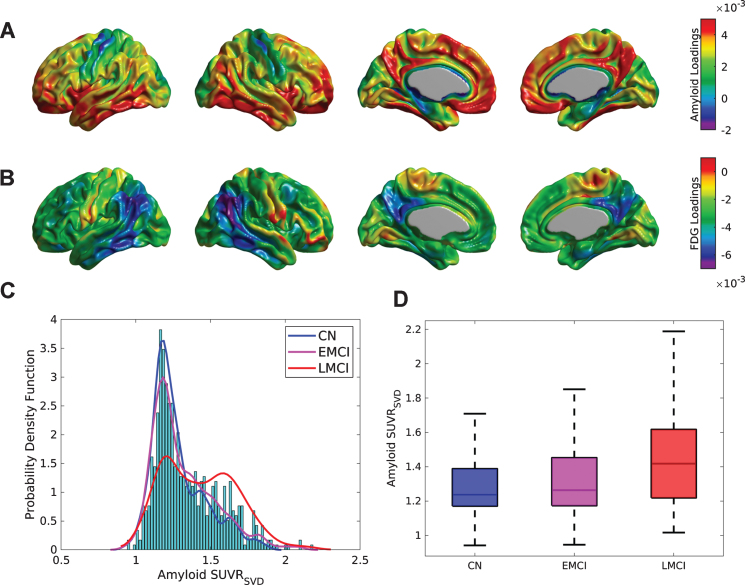
Methods: We have generated a score of amyloid burden based on a joint singular value decomposition (SVD) of the cross-correlation structure between glucose metabolism, as measured by [18F]2-fluoro-2-deoxyglucose (FDG) PET, and Aβ, as measured by [18F]florbetapir PET, from the Alzheimer's Disease Neuroimaging Initiative study. This SVD-based score reveals cortical regions where a reduced glucose metabolism is maximally correlated with distributed patterns of Aβ.
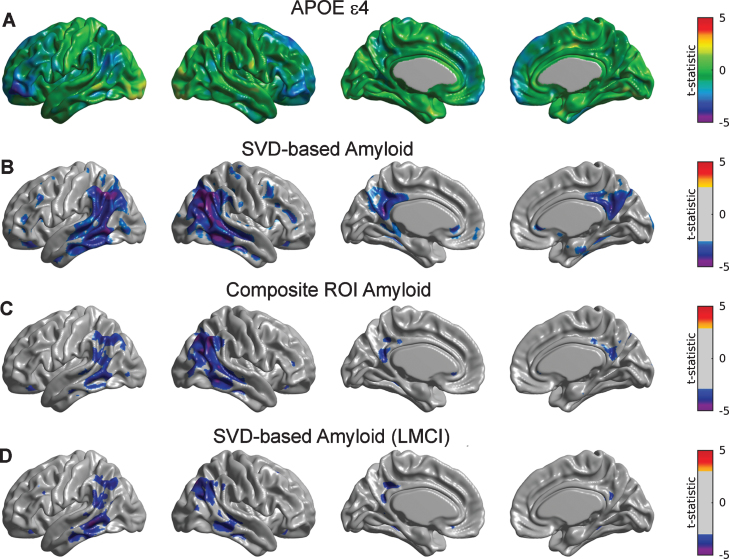
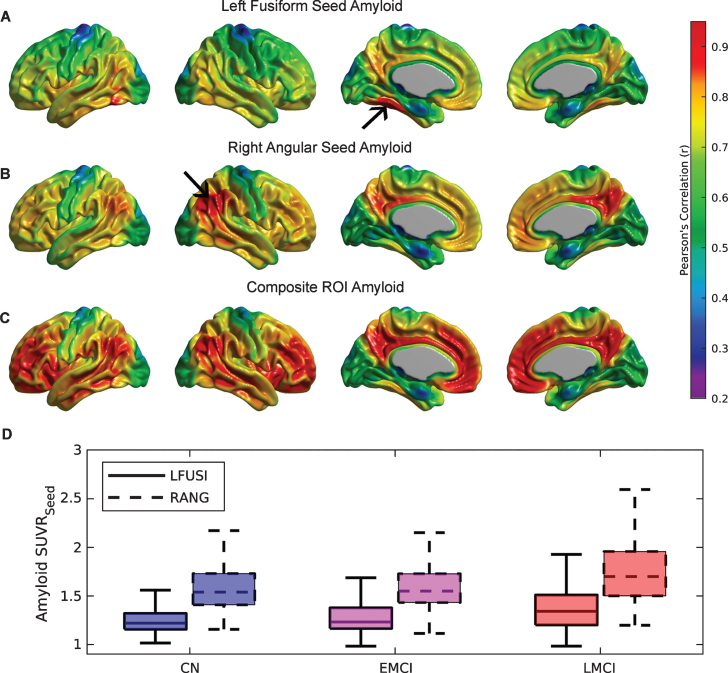
Results: From an older population of CN and MCI subjects, we found that the SVD-based Aβ score was significantly correlated with glucose metabolism in several cortical regions. Additionally, the corresponding Aβ network has hubs that contribute to distributed glucose hypometabolism, which, in turn, are not necessarily foci of Aβ deposition.
Conclusions: Our approach uncovered hidden patterns of the glucose metabolism-Aβ relationship. We showed that the SVD-based Aβ score produces a stronger relationship with decreasing glucose metabolism than either APOEɛ4 genotype or global measures of Aβ burden.
Keywords: Alzheimer’s disease; amyloid-β; cross-correlation; glucose metabolism; positron emission tomography; singular value decomposition.
Conflict of interest statement
Authors’ disclosures available online (
Figures
Similar articles
-
Tau-related reduction of glucose metabolism in mild cognitive impairment occurs independently of APOE ε4 genotype and is influenced by Aβ.Alzheimers Dement. 2025 Feb;21(2):e14625. doi: 10.1002/alz.14625. Alzheimers Dement. 2025. PMID: 39989007 Free PMC article.
-
Topographical APOE ɛ4 Genotype Influence on Cerebral Metabolism in the Continuum of Alzheimer's Disease: Amyloid Burden Adjusted Analysis.J Alzheimers Dis. 2016 Sep 6;54(2):559-68. doi: 10.3233/JAD-160395. J Alzheimers Dis. 2016. PMID: 27567846
-
Alzheimer Disease Signature Neurodegeneration and APOE Genotype in Mild Cognitive Impairment With Suspected Non-Alzheimer Disease Pathophysiology.JAMA Neurol. 2017 Jun 1;74(6):650-659. doi: 10.1001/jamaneurol.2016.5349. JAMA Neurol. 2017. PMID: 28319241 Free PMC article.
-
Positron emission tomography radiopharmaceuticals for imaging brain Beta-amyloid.Semin Nucl Med. 2011 Jul;41(4):283-99. doi: 10.1053/j.semnuclmed.2011.02.005. Semin Nucl Med. 2011. PMID: 21624562 Review.
-
Amyloid imaging.Int Psychogeriatr. 2011 Sep;23 Suppl 2:S41-9. doi: 10.1017/S1041610211000895. Int Psychogeriatr. 2011. PMID: 21729418 Review.
Cited by
-
Aβ initiates brain hypometabolism, network dysfunction and behavioral abnormalities via NOX2-induced oxidative stress in mice.Commun Biol. 2021 Sep 9;4(1):1054. doi: 10.1038/s42003-021-02551-x. Commun Biol. 2021. PMID: 34504272 Free PMC article.
-
MVComp toolbox: MultiVariate Comparisons of brain MRI features accounting for common information across metrics.bioRxiv [Preprint]. 2024 Feb 28:2024.02.27.582381. doi: 10.1101/2024.02.27.582381. bioRxiv. 2024. PMID: 38463982 Free PMC article. Preprint.
-
Therapeutic potential of ADAM10 modulation in Alzheimer's disease: a review of the current evidence.Cell Commun Signal. 2023 Mar 14;21(1):60. doi: 10.1186/s12964-023-01072-w. Cell Commun Signal. 2023. PMID: 36918870 Free PMC article. Review.
-
Alzheimer's Disease from the Amyloidogenic Theory to the Puzzling Crossroads between Vascular, Metabolic and Energetic Maladaptive Plasticity.Biomedicines. 2023 Mar 11;11(3):861. doi: 10.3390/biomedicines11030861. Biomedicines. 2023. PMID: 36979840 Free PMC article. Review.
-
Association of overexpressed carboxyl-terminal amyloid precursor protein in brains with altered glucose metabolism and liver toxicity.Anim Cells Syst (Seoul). 2023 Apr 4;27(1):103-111. doi: 10.1080/19768354.2023.2197761. eCollection 2023. Anim Cells Syst (Seoul). 2023. PMID: 37033452 Free PMC article.
References
-
- Minoshima S, Giordani B, Berent S, Frey KA, Foster NL, Kuhl DE (1997) Metabolic reduction in the posterior cingulate cortex in very early Alzheimer’s disease. Ann Neurol 42, 85–94. - PubMed
-
- Silverman DH, Small GW, Chang CY, Lu CS, Kung De Aburto MA, Chen W, Czernin J, Rapoport SI, Pietrini P, Alexander GE, Schapiro MB, Jagust WJ, Hoffman JM, Welsh-Bohmer KA, Alavi A, Clark CM, Salmon E, de Leon MJ, Mielke R, Cummings JL, Kowell AP, Gambhir SS, Hoh CK, Phelps ME (2001) Positron emission tomography in evaluation of dementia: Regional brain metabolism and long-term outcome. JAMA 286, 2120–2127. - PubMed
-
- Klunk WE, Engler H, Nordberg A, Wang Y, Blomqvist G, Holt DP, Bergström M, Savitcheva I, Huang GF, Estrada S, Ausén B, Debnath ML, Barletta J, Price JC, Sandell J, Lopresti BJ, Wall A, Koivisto P, Antoni G, Mathis CA, Långström B (2004) Imaging brain amyloid in Alzheimer’s disease with Pittsburgh Compound-B. Ann Neurol 55, 306–319. - PubMed
-
- Mosconi L (2005) Brain glucose metabolism in the early and specific diagnosis of Alzheimer’s disease. FDG-PET studies in MCI and AD. Eur J Nucl Med Mol Imaging 32, 486–510. - PubMed
-
- Hardy JA, Higgins GA (1992) Alzheimer’s disease: The amyloid cascade hypothesis. Science 256, 184–185. - PubMed
MeSH terms
Substances
Grants and funding
LinkOut - more resources
Full Text Sources
Medical
