. 2019 Dec 3;10(1):5309.
doi: 10.1038/s41467-019-13177-3.

Optimal solid state neurons

Affiliations

Optimal solid state neurons

Kamal Abu-Hassan et al. Nat Commun. .

Abstract

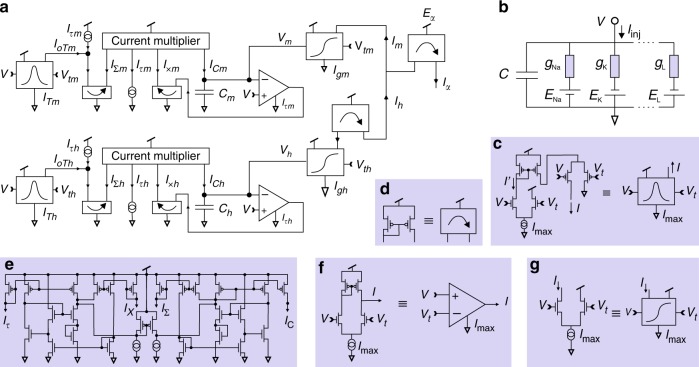
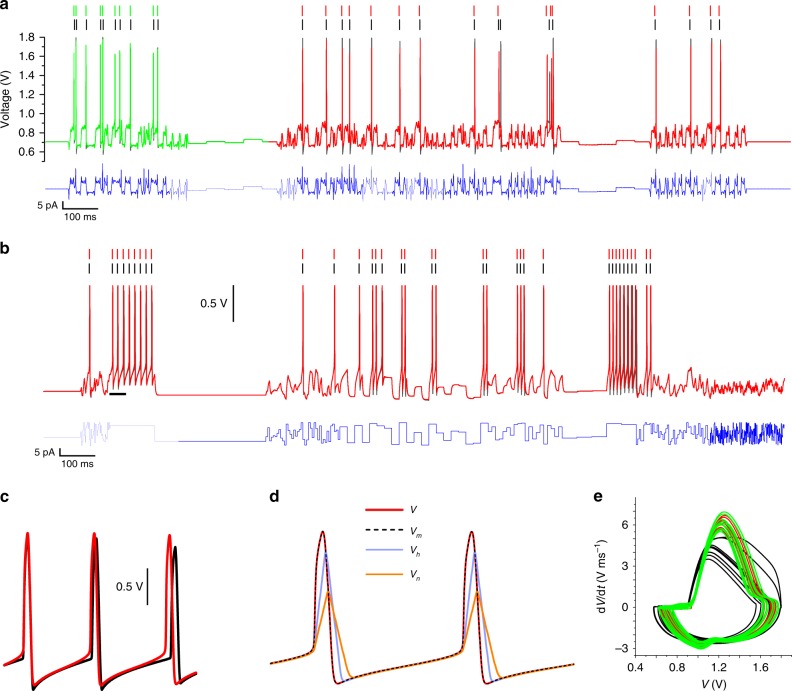
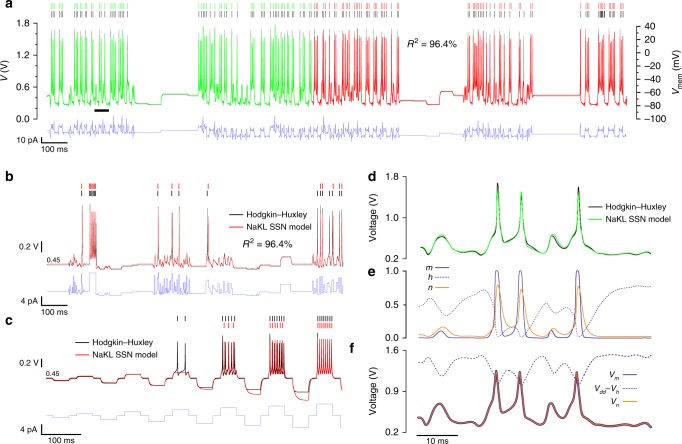
Bioelectronic medicine is driving the need for neuromorphic microcircuits that integrate raw nervous stimuli and respond identically to biological neurons. However, designing such circuits remains a challenge. Here we estimate the parameters of highly nonlinear conductance models and derive the ab initio equations of intracellular currents and membrane voltages embodied in analog solid-state electronics. By configuring individual ion channels of solid-state neurons with parameters estimated from large-scale assimilation of electrophysiological recordings, we successfully transfer the complete dynamics of hippocampal and respiratory neurons in silico. The solid-state neurons are found to respond nearly identically to biological neurons under stimulation by a wide range of current injection protocols. The optimization of nonlinear models demonstrates a powerful method for programming analog electronic circuits. This approach offers a route for repairing diseased biocircuits and emulating their function with biomedical implants that can adapt to biofeedback.


Conflict of interest statement

The authors declare no competing interests.

Figures

Fig. 1
Fig. 1
Biomimetic solid-state ion channel. a The conductance of ion species α is modulated by an activation gate and an inactivation gate. The net ionic current, Iα=(ImIh)θ(ImIh), is the difference between the activation current (Im) and the inactivation current (Ih). The Heaviside function, θ(), specifies that the current mirror outputs a positive current Iα when Im>Ih and 0 otherwise. b Electrical equivalent circuit of the neuron membrane. cg Block diagrams of sub-circuits for c the gate recovery time, d current mirror, e current multiplication ICγ=I×γ×IτγIΣγ, where γm,h, f transconductance amplification and g sigmoidal activation/inactivation.
Fig. 2
Fig. 2
Twin experiment with a solid-state neuron. a Membrane voltage of a sub-threshold neuron (black line) stimulated by a current protocol mixing hyperchaotic oscillations with current steps (blue line). The membrane voltage was measured from a VLSI chip implementing the NaKL SSN model. The SSN model was synchronized to the data over a T = 600-ms-long assimilation window (green line). The complete model configured with the estimated parameters was then forward integrated from t = 600 ms onwards to t = 2000 ms to predict the membrane voltage (red line). b Membrane voltage predicted by the completed SSN model for a different current protocol consisting of fast and slow-varying steps (red line). VLSI membrane voltage measured on the VLSI neuron (black line). c Detail of membrane voltage oscillations showing the shape of predicted and actual action potentials. d Predicted time dependence of state variables V, Vm, Vh and Vn. e Phase portrait of action potentials over the assimilation window: VLSI experiment (black line), fitted (green line) and predicted from t = 0 (red line).
Fig. 3
Fig. 3
Equivalence of the NaKL SSN model and the Hodgkin–Huxley model. a The equivalence between the two models is demonstrated by synchronizing the SSN model to membrane voltage oscillations synthesized by the Hodgkin–Huxley model (black line). The Hodgkin–Huxley time series voltage was assimilated over a 1000-ms-long window (green line) under the constraints of the current injection protocol (blue line). The membrane voltage was predicted from t = 1000 ms onwards by forward integrating the current protocol with the completed SSN model (red line). b, c Membrane voltages predicted by the same SSN model (red line) and HH model (black line) for two different current protocols. d Detail of the SSN and HH action potentials and a comparison of NaT and K gate variables in e the HH model and f the SSN model.
Fig. 4
Fig. 4
Assimilation and prediction of a CA1 pyramidal neuron. Membrane voltage oscillations of a pyramidal cell from the rat hippocampal cortex (black line) induced by the injection of a current protocol (blue line). The current trace shows the actual injected current, as measured. The CA1 SSN model was synchronized to the experimental membrane voltage over a T = 940-ms-long assimilation window (green trace). The optimum fit produced an estimate of the model parameters shown in Table 3. Models completed by incorporating the optimal parameters were used to predict the membrane voltage from tT (red line). b Detail of the predicted membrane voltage over the time interval indicated by the horizontal bar. c Further predictions were made for a wide range of current protocols one of which is shown here. Detailed dynamics of state variables of the SSN model during an action potential: d membrane voltage, e gate variables and f ionic currents.
Fig. 5
Fig. 5
Assimilation and prediction of a respiratory neuron. a Intracellular recording of a respiratory neuron acquired from a slice of the Bötzinger region of the rat brain stem (black line). The neuron was stimulated with a current waveform alternating hyperchaotic oscillations and current steps (blue line). The RN SSN model was used to assimilate the experimental membrane voltage over a 920-ms-long window (green trace) to estimate the optimum parameters. ac The completed RN SSN model predicts the membrane voltage (red traces) in quantitative agreement with observations (black traces) for a very wide range of current waveforms. Detail of: d an action potential, e gate variables and f ion current dynamics.
Fig. 6
Fig. 6
Analogue interpolation of the gate activation curves and gate kinetics. a Sigmoidal currents I1++IN are summed to interpolate the activation curve of an ionic gate. The adjustment parameters are the voltage thresholds Vt1,,VtN and source currents Imax,1,,Imax,N. b Activation curve of the A channel of a thalamic relay neuron (circle symbols) interpolated by nine sigmoids whose sum gives the output current Iout (full red line). The output current normalized by Imax=Imax,1++Imax,9 gives the biological activation curve, m(V). c Circuit interpolating the activation/inactivation kinetics by summing N bell-shaped curves centred at Vt1,,VtN with amplitudes Imax,1,,Imax,N. d Activation kinetics of the HCN current, τ(V), (circle symbols) interpolated by summing nine bell-shaped curves in the output current Iτout (full red line). Iτmax=Iτmax,1++Iτmax,9.

References

    1. Hodgkin AL, Huxley AF. A quantitative description of membrane current and its application to conduction and excitation in nerve. J. Physiol. 1952;117:500. doi: 10.1113/jphysiol.1952.sp004764. - DOI - PMC - PubMed
    1. Benazilla F. The voltage sensor in voltage-dependent ion channels. Physiol. Rev. 2000;80:555. doi: 10.1152/physrev.2000.80.2.555. - DOI - PubMed
    1. Rabinovich MI, Varona P, Selverston AI, Abarbanel HDI. Dynamical principles in neuroscience. Rev. Mod. Phys. 2006;79:1213. doi: 10.1103/RevModPhys.78.1213. - DOI
    1. Mahowald M, Douglas R. A silicon neuron. Nature. 1991;354:515. doi: 10.1038/354515a0. - DOI - PubMed
    1. Yu T, Cauwenberghs G. Analog VLSI biophysical neurons and synapses with programmable membrane channel kinetics. IEEE Trans. Biomed. Circ. 2010;4:139. doi: 10.1109/TBCAS.2010.2048566. - DOI - PubMed

Publication types