. 2019 Dec 3;10(1):5499.
doi: 10.1038/s41467-019-13329-5.

An independent poor-prognosis subtype of breast cancer defined by a distinct tumor immune microenvironment

Collaborators, Affiliations

An independent poor-prognosis subtype of breast cancer defined by a distinct tumor immune microenvironment

Xavier Tekpli et al. Nat Commun. .

Abstract

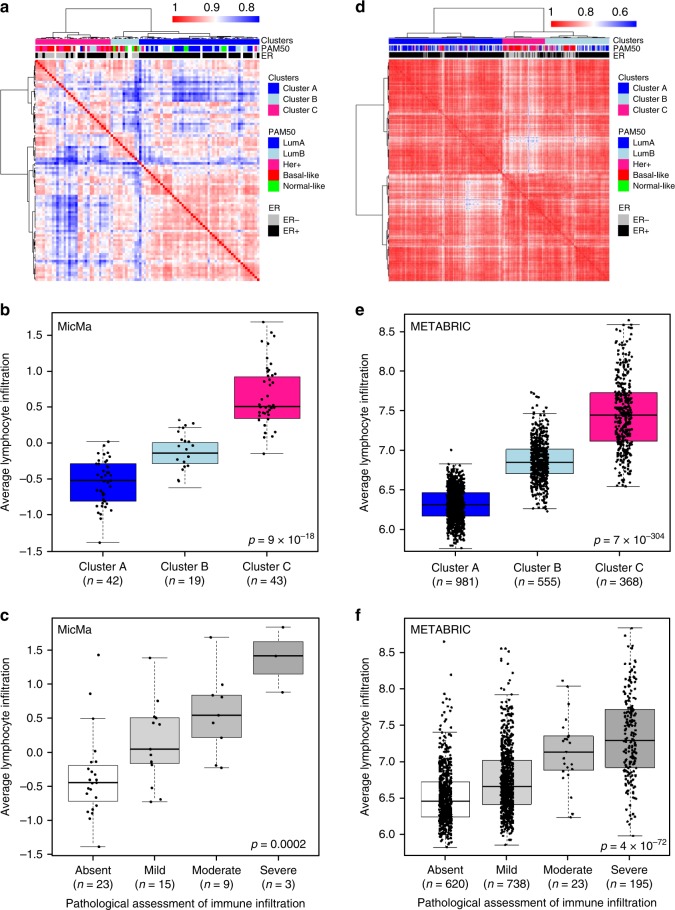
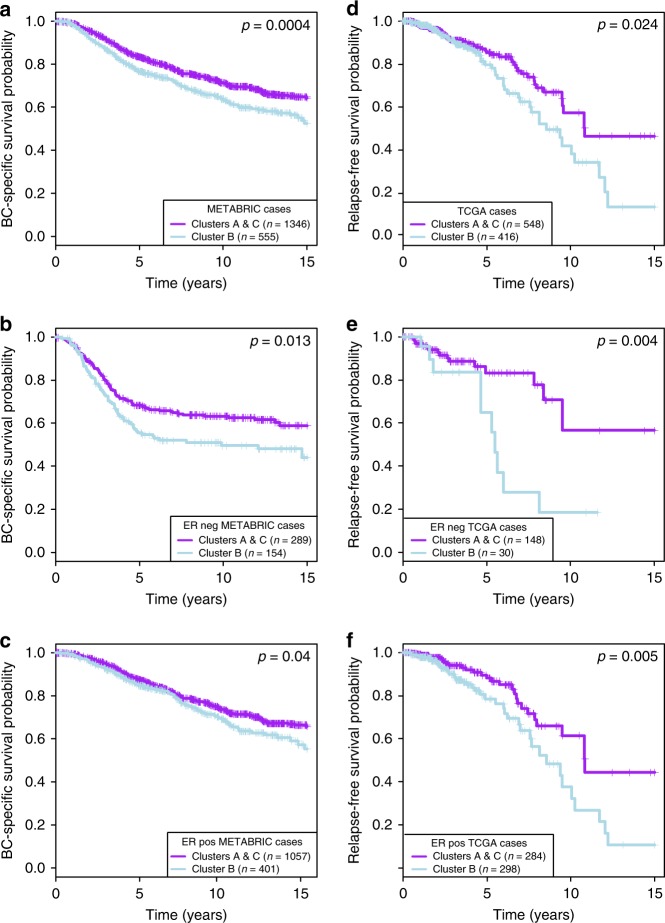
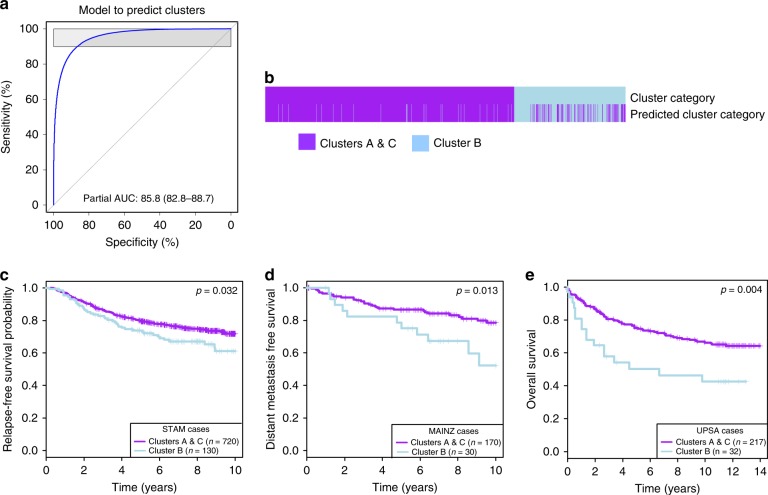
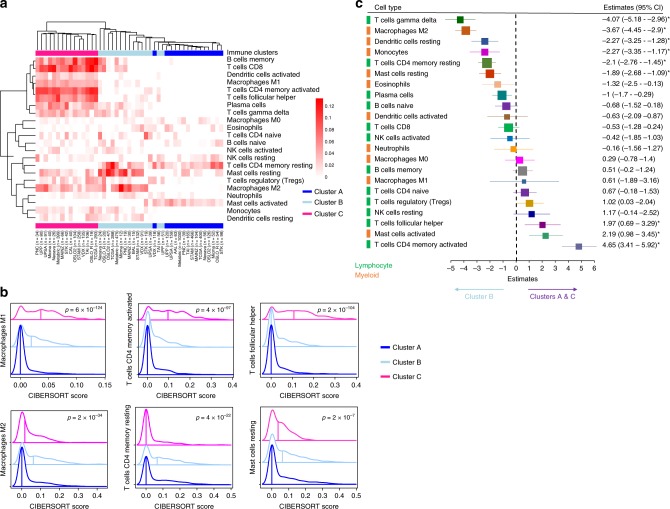
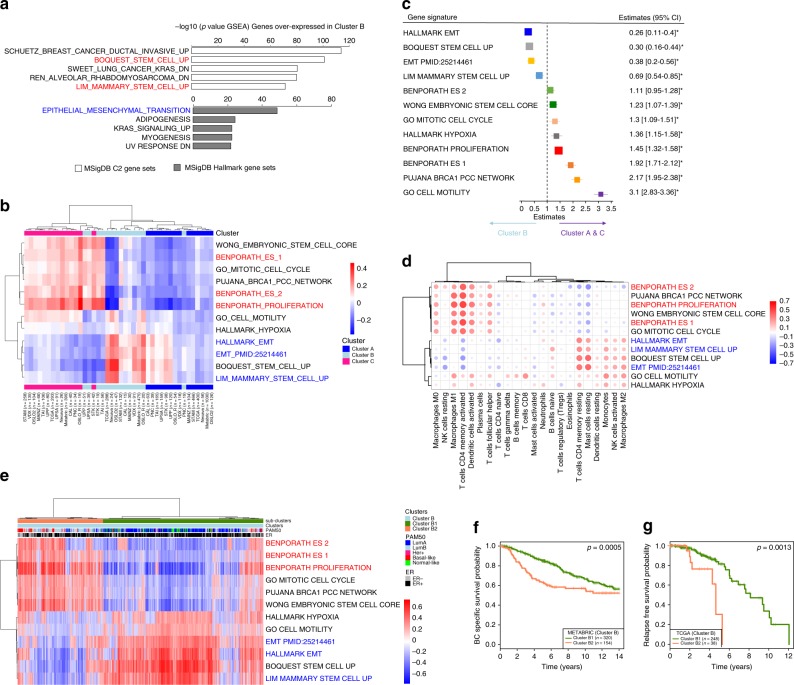
How mixtures of immune cells associate with cancer cell phenotype and affect pathogenesis is still unclear. In 15 breast cancer gene expression datasets, we invariably identify three clusters of patients with gradual levels of immune infiltration. The intermediate immune infiltration cluster (Cluster B) is associated with a worse prognosis independently of known clinicopathological features. Furthermore, immune clusters are associated with response to neoadjuvant chemotherapy. In silico dissection of the immune contexture of the clusters identified Cluster A as immune cold, Cluster C as immune hot while Cluster B has a pro-tumorigenic immune infiltration. Through phenotypical analysis, we find epithelial mesenchymal transition and proliferation associated with the immune clusters and mutually exclusive in breast cancers. Here, we describe immune clusters which improve the prognostic accuracy of immune contexture in breast cancer. Our discovery of a novel independent prognostic factor in breast cancer highlights a correlation between tumor phenotype and immune contexture.


Conflict of interest statement

The authors declare no competing interests.

Figures

Fig. 1
Fig. 1
Immune clusters are associated with total immune infiltration. a, d Gene expression was measured in 95 FFPE MicMa (a) and 1904 fresh frozen METABRIC samples (d). Unsupervised clustering using correlation distance and ward. D linkage of the correlation matrix assesses the relation between patients according to the expression of the genes on the PanCancer Immune Profiling array. All 760 genes on the array were used for clustering the MicMa cohort, while 509 genes, which corresponds to genes (out of the 760) found in all datasets, were used to cluster the METABRIC. Annotations of the samples on the top of the heatmap indicate histopathological features: PAM50 subtype, ER status as well as the three clusters identified by the cutree method. b, e In the MicMa (b) and the METABRIC (e), lymphoid scores quantify lymphoid infiltration which was calculated from a set of genes’ markers of lymphocyte as defined by the algorithm Nanodissect. Lymphoid scores are represented in boxplots according to immune clusters with Kruskal–Wallis test p values. c, f H&E-stained tumor tissue samples (c, MicMa, n = 50 and f, METABRIC, n = 1904) were categorized by an experienced pathologist according to the level of tumor-infiltrating immune cells. Boxplots represent the average lymphocyte score from Nanodissect according to pathologists’ classifications. Kruskal–Wallis test p values is denoted. The line within each box represents the median. Upper and lower edges of each box represent 75th and 25th percentile, respectively. The whiskers represent the lowest datum still within [1.5 × (75th − 25th percentile)] of the lower quartile, and the highest datum still within [1.5 × (75th − 25th percentile)] of the upper quartile.
Fig. 2
Fig. 2
Immune clusters are associated with prognosis. Kaplan–Meier survival curves for Cluster B (light blue) and Clusters A and C (purple). In all METABRIC (a) and TCGA (d) samples; in ER negative (b, e) and ER positive (c, f). p values are from log-rank tests. Kaplan–Meier display breast cancer-specific survival for the METABRIC and relapse-free survival for the TCGA.
Fig. 3
Fig. 3
Prediction of Cluster B using binomial logistic regression. a Using binomial logistic regression penalized by the lasso method, we trained on 4546 samples to predict Cluster B. ROC curve assesses how the lasso output (the weighted gene sets in Supplementary Data 1) discriminates a sample to be Cluster B or not. b For the 4546 samples in the training set, the heatmap represents whether a sample is part of Cluster B (light blue) or Clusters A and C (purple), using the clustering or the lasso methods. ce The prediction of the clusters (lasso) was tested on five cohorts, which were not included in the training phase: c STAM (n = 856), d MAINZ (n = 200), and e UPSA (n = 289) are presented here, the two other cohorts CAL and PNC are presented in Supplementary Figures. The association between predicted clusters and survival was tested using Kaplan–Meier survival curves for predicted Cluster B (light blue) and predicted Clusters A and C (purple). p values are from log-rank tests. Kaplan–Meier display relapse-free survival for STAM, distant metastasis-free survival for MAINZ, and overall survival for UPSA.
Fig. 4
Fig. 4
Immune clusters and clinicopathological features. a, b Average percentage of ER-positive and ER-negative samples (a) or PAM50 subtypes (b) of 15 cohorts across the clusters. Cluster A is enriched for ER-positive, Luminal A, Luminal B samples while a significantly higher percentage of ER-negative, Basal-like, Her2-enriched samples was found in Cluster C (high infiltration). Asterisk (*) denote t test p value < 0.0001. Error bars represent standard error to the mean. c Prosigna Breast Cancer ROR scores for the OSLO2-EMIT0 cohort were obtained from the NanoString nCounter Dx Analysis System using FFPE breast tumor tissue. Boxplots represent the average Prosigna ROR scores in the immune clusters. Kruskal–Wallis test p value is denoted. d Calculated ROR scores following the method of Parker et al. are compared to immune clusters using boxplots in the METABRIC cohort. Kruskal–Wallis test p values is shown. e From eight breast cancer cohorts, in which the pathological complete response (pCR) was assessed after administration of neoadjuvant chemotherapy, we calculated the percentage of responders in each cluster. Boxplots show the distribution of the percentage of responders in each immune cluster. Kruskal–Wallis test p value is denoted. The line within each box represents the median. Upper and lower edges of each box represent 75th and 25th percentiles, respectively. The whiskers represent the lowest datum still within [1.5 × (75th − 25th percentile)] of the lower quartile and the highest datum still within [1.5 × (75th − 25th percentile)] of the upper quartile.
Fig. 5
Fig. 5
In silico dissection of the immune clusters. a We used the CIBERSORT algorithm to assess the composition of the immune microenvironment of breast cancer samples. For each cluster, we calculated the median of the absolute score of the 22 cell types given by the CIBERSORT in each cohort. Immune cluster-specific cell-type median scores were used in an unsupervised clustering using maximum linkage and the ward.D2 method. The heatmap obtained allows to visualize which cell types are enriched across the immune clusters. Immune clusters are annotated on the top and bottom of the heatmap. b Density plots represents the distribution of the absolute CIBERSORT scores for selected cell types across the clusters for the METABRIC cohort; the vertical lines crossing the distribution identify the median value for the score. Kruskal–Wallis test p value are denoted. c Estimates of multivariable logistic regression analysis and the 95% confidence interval (CI) are illustrated by forest plot to assess which immune cells inferred by CIBERSORT explain the most the poor prognosis cluster (Cluster B) vs Clusters A and C. Box size is inversely proportional to the width of the confidence interval. Asterisks denote FDR-corrected p value < 0.05. Immune cell types from the lymphoid or myeloid lineage are identified.
Fig. 6
Fig. 6
Immune clusters are associated with EMT and proliferation, two mutually exclusive phenotypes in breast cancer. a Genes overexpressed in Cluster B were defined using Bonferroni-corrected differential expression analysis (Cluster B vs Cluster A and Cluster B vs Cluster C). Genes with significantly higher expression in Cluster B were used in a gene set enrichment analysis using the C2 (white histograms) and H (gray histograms) collections of the MsigDB. −Log10 p value of hypergeometric test are presented. The five most enriched processes in each collection are denoted. b Samples from each cohort (15 cohorts; 6101 samples) were scored using the GSVA Bioconductor package for enrichment in 12 pathways related to proliferation, EMT, and stem cells (Supplementary Data 3). Average enrichment scores are calculated per immune cluster and cohort. Unsupervised clustering using maximum method and ward. D2 linkage shows that pathways enrichment scores recapitulate the immune clusters. The numbers of samples in each cohort and immune clusters are denoted. Immune cluster from which the median score originate are annotated. c Estimates of univariate logistic regression analysis and the 95% confidence interval (CI) are illustrated by forest plot to assess which gene set signature scores calculated using GSVA associate with the poor prognosis cluster (Cluster B) vs Clusters A and C. Box size is inversely proportional to the width of the confidence interval. Asterisks denote FDR-corrected p value < 0.05. d Correlation plots represent all the significant (FDR p value < 0.05) Spearman correlations between gene set signature scores and inferred immune infiltration at the tumor site as calculated using the CIBERSORT algorithm. Color of the dots indicate positive (blue) or negative correlations (red). The size of the dots is proportional to the Spearman Rho value. e Unsupervised clustering of 1318 Cluster B samples from 15 cohorts according to the gene set signature scores using the correlation linkage and ward.D method allows to separate the samples in Cluster B with an EMT phenotype: Cluster B1 (green) or proliferative phenotype: Cluster B2 (orange). PAM50 subtypes and ER status are annotated on the top of the heatmap. f, g Kaplan–Meier survival curves for Cluster B1 (green) and Cluster B2 (orange). In all METABRIC (b) and TCGA (c) samples. p Values are from log-rank tests. Kaplan–Meier display breast cancer-specific survival for the METABRIC and relapse-free survival for the TCGA.

References

    1. Denkert C, et al. Tumour-infiltrating lymphocytes and prognosis in different subtypes of breast cancer: a pooled analysis of 3771 patients treated with neoadjuvant therapy. Lancet Oncol. 2018;19:40–50. doi: 10.1016/S1470-2045(17)30904-X. - DOI - PubMed
    1. Quail DF, Joyce JA. Microenvironmental regulation of tumor progression and metastasis. Nat. Med. 2013;19:1423–1437. doi: 10.1038/nm.3394. - DOI - PMC - PubMed
    1. Parker JS, et al. Supervised risk predictor of breast cancer based on intrinsic subtypes. J. Clin. Oncol. 2009;27:1160–1167. doi: 10.1200/JCO.2008.18.1370. - DOI - PMC - PubMed
    1. Prat A, et al. Clinical implications of the intrinsic molecular subtypes of breast cancer. Breast. 2015;24(Suppl 2):S26–S35. doi: 10.1016/j.breast.2015.07.008. - DOI - PubMed
    1. Blok EJ, et al. Systematic review of the clinical and economic value of gene expression profiles for invasive early breast cancer available in Europe. Cancer Treat. Rev. 2018;62:74–90. doi: 10.1016/j.ctrv.2017.10.012. - DOI - PubMed

Publication types