

Comparability of accelerometer signal aggregation metrics across placements and dominant wrist cut points for the assessment of physical activity in adults
- PMID: 31796778
- PMCID: PMC6890686
- DOI: 10.1038/s41598-019-54267-y
Comparability of accelerometer signal aggregation metrics across placements and dominant wrist cut points for the assessment of physical activity in adults
Abstract
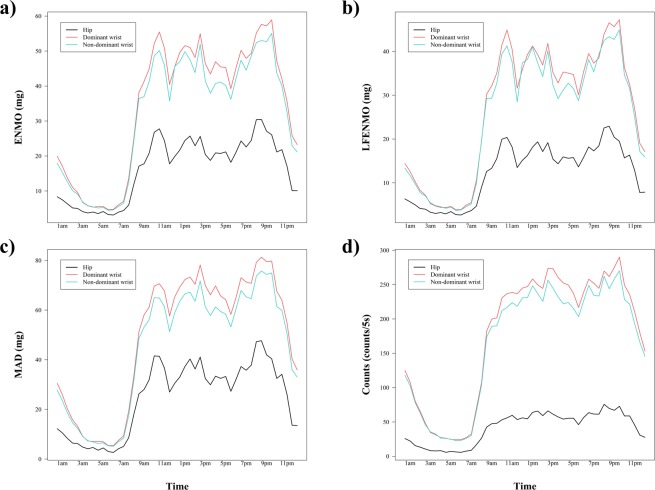
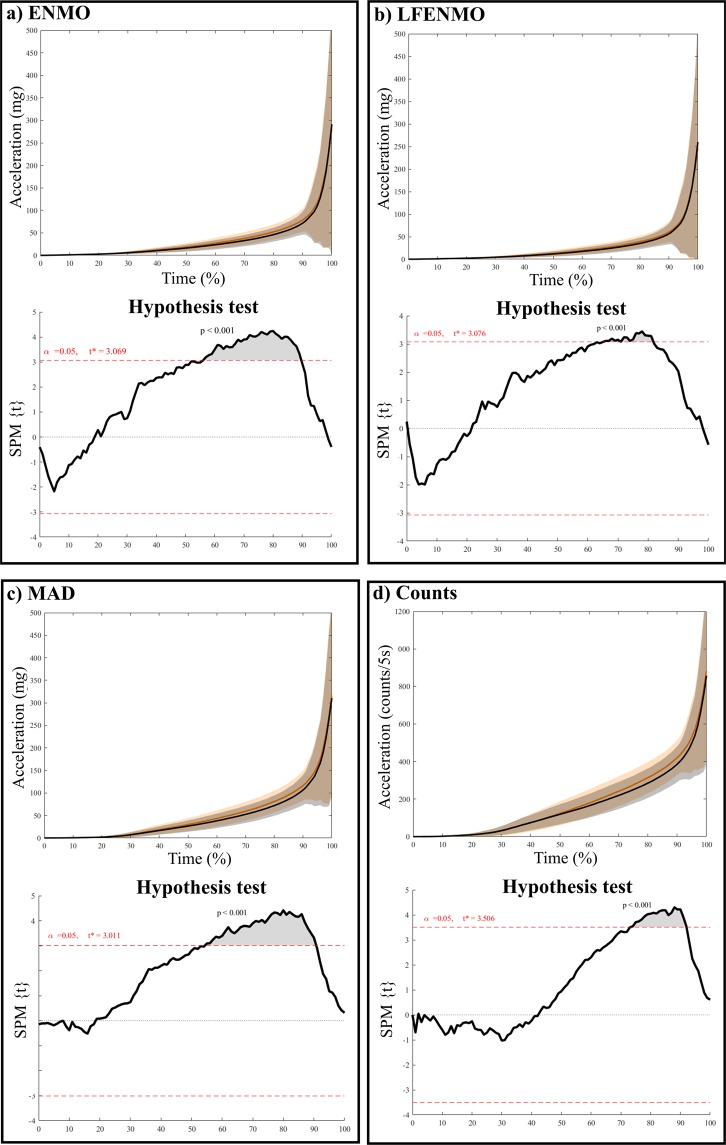
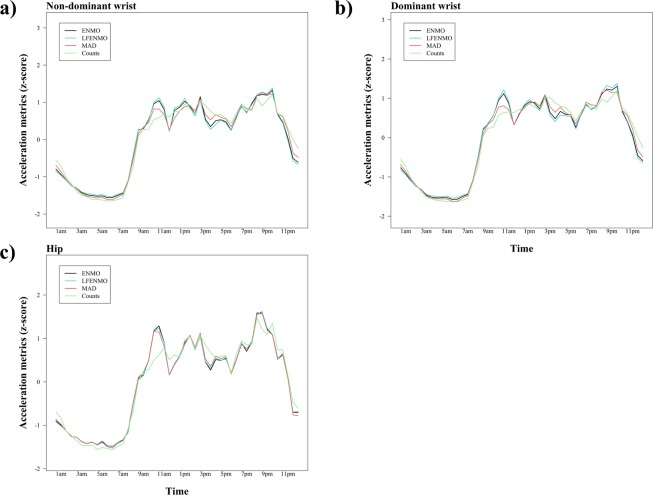
Large epidemiological studies that use accelerometers for physical behavior and sleep assessment differ in the location of the accelerometer attachment and the signal aggregation metric chosen. This study aimed to assess the comparability of acceleration metrics between commonly-used body-attachment locations for 24 hours, waking and sleeping hours, and to test comparability of PA cut points between dominant and non-dominant wrist. Forty-five young adults (23 women, 18-41 years) were included and GT3X + accelerometers (ActiGraph, Pensacola, FL, USA) were placed on their right hip, dominant, and non-dominant wrist for 7 days. We derived Euclidean Norm Minus One g (ENMO), Low-pass filtered ENMO (LFENMO), Mean Amplitude Deviation (MAD) and ActiGraph activity counts over 5-second epochs from the raw accelerations. Metric values were compared using a correlation analysis, and by plotting the differences by time of the day. Cut points for the dominant wrist were derived using Lin's concordance correlation coefficient optimization in a grid of possible thresholds, using the non-dominant wrist estimates as reference. They were cross-validated in a separate sample (N = 36, 10 women, 22-30 years). Shared variances between pairs of acceleration metrics varied across sites and metric pairs (range in r2: 0.19-0.97, all p < 0.01), suggesting that some sites and metrics are associated, and others are not. We observed higher metric values in dominant vs. non-dominant wrist, thus, we developed cut points for dominant wrist based on ENMO to classify sedentary time (<50 mg), light PA (50-110 mg), moderate PA (110-440 mg) and vigorous PA (≥440 mg). Our findings suggest differences between dominant and non-dominant wrist, and we proposed new cut points to attenuate these differences. ENMO and LFENMO were the most similar metrics, and they showed good comparability with MAD. However, counts were not comparable with ENMO, LFENMO and MAD.
Conflict of interest statement
The authors declare no competing interests.
Figures
Similar articles
-
Intensity Thresholds on Raw Acceleration Data: Euclidean Norm Minus One (ENMO) and Mean Amplitude Deviation (MAD) Approaches.PLoS One. 2016 Oct 5;11(10):e0164045. doi: 10.1371/journal.pone.0164045. eCollection 2016. PLoS One. 2016. PMID: 27706241 Free PMC article.
-
Cross-generational comparability of hip- and wrist-worn ActiGraph GT3X+, wGT3X-BT, and GT9X accelerometers during free-living in adults.J Sports Sci. 2020 Dec;38(24):2794-2802. doi: 10.1080/02640414.2020.1801320. Epub 2020 Aug 5. J Sports Sci. 2020. PMID: 32755446
-
Comparability of published cut-points for the assessment of physical activity: Implications for data harmonization.Scand J Med Sci Sports. 2019 Apr;29(4):566-574. doi: 10.1111/sms.13356. Epub 2019 Jan 8. Scand J Med Sci Sports. 2019. PMID: 30548545
-
Assessment of Physical Activity in Adults Using Wrist Accelerometers.Epidemiol Rev. 2022 Jan 14;43(1):65-93. doi: 10.1093/epirev/mxab004. Epidemiol Rev. 2022. PMID: 34215874 Free PMC article. Review.
-
Advances in accelerometry for cardiovascular patients: a systematic review with practical recommendations.ESC Heart Fail. 2020 Oct;7(5):2021-2031. doi: 10.1002/ehf2.12781. Epub 2020 Jul 3. ESC Heart Fail. 2020. PMID: 32618431 Free PMC article.
Cited by
-
A comparative analysis of 24-hour movement behaviors features using different accelerometer metrics in adults: Implications for guideline compliance and associations with cardiometabolic health.PLoS One. 2024 Sep 17;19(9):e0309931. doi: 10.1371/journal.pone.0309931. eCollection 2024. PLoS One. 2024. PMID: 39288135 Free PMC article.
-
GRANADA consensus on analytical approaches to assess associations with accelerometer-determined physical behaviours (physical activity, sedentary behaviour and sleep) in epidemiological studies.Br J Sports Med. 2022 Apr;56(7):376-384. doi: 10.1136/bjsports-2020-103604. Epub 2021 Apr 12. Br J Sports Med. 2022. PMID: 33846158 Free PMC article.
-
Triaxial accelerometer-measured physical activity and functional behaviours among people with High Grade Glioma: The BrainWear Study.PLoS One. 2023 May 24;18(5):e0285399. doi: 10.1371/journal.pone.0285399. eCollection 2023. PLoS One. 2023. PMID: 37224155 Free PMC article.
-
Wrist-worn accelerometers: Influence of decisions during data collection and processing: A cross-sectional study.Health Sci Rep. 2024 Jan 10;7(1):e1810. doi: 10.1002/hsr2.1810. eCollection 2024 Jan. Health Sci Rep. 2024. PMID: 38213780 Free PMC article.
-
Using Computer Vision to Annotate Video-Recoded Direct Observation of Physical Behavior.Sensors (Basel). 2024 Apr 8;24(7):2359. doi: 10.3390/s24072359. Sensors (Basel). 2024. PMID: 38610576 Free PMC article.
References
-
- WHO. Global recommendations on physical activity for health. Geneva: World Health Organization, 10.1080/11026480410034349 (2010). - PubMed
