. 2019 Dec 3;9(1):18180.
doi: 10.1038/s41598-019-54567-3.

FOXO3a regulates rhinovirus-induced innate immune responses in airway epithelial cells

Affiliations

FOXO3a regulates rhinovirus-induced innate immune responses in airway epithelial cells

Joao Gimenes-Junior et al. Sci Rep. .

Abstract

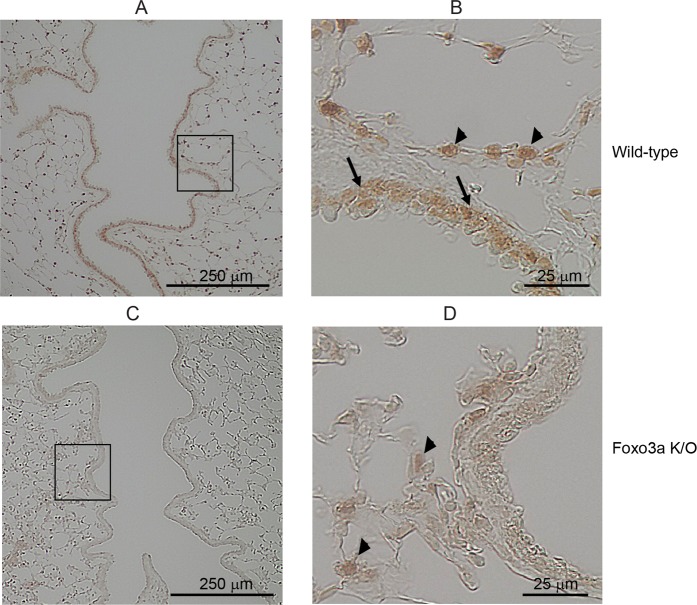
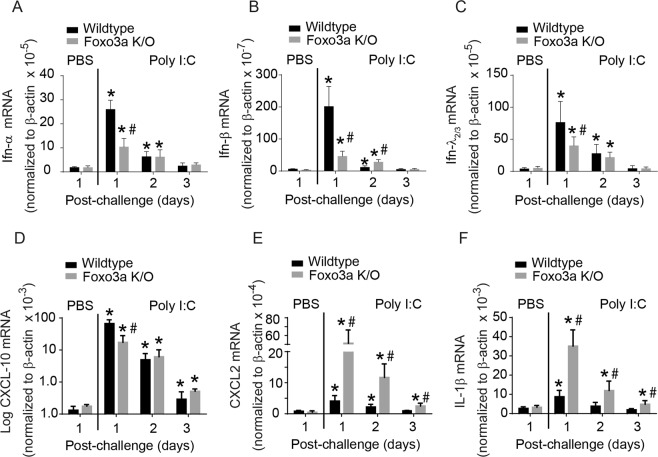
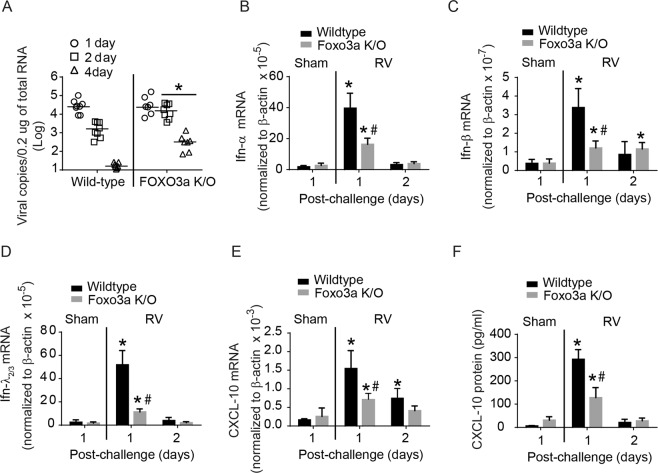
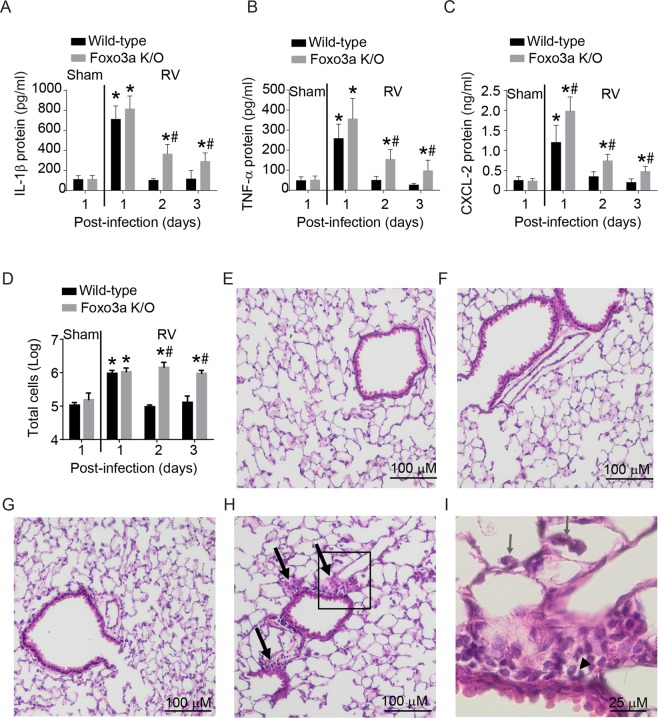
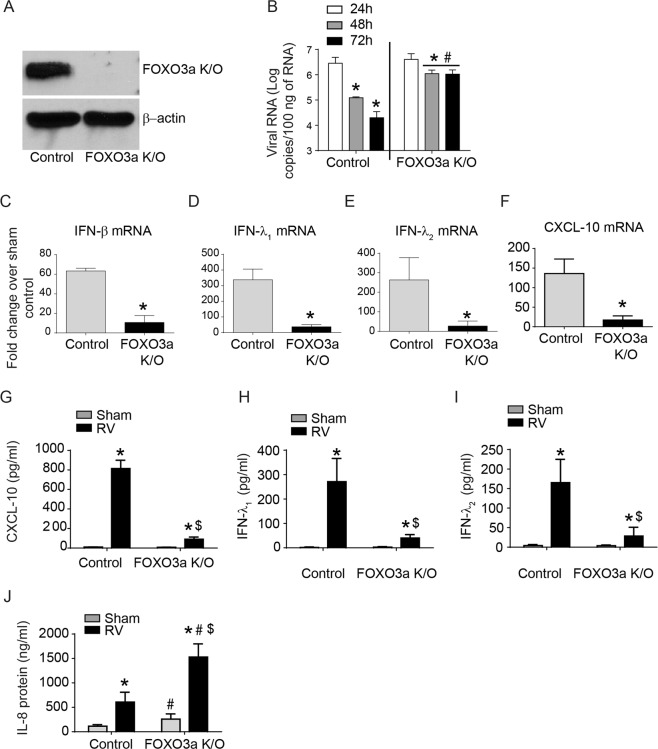
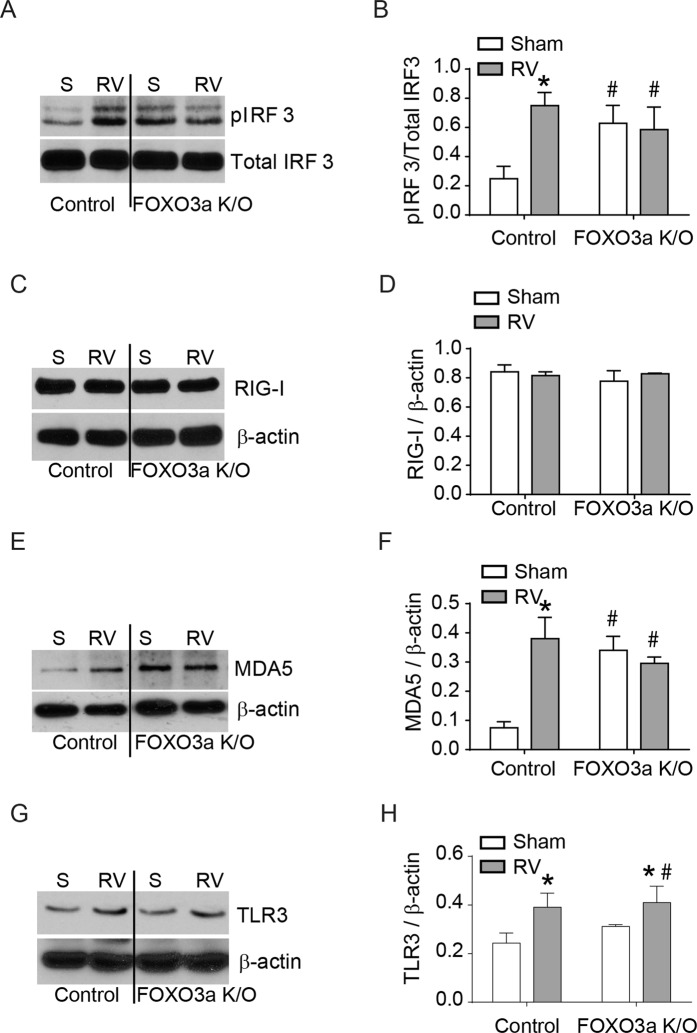
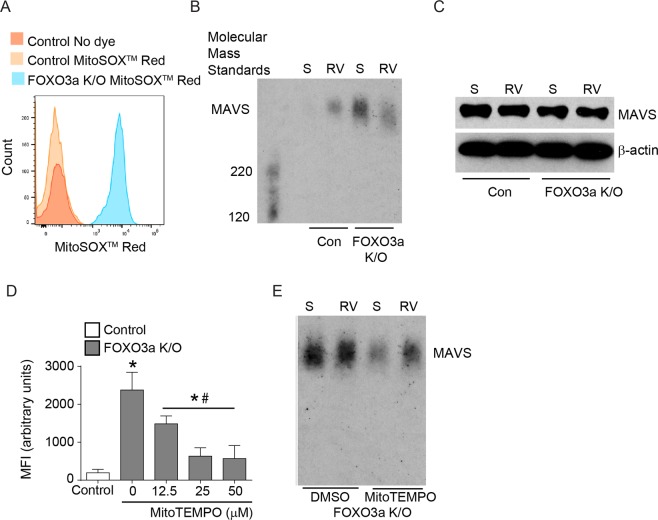
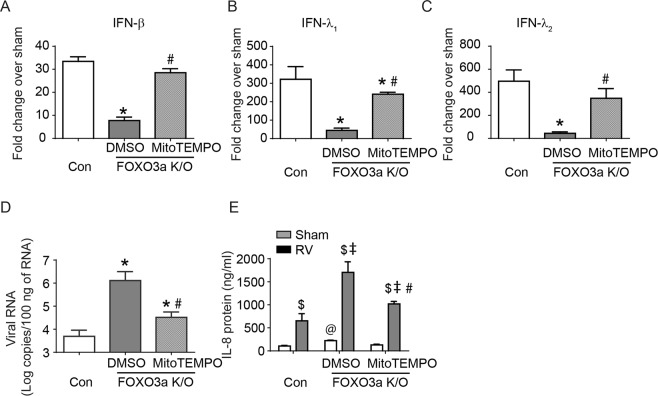
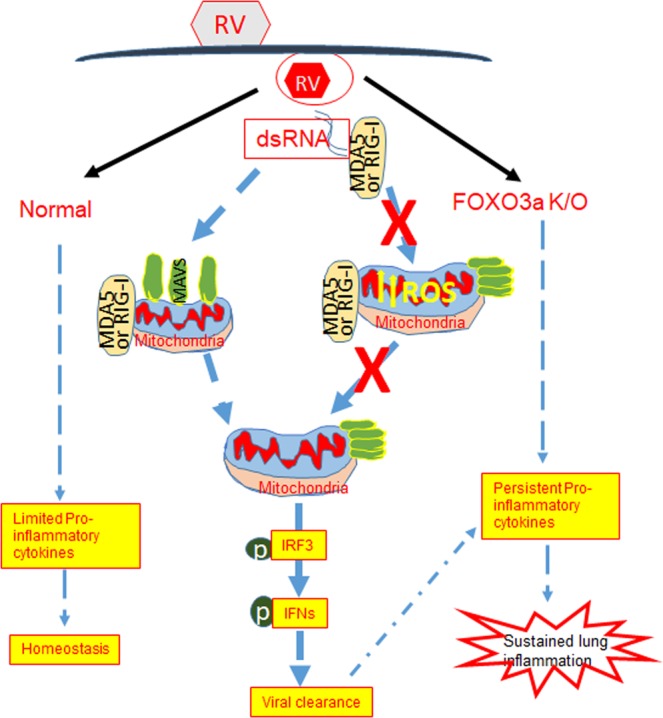
Forkhead transcription factor class O (FOXO)3a, which plays a critical role in a wide variety of cellular processes, was also found to regulate cell-type-specific antiviral responses. Airway epithelial cells express FOXO3a and play an important role in clearing rhinovirus (RV) by mounting antiviral type I and type III interferon (IFN) responses. To elucidate the role of FOXO3a in regulating antiviral responses, we generated airway epithelial cell-specific Foxo3a knockout (Scga1b1-Foxo3a-/-) mice and a stable FOXO3a knockout human airway epithelial cell line. Compared to wild-type, Scga1b1-Foxo3a-/- mice show reduced IFN-α, IFN-β, IFN-λ2/3 in response to challenge with RV or double-stranded (ds)RNA mimic, Poly Inosinic-polycytidylic acid (Poly I:C) indicating defective dsRNA receptor signaling. RV-infected Scga1b1-Foxo3a-/- mice also show viral persistence, enhanced lung inflammation and elevated pro-inflammatory cytokine levels. FOXO3a K/O airway epithelial cells show attenuated IFN responses to RV infection and this was associated with conformational change in mitochondrial antiviral signaling protein (MAVS) but not with a reduction in the expression of dsRNA receptors under unstimulated conditions. Pretreatment with MitoTEMPO, a mitochondrial-specific antioxidant corrects MAVS conformation and restores antiviral IFN responses to subsequent RV infection in FOXO3a K/O cells. Inhibition of oxidative stress also reduces pro-inflammatory cytokine responses to RV in FOXO3a K/O cells. Together, our results indicate that FOXO3a plays a critical role in regulating antiviral responses as well as limiting pro-inflammatory cytokine expression. Based on these results, we conclude that FOXO3a contributes to optimal viral clearance and prevents excessive lung inflammation following RV infection.


Conflict of interest statement

The authors declare no competing interests.

Figures

Figure 1
Figure 1
Confirmation of knockdown of Foxo3a in the airway epithelium of Foxo3a K/O mice. Lung sections from wild-type and Foxo3a K/O mice treated with tamoxifen were analyzed for expression of Foxo3a by immunohistochemistry. (A) Wild type mice immunostained with antibody to Foxo3a. (B) Represents magnified view of rectangle marked in panel A. (C) Foxo3a K/O mice immunostained with antibody to Foxo3a. (D) Represents magnified view of rectangle marked in panel C. Arrows in A, represent Foxo3a in airway epithelium and arrowheads in B and D represent Foxo3a in parenchymal cells.
Figure 2
Figure 2
Innate immune responses of wild-type and Foxo3a K/O mice to Poly I:C challenge. Wild-type and Foxo3a K/O mice were challenged with Poly I:C by intranasal route and sacrificed 1, 2, or 3 days post-infection. (A–F) Total RNA was isolated from the lungs, reverse transcribed and subjected to probe-based qPCR. Data was normalized to housekeeping gene and represent mean and SD calculated from 3 independent experiments with 2 to 3 mice group to a total of 7–9 mice in each group. (*p ≤ 0.05, different from respective PBS-treated mice; #p ≤ 0.05, different from similarly-challenged wild-type animals, one-way ANOVA).
Figure 3
Figure 3
Antiviral responses of wild-type and Foxo3a K/O mice to RV infection. Wild-type and Foxo3a K/O mice were infected with RV or sham by intranasal route and sacrificed 1, 2 or 7 days post-infection. (A) Total RNA was isolated from the lungs and subjected to quantitative RT-qPCR to determine viral RNA. (*p ≤ 0.05, different from RV-infected wild-type mice). (B–E) cDNA was synthesized from total RNA isolated at 1 and 2 days post-infection and subjected to probe-based qPCR. Data in each panel was normalized to housekeeping gene and reported as mean and SD calculated from 3 independent experiments with 2 to 3 mice group to a total of 7–9 mice in each group. (F) Wild-type and Foxo3a K/O mice were infected with RV and sacrificed 1, or 2 days post-infection. BAL fluid was collected and CXCL-10 protein level was determined by multiplex Luminex ELISA. Data represent range with a median calculated from 6–8 mice per group. (*p ≤ 0.05, different from respective sham-infected animals; #p ≤ 0.05, different from similarly-infected wild-type animals, one-way ANOVA).
Figure 4
Figure 4
RV infection induces sustained lung inflammation in Foxo3a K/O mice. (A–C) Wild-type and Foxo3a K/O mice were infected with RV by intranasal route and sacrificed 1, 2, or 3 days post-infection. Sham-infected animals were sacrificed at 1 day post-infection. Lungs were lavaged and levels of cytokines were determined in BAL fluid by multiplex Luminex ELISA. (D) Total cells in the lavage were quantified by counting the cells. Data represent mean and SD calculated from 3 independent experiments with 2 to 3 mice group to a total of 7–9 mice in each group. (*p ≤ 0.05, different from respective sham-infected animals; #p ≤ 0.05, different from similarly-infected wild-type animals, one-way ANOVA). (E,F) H & E sections of lung sections from wild-type animals infected with sham and RV respectively at 4 days post-infection. (G,H) H & E sections of lung sections from Foxo3a K/O animals infected with sham and RV respectively. Arrows represent areas of inflammation. (I) Magnified area marked (square) in panel H. Arrow and arrowheads respectively represent macrophages in alveolar space and neutrophils in a peribronchiolar area. Images are representative of 3 to 4 animals per group.
Figure 5
Figure 5
Responses of control and FOXO3a K/O airway epithelial cells to RV infection. (A) Western blot showing knockdown of FOXO3a in FOXO3a K/O cells. (B) Control vector or FOXO3a cells were infected with RV or sham and RNA was isolated at 24, 48 and 72 h post-infection and subjected to quantitative qPCR to determine viral load. Data represent mean and SD calculated from 5 independent experiments conducted in triplicates (*p ≤ 0.05, different from respective 24 h post-RV infected cells; #p ≤ 0.05, different from control vector cells at 48 and 72 h post-infection, ANOVA). (C–F) Total RNA was isolated 16 h after RV infection and subjected to probe-based qPCR. Data in each panel was normalized to housekeeping gene and expressed as fold change over respective sham-infected cells (* p ≤ 0.05, different from RV-infected control cells, t test). (G–J) Basolateral medium was collected 24 h after sham or RV infection and protein levels of CXCL-10, IFN-λ1, IFN-λ2, and IL-8 were determined by ELISA (*p ≤ 0.05, different from respective sham-infected cultures; #p ≤ 0.05, different from sham-infected control vector cells; $p ≤ 0.05, different from RV-infected control vector cells, one-way ANOVA).
Figure 6
Figure 6
FOXO3a K/O cells show activation of MDA5 signaling pathway under basal conditions. Control vector and FOXO3a K/O airway epithelial cells were infected with sham or RV, and total protein was harvested at 4 h post-infection. (A,C,E,G) Equal amount of protein was subjected to Western blot analysis. Images are representative of 4 independent experiments. (B,D,F,H) Band intensities were determined by using Image J and expressed as a ratio of phospho- to total protein or total protein to β-actin. Data represent mean and SD calculated from 4 independent experiments (*p ≤ 0.05, different from respective sham-infected cultures; #p ≤ 0.05, different from sham-infected control vector cells, ANOVA).
Figure 7
Figure 7
Oxidative stress and MAVS polymerization is increased in FOXO3a K/O airway epithelial cells under basal conditions. (A) Control vector and FOXO3a K/O cells grown to 90% confluence were loaded with MitoSOX Red, washed and analyzed by flow cytometry. Histogram is a representative of 3 independent experiments performed in triplicates. (B,C) Control vector and FOXO3a K/O cells were infected with sham or RV, incubated for 4 h, and crude mictochondrial proteins or total proteins were isolated. Crude mitochondrial extract was subjected to SDD-AGE to assess the oligomerization of MAVS (B), and total protein was subjected to SDS-PAGE to assess total MAVS (C). (D) FOXO3a K/O cells were treated with MitoTEMPO for 3 h, loaded with MitoSOX Red and analyzed by flow cytometry. MitoSOX Red loaded control vector cells were used as negative controls. Data represent mean and SD calculated from 3 independent experiments performed in triplicates (*p ≤ 0.05, different from control vector cells; #p ≤ 0.05, different from DMSO treated FOXO3a K/O cells, ANOVA). (E) FOXO3a K/O cells pretreated with DMSO or 25 μM MitoTEMPO were infected with sham or RV and incubated for 4 h without MitoTEMPO. Mitochondrial crude extract was subjected to SDD-AGE to assess MAVS oligomerization. Images in panels (B, C, and E) are representative of 3 independent experiments.
Figure 8
Figure 8
Pretreatment with MitoTEMPO corrects innate immune responses to RV infection in FOXO3a K/O cells. FOXO3a K/O cells pretreated with DMSO or 25 μM MitoTEMPO, and control vector cells were infected with sham or RV and incubated for 16 h without MitoTEMPO. (A–D) Total RNA was isolated and subjected to probe-based qPCR to determine the mRNA expression levels of IFNs or quantitative probe-based assay to assess viral RNA. (A–C) mRNA expression levels were normalized to housekeeping gene and expressed as fold increase over respective sham-infected cultures. (D) Viral RNA was quantified 48 h after RV infection and data were expressed as number of viral RNA copies/100 ng of total RNA (*p ≤ 0.05, different from RV-infected control cells; #p ≤ 0.05, different from DMSO treated FOXO3a K/O cells, ANOVA). (E) Cell culture medium was harvested at 16 h post-infection and used for assessing protein levels of IL-8 by ELISA. Data represent mean and SD calculated from 3 independent experiments performed in duplicates or triplicates. ($p ≤ 0.05, different from respective sham-infected cultures; @p ≤ 0.05, different from sham-infected control vector cells; p ≤ 0.05, different from RV-infected control vector cells; #p ≤ 0.05, different from DMSO treated FOXO3a K/O cells, ANOVA).
Figure 9
Figure 9
Overview of the results. Deletion of FOXO3a in airway epithelial cells increases mitochondrial ROS leading to MAVS conformational change. This in turn attenuates virus-stimulated dsRNA receptor, IRF3 activation and antiviral IFN expression resulting in viral persistence. Deletion of FOXO3a further enhances RV-induced pro-inflammatory cytokines either directly or by increasing viral load leading to sustained lung inflammation.

References

    1. Su H, Bidere N, Lenardo M. Another fork in the road: Foxo3a regulates NF-kappaB activation. Immunity. 2004;21:133–134. doi: 10.1016/j.immuni.2004.07.015. - DOI - PubMed
    1. Willcox BJ, et al. FOXO3A genotype is strongly associated with human longevity. Proceedings of the National Academy of Sciences of the United States of America. 2008;105:13987–13992. doi: 10.1073/pnas.0801030105. - DOI - PMC - PubMed
    1. Fu Z, Tindall DJ. FOXOs, cancer and regulation of apoptosis. Oncogene. 2008;27:2312–2319. doi: 10.1038/onc.2008.24. - DOI - PMC - PubMed
    1. Zhang X, Tang N, Hadden TJ, Rishi AK. Akt, FoxO and regulation of apoptosis. Biochimica et biophysica acta. 2011;1813:1978–1986. doi: 10.1016/j.bbamcr.2011.03.010. - DOI - PubMed
    1. Hagenbuchner J, Ausserlechner MJ. Mitochondria and FOXO3: breath or die. Frontiers in physiology. 2013;4:147. doi: 10.3389/fphys.2013.00147. - DOI - PMC - PubMed

Publication types