. 2020 Feb 18;221(5):744-755.
doi: 10.1093/infdis/jiz509.

Human Immunodeficiency Virus (HIV)-Infected CCR6+ Rectal CD4+ T Cells and HIV Persistence On Antiretroviral Therapy

Affiliations

Human Immunodeficiency Virus (HIV)-Infected CCR6+ Rectal CD4+ T Cells and HIV Persistence On Antiretroviral Therapy

Jenny L Anderson et al. J Infect Dis. .

Abstract

Background: Identifying where human immunodeficiency virus (HIV) persists in people living with HIV and receiving antiretroviral therapy is critical to develop cure strategies. We assessed the relationship of HIV persistence to expression of chemokine receptors and their chemokines in blood (n = 48) and in rectal (n = 20) and lymph node (LN; n = 8) tissue collected from people living with HIV who were receiving suppressive antiretroviral therapy.

Methods: Cell-associated integrated HIV DNA, unspliced HIV RNA, and chemokine messenger RNA were quantified by quantitative polymerase chain reaction. Chemokine receptor expression on CD4+ T cells was determined using flow cytometry.

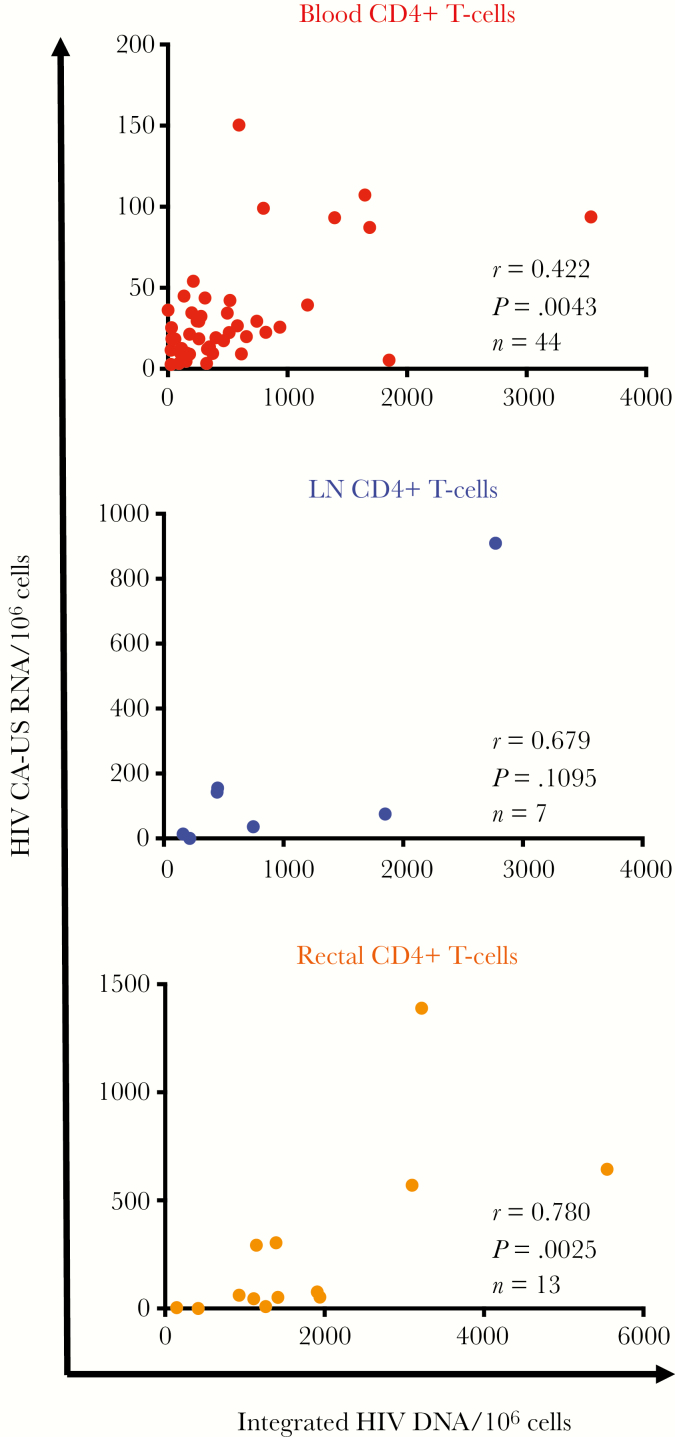
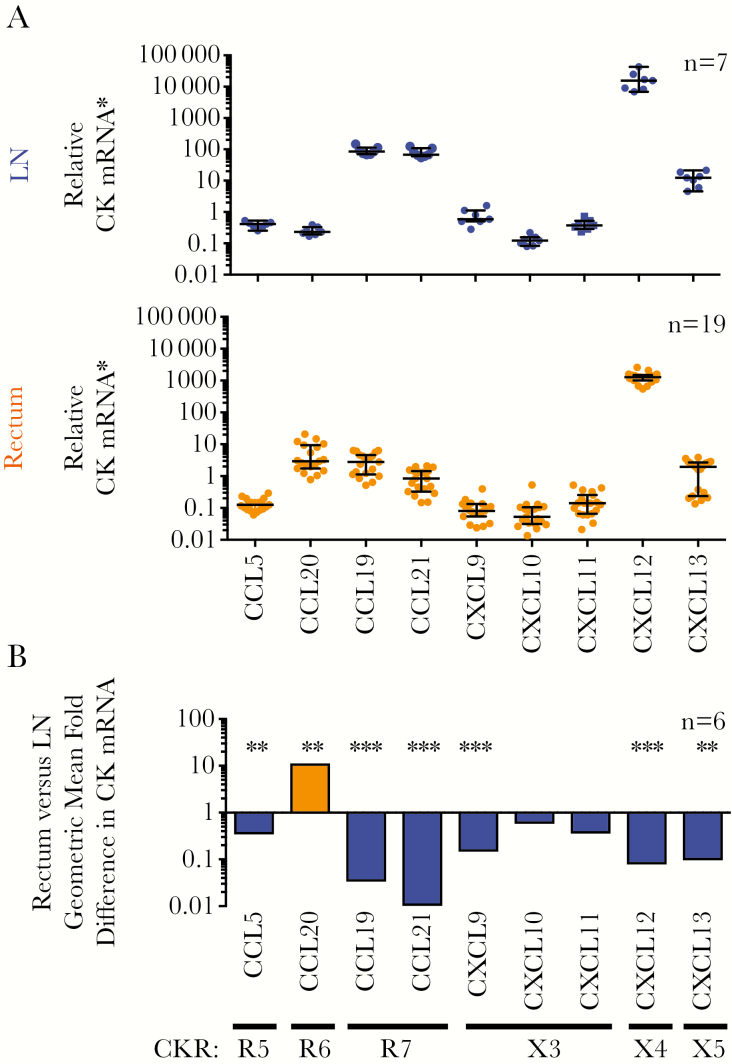
Results: Integrated HIV DNA levels in CD4+ T cells, CCR6+CXCR3+ memory CD4+ T-cell frequency, and CCL20 expression (ligand for CCR6) were highest in rectal tissue, where HIV-infected CCR6+ T cells accounted for nearly all infected cells (median, 89.7%). Conversely in LN tissue, CCR6+ T cells were infrequent, and there was a statistically significant association of cell-associated HIV DNA and RNA with CCL19, CCL21, and CXCL13 chemokines.

Conclusions: HIV-infected CCR6+ CD4+ T cells accounted for the majority of infected cells in rectal tissue. The different relationships between HIV persistence and T-cell subsets and chemokines in rectal and LN tissue suggest that different tissue-specific strategies may be required to eliminate HIV persistence and that assessment of biomarkers for HIV persistence may not be generalizable between blood and other tissues.

Keywords: CCR6; CXCR3; HIV reservoir; chemokine receptor; chemokines; latency; lymph node; persistence; rectal tissue.


Figures

Figure 1.
Figure 1.
Positive correlation between human immunodeficiency virus (HIV) integrated DNA and CA-US RNA in total CD4+ T cells from blood and rectal tissue. Figure displays integrated HIV DNA and cell-associated unspliced RNA (CA-US RNA) levels in total CD4+ T cells from peripheral blood (n = 44; top), lymph node (LN) tissue (n = 7; middle) and rectal tissue (n = 13; bottom) from people living with HIV and receiving antiretroviral therapy.
Figure 2.
Figure 2.
Rectal tissue harbors a high proportion of total memory CD4+ T cells that coexpress CCR6, CXCR3, and CCR5. Single-cell suspensions were isolated from peripheral blood (left panel), lymph node (LN) (middle panel) tissue, or rectal tissue (right panel) from people living with human immunodeficiency virus (HIV) and receiving antiretroviral therapy. Cells were then stained and analyzed with flow cytometry for expression of CD14, CD19, CD3, CD4, CD45RA, CD27, CCR5, CCR6, CXCR3, and CXCR5. A, B, Proportion of total memory CD4+ T cells that express single CKRs (A) or CCR6 and/or CXCR3 (B). C, Percentage of cells expressing the CCR5 HIV entry coreceptor in each CCR6 and/or CXCR3 subset. Data are displayed as median with interquartile range for each anatomic site, and dots represent individual donors. Differences between cell types were determined using the Wilcoxon matched-pairs signed rank test, with significance defined as P < .05. *P < .05; **P < .01, ***P < .005; **** P < .001. Abbreviations: R5, CCR5; R6, CCR6; X3, CXCR3; X5, CXCR5.
Figure 3.
Figure 3.
Relative expression of RORγT, FoxP3, and T-bet transcription factors in blood CCR6/CXCR3 memory T-cell subsets. The relative expression of T-cell transcription factor messenger RNAs (mRNAs) was assessed in CCR6/CXCR3 CD8 memory T-cell subsets sorted from the blood of 10 people living with human immunodeficiency virus and receiving antiretroviral therapy (ART), using quantitative reverse-transcription polymerase chain reaction. Transcription factors include RORγT, which marks T-helper (Th) 17 cells (A); FoxP3, which marks regulatory T (Treg) cells (B); the ratio of RORγT to FoxP3, which marks the abundance of Th17 to Treg cells (C); and T-bet, which marks Th1 cells (D). The relative expression of transcription factor mRNA in the blood T-cell subsets is shown relative to levels in a calibrator sample, here being RNA from peripheral blood mononuclear cells collected from a single healthy donor (dotted line at 1). Data are displayed as median and interquartile range, and each symbol represent an individual donor. Differences between cell types were assessed using the Wilcoxon matched-pairs signed rank test, with significance defined as P < .05. *P < .05; **P < .01. Abbreviations: R6, CCR6; X3, CXCR3.
Figure 4.
Figure 4.
Rectal CCR6+ memory CD8 T cells have a large contribution to the total pool of integrated human immunodeficiency virus (HIV) in memory CD8 T cells. Single cells isolated from peripheral blood (A, B) or rectal biopsy specimens (C–E) from 10 people living with HIV and receiving antiretroviral therapy were sorted into CD45+, CD3+, CD45RA CD8 memory T cells (CD8 RA T cells) that expressed CCR6 and/or CXCR3 or neither. Integrated HIV DNA was quantified in subsets isolated from blood (A) or rectal tissue (C). The relative contribution of each subset to the total integrated HIV DNA reservoir was calculated based on the frequency of the specific T-cell subset and the level of integrated HIV DNA in either blood (B) or rectal tissue (D, E). For rectal tissue, relative contribution was measured for the 2 sorted CCR6+CXCR3+ and non-CCR6+CXCR3+ subsets (D) and extrapolated for the 4 CCR6/CXCR3 subsets using the frequencies of the cells together with integrated HIV DNA in the non-CCR6+CXCR3+ T-cell pool to calculate relative contribution for the individual CCR6+CXCR3, CCR6CXCR3+, and CCR6CXCR3 subsets (E). Data are displayed as median and interquartile range, and each symbol represents an individual donor. P values <.05 (Wilcoxon matched-pairs signed rank test) are shown. Abbreviations: Non-R6+X3+, pooled cell fraction containing R6+X3, R6X3+ and R6X3 subsets together; R6, CCR6; X3, CXCR3. *P < .05, **P < .01, ***P < .005.
Figure 5.
Figure 5.
Rectal tissue (upper panel) is enriched in CCL20 messenger RNA (mRNA), and lymph node (LN) tissue (middle panel) is enriched in CCL19, CCL21, and other chemokine mRNA. A, Total RNA was extracted from rectal pinch biopsy specimens or LN biopsy slices collected from people living with human immunodeficiency virus (HIV) and receiving antiretroviral therapy. Next, 100-ng aliquots of total RNA were analyzed for chemokine mRNA or 18S ribosomal RNA (rRNA) expression using quantitative reverse-transcription polymerase chain reaction. Chemokine RNA levels were normalized to cellular 18S rRNA, and relative chemokine mRNA was calculated as the fold difference in samples relative to a calibrator (untreated peripheral blood mononuclear cells) from a healthy donor for most chemokines or liver tissue for CCL21 mRNA). Data are displayed as median and interquartile range, and each dot represents an individual donor. B, For participants who donated both rectal and LN samples (n = 6), the geometric mean fold difference in chemokine mRNA for rectal tissue compared with LN tissue is shown for each chemokine (vertical labeling). Chemokine receptors (CKRs) that bind chemokines encoded by the chemokine mRNA are also shown. Relative chemokine mRNA levels in rectal and LN tissue were log-transformed and compared using a paired t test (Supplementary Table 6). *P < .01; †P < .001. Abbreviations: R5, CCR5; R6, CCR6; R7, CCR7: X3, CXCR3; X4, CXCR4; X5, CXCR5.

References

    1. Chun TW, Carruth L, Finzi D, et al. . Quantification of latent tissue reservoirs and total body viral load in HIV-1 infection. Nature 1997; 387:183–8. - PubMed
    1. Finzi D, Hermankova M, Pierson T, et al. . Identification of a reservoir for HIV-1 in patients on highly active antiretroviral therapy. Science 1997; 278:1295–300. - PubMed
    1. Wong JK, Hezareh M, Günthard HF, et al. . Recovery of replication-competent HIV despite prolonged suppression of plasma viremia. Science 1997; 278:1291–5. - PubMed
    1. Hosmane NN, Kwon KJ, Bruner KM, et al. . Proliferation of latently infected CD4+ T cells carrying replication-competent HIV-1: potential role in latent reservoir dynamics. J Exp Med 2017; 214:959–72. - PMC - PubMed
    1. Ganusov VV, De Boer RJ. Do most lymphocytes in humans really reside in the gut? Trends Immunol 2007; 28:514–8. - PubMed

Publication types

MeSH terms