. 2020 Feb;9(2):e974.
doi: 10.1002/mbo3.974. Epub 2019 Dec 3.

Whole-genome comparison between the type strain of Halobacterium salinarum (DSM 3754T ) and the laboratory strains R1 and NRC-1

Affiliations

Whole-genome comparison between the type strain of Halobacterium salinarum (DSM 3754T ) and the laboratory strains R1 and NRC-1

Friedhelm Pfeiffer et al. Microbiologyopen. 2020 Feb.

Abstract

Halobacterium salinarum is an extremely halophilic archaeon that is widely distributed in hypersaline environments and was originally isolated as a spoilage organism of salted fish and hides. The type strain 91-R6 (DSM 3754T ) has seldom been studied and its genome sequence has only recently been determined by our group. The exact relationship between the type strain and two widely used model strains, NRC-1 and R1, has not been described before. The genome of Hbt. salinarum strain 91-R6 consists of a chromosome (2.17 Mb) and two large plasmids (148 and 102 kb, with 39,230 bp being duplicated). Cytosine residues are methylated (m4 C) within CTAG motifs. The genomes of type and laboratory strains are closely related, their chromosomes sharing average nucleotide identity (ANIb) values of 98% and in silico DNA-DNA hybridization (DDH) values of 95%. The chromosomes are completely colinear, do not show genome rearrangement, and matching segments show <1% sequence difference. Among the strain-specific sequences are three large chromosomal replacement regions (>10 kb). The well-studied AT-rich island (61 kb) of the laboratory strains is replaced by a distinct AT-rich sequence (47 kb) in 91-R6. Another large replacement (91-R6: 78 kb, R1: 44 kb) codes for distinct homologs of proteins involved in motility and N-glycosylation. Most (107 kb) of plasmid pHSAL1 (91-R6) is very closely related to part of plasmid pHS3 (R1) and codes for essential genes (e.g. arginine-tRNA ligase and the pyrimidine biosynthesis enzyme aspartate carbamoyltransferase). Part of pHS3 (42.5 kb total) is closely related to the largest strain-specific sequence (164 kb) in the type strain chromosome. Genome sequencing unraveled the close relationship between the Hbt. salinarum type strain and two well-studied laboratory strains at the DNA and protein levels. Although an independent isolate, the type strain shows a remarkably low evolutionary difference to the laboratory strains.

Keywords: comparative genomics; genomic variability; haloarchaea; halobacteria; megaplasmid; type strain.


Conflict of interest statement

None declared.

Figures

Figure 1
Figure 1
Genomic maps of Hbt. salinarum strain 91‐R6 chromosome (left) and plasmids pHSAL1 and pHSAL2 (right). Identities (and components) of the concentric rings are given by the color key (upper left). Tick marks around the outside of each map show DNA size in Mb (chromosome) or kb (plasmids). The two outermost rings of each map depict annotated genes (CDS, tRNA and rRNA) for the forward and reverse DNA strands. Ring three (light blue) shows CTAG motifs. In the chromosome map, the fourth level shows MGEs (gray), and the 5th level (brown) displays predicted genomic islands (IslandView 4). The 6th level of the chromosome map (4th level of the plasmid maps) represent BLASTn comparisons to other sequences (pink); for the chromosome, the target sequence is the strain R1 chromosome, while the plasmids have been compared to each other. For comparison of pHSAL1 to plasmids from the laboratory strains see Figure A1 Appendix 2. Pink represents significant sequence similarity (E value ≤ 10–10), and white indicates no significant similarity. The 7th level of the chromosome map (5th level for plasmids) is a plot of GC content (black), with higher than average GC regions directed outwards and lower than average GC regions directed toward the center. The inner‐most ring in all maps is a plot of cumulative GC‐skew (green/purple). The maps and plots were made using the CGView Server (http://stothard.afns.ualberta.ca/cgview_server)
Figure 2
Figure 2
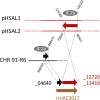
Junction analysis of the 42.5 kb region shared between divSEG12 and plasmid pHS3 of strain R1. The shared region of 42.5 kb is schematically depicted. The lower panel displays pHS3, the upper panel displays the chromosome of strain 91‐R6 (divSEG12). The shared region is scrambled into four fragments (indicated by four shades of blue), each labeled by its tag from Table 5 (p3I, J, K, L) or Table 6 (c10, 11, 13, 16). MGEs at junctions are indicated by gray arrows. A pair of MGEs of subtype ISH3C, which have triggered a genome rearrangement in strain 91‐R6, are tagged “3C.” A hybrid TSD around these (ATGAT) is indicated. See also Figure 5 for this pair of elements. An MGE of subtype ISH3B, which is involved in a distinct genome rearrangement (see Figure 3) is indicated. A pair of MGEs of subtype ISH8B, which have triggered an inversion in strain R1, is indicated (see also Figure 6). Two hybrid TSDs around these (AGTCGTATCC and CTTCGAGGCGG) are indicated. On the other side of the transposons of subtype ISH8B, is a split MGE of type ISH32, the fragments of which are indicated by olive arrows (see also Figure 6). The ISH32 element is not shared with strain 91‐R6. The boxed red arrow indicates additional MGEs in this MGE conglomerate. An 8 kb strain‐specific region in strain 91‐R6 (Table 6; tag c12) corresponds to an ISH2 element in strain R1. The lack of a TSD around that ISH2, which separates p3K and p3L, is indicated by red crosses. At each junction, one version can be discerned to correspond to the parent (PARENT) while the other is rearranged (REARR) with matching junctions having the same color. For further details on junction analysis, see Appendix 8. This text also describes targeted and truncated protein‐coding genes, which (for clarity) are not indicated in this figure. Nucleotide positions for some of the key sites (vertical numbers) are shown to aid in orientation of these regions
Figure 3
Figure 3
Junction analysis details for junction JC1. Junction analysis for a disrupted protein‐coding gene where the N‐terminal part is encoded in strain 91‐R6 on the chromosome (within divSEG12; region c16; see Table 6) and the C‐terminal part on the duplicated region of pHSAL1/pHSAL2. A nondisrupted homolog is ACP99_RS08965 from Halobellus rufus. The gene in strain R1 is encoded on plasmid pHS3 (regions p3I + H+G) but is disrupted by an ISH2 element which is bounded by an extremely long TSD (55 bp), thus duplicating 18 codons. In strain 91‐R6, a transposon of subtype ISH3B follows the N‐terminal fragment and precedes the C‐terminal fragment, which additionally has been targeted by ISHsal2. The copies of ISH3B have a hybrid TSD (AAATT), indicating an MGE‐triggered genome rearrangement. The ISH3B on pHSAL1/pHSAL2 has been targeted by MGE ISH5. For further details see Appendix 8. For ease of orientation, the nucleotide positions of some key sites are shown (black)
Figure 4
Figure 4
Junction analysis details for junction JC2. Schematic diagram of junction analysis for a disrupted protein‐coding gene where the N‐terminal part is encoded in strain 91‐R6 on the chromosome (within divSEG12; region c09; see Table 6) and the C‐terminal part on the duplicated region of pHSAL1/pHSAL2. A nondisrupted homolog is rrnAC2017 from Haloarcula marismortui. There is no close homolog in strain R1. The fragments of this disrupted gene do not terminate directly at MGEs. For ease of orientation, the nucleotide positions of some key sites are shown (black)
Figure 5
Figure 5
Population heterogeneity with respect to ISH3C and an optional 16 kb sequence. This schematic figure illustrates (i) genome rearrangements around copies of the MGE ISH3C (ISH3C elements indicated by gray arrows) with unique adjacent sequences being color‐coded according to the configuration in the representative genome, (ii) the presence/absence of an optional 16 kb sequence, and (iii) the presence of an optional MITEHsal2 within that 16 kb sequence (which occurs in addition to the regular MITEHsal2 in that sequence). (a) Diagram representing the 16 kb optional sequence and its flanking MGEs (ISHsal15 at the left, and ISH3C at the right), along with the optional and regular MITEHsal2 elements that it carries. PacBio reads supporting the presence of each end of the 16 kb region are shown underneath the line, and the number of reads revealing the optional MITEHsal2 are shown above. For orientation, the nucleotide positions of the termini of the bordering MGEs are given. (b) Labeled “inversion (representative genome),” this diagram represents the database version of the chromosome (CP038631.1). The number of supporting PacBio reads for each of the ISH3C elements, for the left junction of the 16 kb sequence, and for the position that suffered targeting by the optional MITHsal2, are shown with yellow highlighting. In lower lines where the same numbers are repeated, they are shown in gray font (with yellow highlighting). The representative genome shows an inversion in this region compared to the inferred parental sequence depicted in line (c) below, and is labeled accordingly (affecting the unique regions tagged by orange/green color and inverting the ISH3C tagged by blue color). The inferred parental version is consistent with the equivalent sequences in R1 plasmid pHS3 (see Figure 2). However, this version is supported by only few PacBio reads (12) at its left end, and thus has not been selected as representative genome. (d) The inferred parental sequence has been affected by deletion of the optional 16 kB sequence. This deletion is frequent in the population (supported by 144 PacBio reads), which may indicate that the 16 kb sequence is gradually being lost from the population. The deletion extends into and truncates the upstream ISHsal15 (thin red arrow). This MGE is also involved in a 202 kb inversion in combination with an optional copy of that MGE (see Figure 10). (e) The inversion which distinguishes the inferred parental sequence from the representative genome occurred independently after deletion of the 16 kb sequence (“inversion after 16 kb deletion”). However, this is supported by only few (6) PacBio reads. (f) This diagram illustrates two independent deletions triggered by a pair of ISH3C transposons which occur in the same orientation. The copy of ISH3C marked blue switches its orientation due to the inversion triggered by the elements tagged orange/green. For the deletion affecting the green/blue unique sequences, this deletion occurred in the version labeled “16 kb deletion” (curved arrow between lines f and d). For the deletion affecting the brown/blue unique sequences, it is uncertain whether the deletion occurred in versions (d) or (c)
Figure 6
Figure 6
Junction analysis details for junction JB2. Junction analysis for a pair of transposons of subtype ISH8B on R1 plasmid pHS3. The two elements show two hybrid TSDs. On one side are two disrupted genes (OE_5405F, encoded on p3J and OE_5013R, encoded on p3L; see Table 5). Together, these correspond to HBSAL_04690 (encoded at the junction of c10 and c11; see Table 6) which is a full‐length homolog of HALXA_0005. On the other side are fragments of an MGE (ISH32) which together form a complete element and also have a hybrid TSD. For orientation, nucleotide positions for some key sites are shown (black text). This is one of the junctions represented in Figure 2. For further details see Appendix 8
Figure 7
Figure 7
Population heterogeneity with respect to MITEHsal2. The diagrams exemplify two types of population heterogeneity, optional MGEs and MGE‐triggered genome rearrangements. (a) There are five regular and two optional copies of MITEHsal2 in the chromosome and (b) three regular copies in plasmid pHSAL2. The different unique neighboring sequences are color‐coded. For the optional copies, the genome position and the number of PacBio reads in support of each of them is indicated at the right edge (yellow highlighted). The ambiguity of their genome positions is due to TSDs (CAC and TGGCTTA, respectively) (c) Six distinct connections across the copy of MITEHsal2 at 935 Mb were observed in PacBio reads as indicated by color‐coding. The aberrant connections represent genome rearrangements but have only low coverage. For further details see Appendix 10
Figure 8
Figure 8
Population heterogeneity with respect to ISHsal1. The diagram exemplifies three types of population heterogeneity: optional MGEs, MGE‐triggered genome rearrangements, and optional integration of a plasmid into a chromosome. For further details see Appendix 10. (a) There are four regular and one optional copies of ISHsal1 in the chromosome and one regular copy in plasmid pHSAL2. The different unique neighboring sequences are color‐coded. For the optional copy, the genome position and the number of supporting PacBio reads are indicated at the right edge (yellow highlighted). (b) For the optional element (see a), genome rearrangements with five distinct connections were detected (left side: blue; 58 PacBio reads in total). For the elements involved in the genome inversion (see c), genome rearrangements with eight distinct connections were detected (left side: green; 133 PacBio reads in total). Some of the alternative connections can only be explained if plasmid pHSAL2 has been integrated into the chromosome. (c) A genome inversion is triggered by ISHsal1
Figure 9
Figure 9
PacBio reads traversing optional MGEs which are 14.6 kb apart. A total of 15 PacBio reads (numbers with yellow highlight) traverse the region carrying optional copies of MITEHsal2 (brown arrow) and ISHsal1 (red arrow). Their insertion positions are indicated in the top line. Aside from eight PacBio reads which lack both MGEs and five PacBio reads which contain both, there are two PacBio reads which contain only one of the elements (MITEHsal2). These reads indicate that MITEHsal2 has integrated first, followed by ISHsal1 (left, black arrows). The alternative order of MGE accumulation (ISHsal1 first, followed by MITEHsal2, right, gray arrows) is not supported by any PacBio read (red cross)
Figure 10
Figure 10
Population heterogeneity with respect to ISHsal15. There are two copies of ISHsal15 (red arrows), one being optional (see case C in Appendix 10). (a) Diagram of the representative genome (CP038631) showing the regular copy of ISHsal15 (left, nt 850,934–851,878) adjacent to the 16 kb optional region, and also the region around nt 1,054,517 (right), in this case without the optional ISHsal15. (b) The same genome regions as in (a) but in this case showing the optional copy of ISHsal15 inserted just after nt 1,054,517. The regular copy shows population heterogeneity with respect to its completeness or truncation, and is complete only if the optional 16 kb sequence is present (see Figure 5 and case D in Appendix 10). PacBio read counts across the variant regions (displayed with yellow highlight), show that the optional copy without a further genome rearrangement (as shown in b) is relatively infrequent. (c) A genome inversion was detected in genomes which contain the optional as well as the complete version of the regular copy (bottom). The optional copy is much more frequent in the genome‐inverted version than in the noninverted version
Figure A1
Figure A1
Plasmid pHSAL1 compared to pNRC200, pHS3, and pHSAL2. Plasmid map of strain 91‐R6 plasmid pHSAL1 showing the similarity of its nucleotide sequence (BLASTn, E‐values ≤ 10–15) to plasmids pNRC200 (pink), pHS3 (red), and pHSAL2 (gray). The GC content is shown below (black), with regions of higher than average GC directed outwards, and regions of lower than average GC directed inwards. Size scale (in kb) is shown at the periphery. Coding sequences (CDS, blue) are shown for both strands, and MGEs are indicated by black arrows
Figure A2
Figure A2
Schematic of junctions JA1 and JA2 around the 39,230 bp duplication between plasmids pHSAL1 and pHSAL2. The duplicated part (central) is indicated in red. Sequences unique to pHSAL1 in blue and those unique to pHSAL2 in green. MGEs are indicated by gray arrows or (at the left end) an MGE‐targeted MGE is indicated in olive green. At this end, it remains uncertain whether one of the plasmids corresponds to the parental configuration (“NOT DECIDABLE”) because neither a TSD is encountered (red crosses) nor a disrupted gene. At the 3′ end, a TSD exists around the MGE of pHSAL2 (AGCCGCCA), while the upstream sequence is not duplicated on the other side in pHSAL1 (red cross). The MGE has targeted a gene. While the N‐terminal part is encoded on both plasmids, the C‐terminal part is encoded exclusively on pHSAL2. Thus, pHSAL2 can be discerned as the parental configuration (PARENT) and pHSAL1 as a rearrangement (REARR). For orientation, some nucleotide positions of key sites are shown (vertical), and at the lower right the numbers of two locus tags of two pHSAL2 CDS and that of Natrialba asiatica (C481_14553) are given (in colors corresponding to their respective colored arrows in the diagram). For further details see Appendix 8
Figure A3
Figure A3
Growth of strains R1 (panel a) and 91‐R6 (panel b) in minimal medium (HDM) with or without leucine, isoleucine, or valine. Strains 91‐R6 and R1 were grown in synthetic medium (HDM) with or without (–) the following branched‐chain amino acid additions: isoleucine (I), valine (V), or leucine (L). For example, HDM––– denotes HDM lacking all three branched‐chain amino acids, while HDM IVL represents HDM with all three amino acids added. For comparison, both strains were also grown in complex medium (HM). Color keys for each culture are given at the right of each panel. Both strains grow much better in complex medium than in defined medium. Strain 91‐R6 requires no addition of branched‐chain amino acids to grow, consistent with the identification of leucine and isoleucine/valine biosynthesis genes in its genome. Growth of strain R1 is equivalent to that of strain 91‐R6 when all three branched‐chain amino acids are supplemented. Strain R1 (panel a) grows very poorly in the absence of leucine (L), consistent with genomic reconstruction. Unexpectedly, strain R1 was found to grow considerably better in HDM supplemented with leucine compared to HDM supplemented with isoleucine (I) or valine (V), which is not consistent with the current interpretation of its genome reconstruction data

References

    1. Abdul Halim, M. F. , Pfeiffer, F. , Zou, J. , Frisch, A. , Haft, D. , Wu, S. , … Pohlschroder, M. (2013). Haloferax volcanii archaeosortase is required for motility, mating, and C‐terminal processing of the S‐layer glycoprotein. Molecular Microbiology, 88, 1164–1175. - PubMed
    1. Aivaliotis, M. , Gevaert, K. , Falb, M. , Tebbe, A. , Konstantinidis, K. , Bisle, B. , … Oesterhelt, D. (2007). Large‐scale identification of N‐terminal peptides in the halophilic archaea Halobacterium salinarum and Natronomonas pharaonis . Journal of Proteome Research, 6, 2195–2204. - PubMed
    1. Altschul, S. F. , Madden, T. L. , Schaffer, A. A. , Zhang, J. , Zhang, Z. , Miller, W. , & Lipman, D. J. (1997). Gapped BLAST and PSI‐BLAST: A new generation of protein database search programs. Nucleic Acids Research, 25, 3389–3402. - PMC - PubMed
    1. Ausiannikava, D. , Mitchell, L. , Marriott, H. , Smith, V. , Hawkins, M. , Makarova, K. S. , … Allers, T. (2018). Evolution of genome architecture in Archaea: Spontaneous generation of a new chromosome in Haloferax volcanii . Molecular Biology and Evolution, 35, 1855–1868. - PMC - PubMed
    1. Beer, K. D. , Wurtmann, E. J. , Pinel, N. , & Baliga, N. S. (2014). Model organisms retain an “ecological memory” of complex ecologically relevant environmental variation. Applied and Environment Microbiology, 80, 1821–1831. - PMC - PubMed

Substances

LinkOut - more resources