. 2019 Dec 4;10(1):5536.
doi: 10.1038/s41467-019-13483-w.

The Escherichia coli transcriptome mostly consists of independently regulated modules

Affiliations

The Escherichia coli transcriptome mostly consists of independently regulated modules

Anand V Sastry et al. Nat Commun. .

Abstract

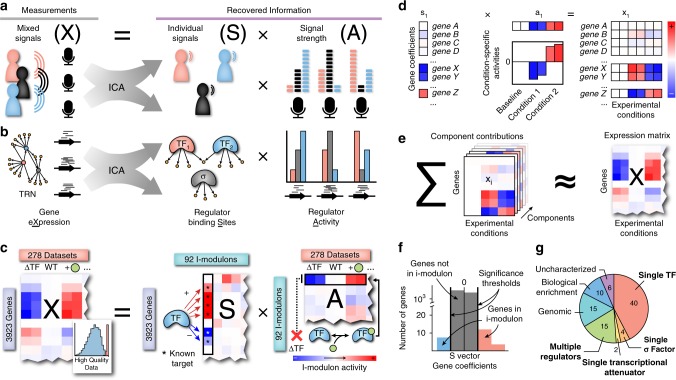
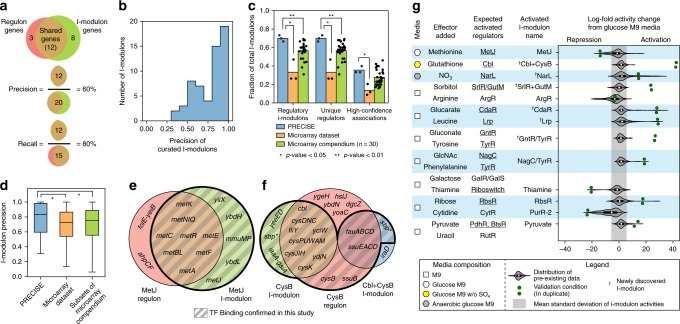
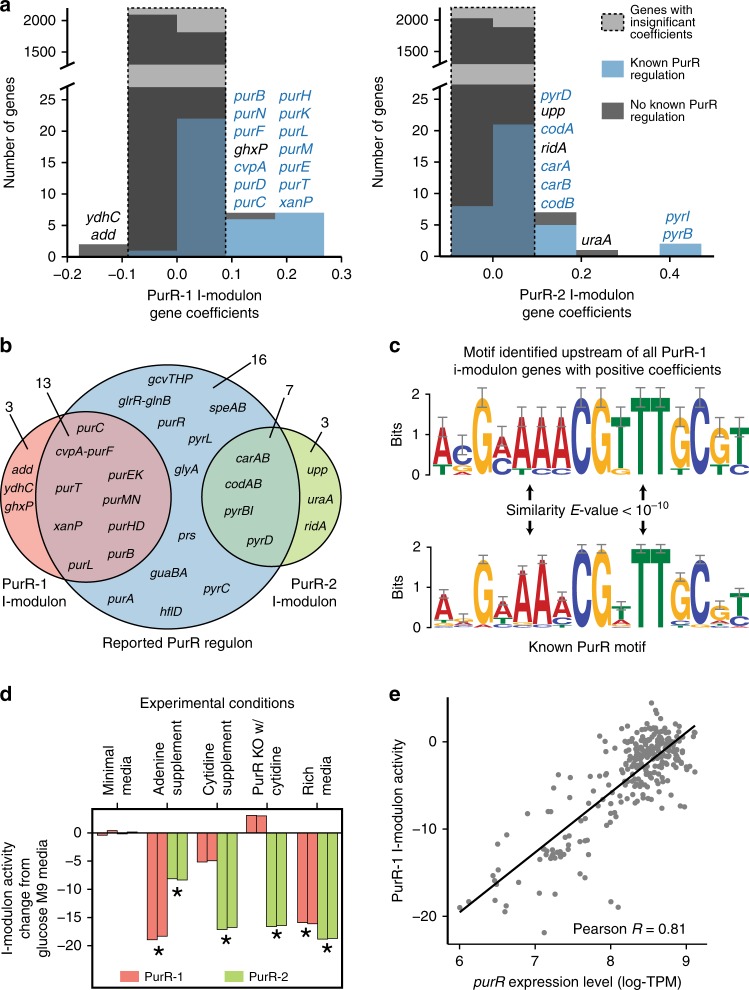
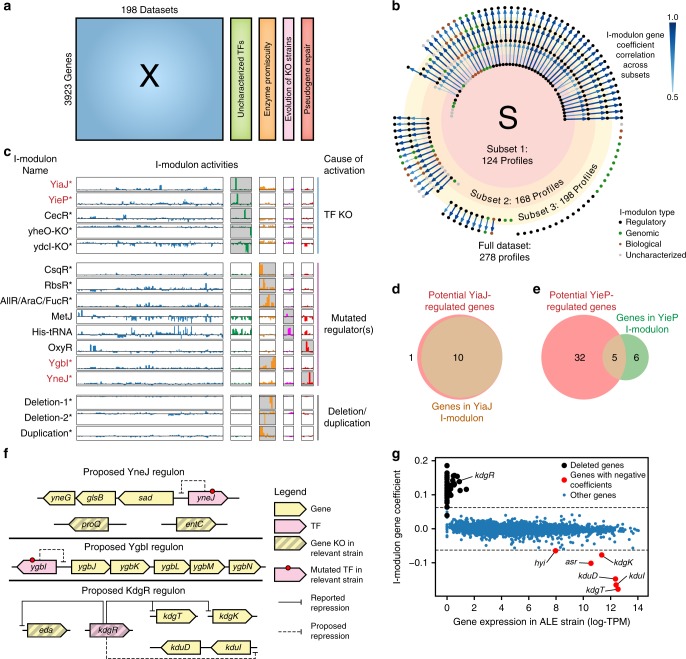
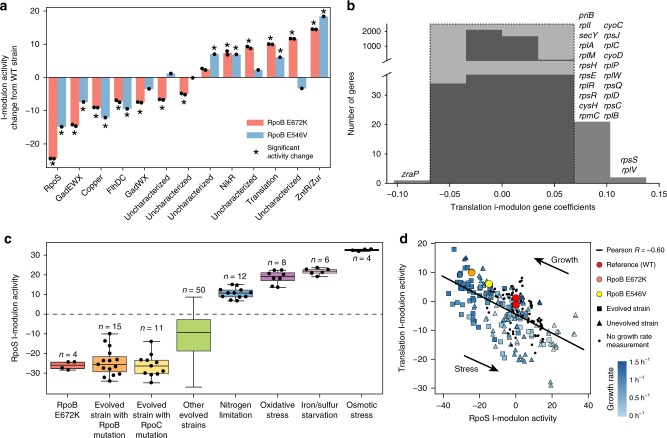
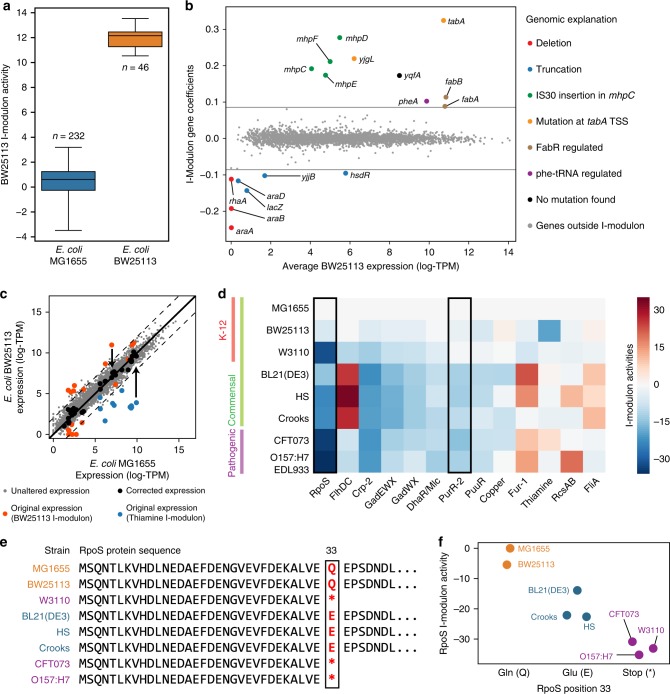
Underlying cellular responses is a transcriptional regulatory network (TRN) that modulates gene expression. A useful description of the TRN would decompose the transcriptome into targeted effects of individual transcriptional regulators. Here, we apply unsupervised machine learning to a diverse compendium of over 250 high-quality Escherichia coli RNA-seq datasets to identify 92 statistically independent signals that modulate the expression of specific gene sets. We show that 61 of these transcriptomic signals represent the effects of currently characterized transcriptional regulators. Condition-specific activation of signals is validated by exposure of E. coli to new environmental conditions. The resulting decomposition of the transcriptome provides: a mechanistic, systems-level, network-based explanation of responses to environmental and genetic perturbations; a guide to gene and regulator function discovery; and a basis for characterizing transcriptomic differences in multiple strains. Taken together, our results show that signal summation describes the composition of a model prokaryotic transcriptome.


Conflict of interest statement

The authors declare no competing interests.

Figures

Fig. 1
Fig. 1
ICA extracts regulatory signals from expression data. a Given three microphones recording three people speaking simultaneously, each microphone records each voice (i.e. signal) at different volumes (i.e. signal strengths) based on their relative distances. Using only these measured mixed signals, ICA recovers the original signals and their relative signal strengths by maximizing the statistical independence of the recovered signals,. The mixed signals (X) are a linear combination of the matrix of recovered source signals (S) and the mixing matrix (A) that represents the relative strength of each source signal in the mixed output signals. This relationship is mathematically described as X = SA. b An expression profile under a specific condition can be likened to a microphone in a cell, measuring the combined effects of all transcriptional regulators. c Schematic illustration of ICA applied to a gene expression compendium. See Supplementary Fig. 1a, b for additional details on data quality. The example TF is a dual regulator that primarily upregulates genes, and is activated by the green circular metabolite. Example experimental conditions shown are a TF knock-out, wild-type, and wild-type grown on medium supplemented with the activating metabolite. Each column of X contains an individual expression profile across 3923 genes in E. coli. d Each component (column of S) contains a coefficient for each gene. These coefficients are scaled by the component’s condition-specific activities (row in A) to form the component’s contribution to the transcriptomic compendium e. The sum of the contributions from the 92 components reconstructs most of the variance in the original compendium. f Independent components are converted into i-modulons by removing all genes with coefficients within a significance threshold (indicated in gray). Significant genes may have either positive (red) or negative (blue) coefficients. g Distribution of i-modulon categories. Categories of regulatory i-modulons are labeled in bold font. Genomic i-modulons account for single gene knock-outs, large deletions or duplications of genomic regions. Biological i-modulons contain genes enriched for a specific function, but are not linked to a specific transcriptional regulator. For more information, see Supplementary Fig. 1 and Supplementary Table 1.
Fig. 2
Fig. 2
Validation of I-modulon–Regulator relationships. a Precision is the fraction of genes in an i-modulon that are in the linked regulon, and recall is the fraction of genes in a regulon that are in the linked i-modulon. b Precision across all 61 regulatory i-modulons. c Fraction of total i-modulons significantly enriched with targets from a single transcriptional regulator. I-modulons generated from PRECISE (blue) were compared against i-modulons generated from a microarray dataset with 266 expression profiles (orange), and i-modulons generated from 10 similar-sized subsets of a single-platform microarray compendium (green). Each dataset was analyzed using three-fold cross-validation (see the “Methods” section), resulting in 30 data points for the microarray compendium. Single star represents a Mann–Whitney U-test p-value < 0.05, and double star represents a p-value < 0.01. d Boxplots comparing the precision of regulatory i-modulons across all three datasets. Single star represents a Mann–Whitney U-test p-value < 0.05. Boxplot whiskers represent extrema of data, box bounds represent upper and lower quartiles, and center-line represents the median value. e Comparison of genes in the MetJ regulon (red) and i-modulon (green). Genes validated by ChIP-exo are in the shaded regions. Gene names for co-transcribed genes were combined (e.g. metBL represents the transcription unit containing metB and metL) (f) Comparison of genes in the CysB regulon (red) and the CysB and Cbl + CysB i-modulons (green and blue, respectively). Most genes in the Cbl + CysB i-modulon were regulated by both Cbl and CysB. The starred gene, sbp, was a member of both i-modulons but was not in the reported CysB regulon. Genes with TF binding as determined by ChIP-exo are in the shaded regions. g Ten media for predicted i-modulon activations. Correctly activated i-modulons are underlined. Distribution of i-modulon activities from pre-existing data includes all data from PRECISE excluding the 10 validation conditions. The gray shaded region represents the average standard deviation across pre-existing i-modulon activities. All amino acid supplements were l-form, and all sugars were d-form. Abbreviations: GlcNAc N-acetyl-glucosamine.
Fig. 3
Fig. 3
ICA reveals independent modules within the PurR regulon. a Histograms of gene coefficients in the PurR-1 and PurR-2 i-modulons. b Comparison of genes in the reported PurR regulon (blue), PurR-1 i-modulon (red) and PurR-2 i-modulon (green). Gene names for co-transcribed genes were combined (e.g. codAB represents codA and codB). c Motif identified upstream of genes in the PurR-1 i-modulon compared to the reported PurR motif from RegulonDB. This motif was identified upstream of the guanine/hypoxanthine transporter encoding gene ghxP, although regulator binding was not previously reported. d The two PurR-associated i-modulons exhibited distinct responses to environmental perturbations. Asterisks denote significant i-modulon activities as compared to the reference condition (see the “Methods” section). Each bar represents a single biological replicate. e The PurR-1 i-modulon activity level is highly correlated with purR expression level across all conditions (excluding the PurR knock-out), whereas the PurR-2 i-modulon activity exhibits poor correlation (see Supplementary Fig. 4d). Similar information on all 92 i-modulons is available in Supplementary Data 2. Abbreviations: log-TPM log-transformed transcripts per million.
Fig. 4
Fig. 4
ICA provides answers to unasked questions. a Schematic illustration of appending four new datasets to PRECISE. b Comparison of ICA results on three nested subsets of the PRECISE compendium. Each node represents an i-modulon and is colored by type (e.g. regulatory or genomic). Components are linked by an arrow if their gene coefficients are correlated (Pearson R > 0.5). Arrow widths and color represent correlation strength. c Compendium-wide activities for selected i-modulons. Each bar represents the activity of the denoted i-modulon in a single expression profile. Starred i-modulons were discovered after addition of the four new datasets. I-modulons in red font propose regulons for previously uncharacterized TFs. I-modulons are grouped based on the genetic perturbation (e.g. TF KO, mutation in regulator) that activated the specific i-modulon. The dataset responsible for the i-modulon activation is highlighted in gray for each i-modulon. d Venn diagram comparing genes in the YiaJ i-modulon and genes with ChIP-exo determined binding sites for YiaJ. e Venn diagram comparing genes in the YieP i-modulon and genes with ChIP-exo determined binding sites for YieP. f Predicted regulatory roles based on i-modulons for YneJ, YgbI, and KdgR. g Scatterplot of gene expression in strain with 39-gene deletion against the Deletion-1 i-modulon gene coefficients. The Deletion-1 i-modulon has a negative activity for the strain with the deletion, indicating that genes with positive i-modulon coefficients are not expressed in this strain, whereas genes with negative i-modulon coefficients are over-expressed in this strain.
Fig. 5
Fig. 5
Two i-modulons characterize the ‘Fear vs. Greed’ Tradeoff. a Comparison of i-modulon activities in the RpoB E672K and RpoB E546V mutant strains grown on glucose minimal media against wild-type activities. Significant i-modulon activities are designated by asterisks (see the “Methods” section). For detailed information about these i-modulons, see Supplementary Data 2. b Histogram of translation i-modulon gene coefficients. Gene names are shown for genes above threshold. c The RpoS i-modulon activities revealed the stress level of the cell under various conditions. Boxplot whiskers represent extrema, box bounds represent upper and lower quartiles, and center-line represents the median value. d The RpoS i-modulon activities were anti-correlated with the Translation i-modulon activities, highlighting the trade-off between stress-hedging and growth. Single nucleotide mutations in RpoB (in yellow and orange) shifted cellular resources along this line from the wild-type strain (in red). Points were colored by growth rate measurements when available.
Fig. 6
Fig. 6
I-modulons identify differences in transcriptional regulation across multiple E. coli strains. a Boxplot of BW25113 i-modulon activities separated by strain. Number of expression profiles in PRECISE from each strain is shown. Boxplot whiskers represent extrema of data, box bounds represent upper and lower quartiles, and center-line represents the median value. b Scatterplot of average BW25113 expression against BW25113 i-modulon activity. Deletions and truncations in the BW25113 strain account for all genes with negative coefficients. An insertion sequence (IS30) in the mhpC gene in the BW25113 strain corresponds to a large increase in expression of mhpCDEF, as IS30 contains a known promoter. Point mutations at the predicted transcription start site (TSS) of tabA, in the FabR regulator, and in the phenylalanine tRNA pheV, account for other genes with positive coefficients (see Supplementary Table 7). c Subtraction of the BW25113 and Thiamine i-modulons from the E. coli BW25113 expression profile accounts for the major transcriptomic deviations from E. coli MG1655 grown without thiamine. Dashed lines indicate four-fold difference in TPM. d Heatmap of estimated i-modulon activities for eight E. coli strains grown on glucose minimal media (with added thiamine and ferric chloride for BW25113). Only significantly altered regulatory i-modulon activities are shown. Boxed i-modulon activities are referred to in the main text. e Sequence alignment of the RpoS protein across the eight E. coli strains. f RpoS activities of the eight strains grouped by position 33 in the RpoS protein sequence, as detailed in panel e. Abbreviations: TSS transcription start site.

References

    1. Galagan JE, et al. The Mycobacterium tuberculosis regulatory network and hypoxia. Nature. 2013;499:178–183. doi: 10.1038/nature12337. - DOI - PMC - PubMed
    1. Buescher JM, et al. Global network reorganization during dynamic adaptations of Bacillus subtilis metabolism. Science. 2012;335:1099–1103. doi: 10.1126/science.1206871. - DOI - PubMed
    1. Gama-Castro S, et al. RegulonDB version 9.0: high-level integration of gene regulation, coexpression, motif clustering and beyond. Nucleic Acids Res. 2016;44:D133–D143. doi: 10.1093/nar/gkv1156. - DOI - PMC - PubMed
    1. Santos-Zavaleta A, et al. A unified resource for transcriptional regulation in Escherichia coli K-12 incorporating high-throughput-generated binding data into RegulonDB version 10.0. BMC Biol. 2018;16:91. doi: 10.1186/s12915-018-0555-y. - DOI - PMC - PubMed
    1. ENCODE Project Consortium. The ENCODE (ENCyclopedia Of DNA Elements) Project. Science. 2004;306:636–640. doi: 10.1126/science.1105136. - DOI - PubMed

Publication types

MeSH terms

Substances