. 2019 Dec 4;10(1):5521.
doi: 10.1038/s41467-019-13467-w.

Gut uropathogen abundance is a risk factor for development of bacteriuria and urinary tract infection

Affiliations

Gut uropathogen abundance is a risk factor for development of bacteriuria and urinary tract infection

Matthew Magruder et al. Nat Commun. .

Abstract

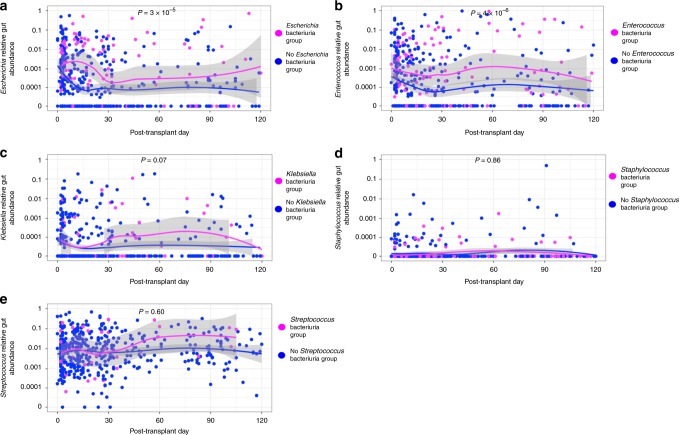
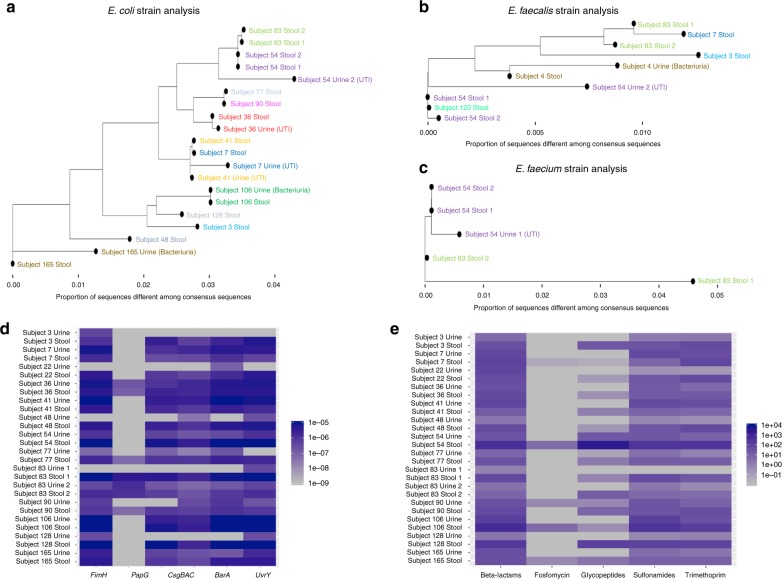
The origin of most bacterial infections in the urinary tract is often presumed to be the gut. Herein, we investigate the relationship between the gut microbiota and future development of bacteriuria and urinary tract infection (UTI). We perform gut microbial profiling using 16S rRNA gene deep sequencing on 510 fecal specimens from 168 kidney transplant recipients and metagenomic sequencing on a subset of fecal specimens and urine supernatant specimens. We report that a 1% relative gut abundance of Escherichia is an independent risk factor for Escherichia bacteriuria and UTI and a 1% relative gut abundance of Enterococcus is an independent risk factor for Enterococcus bacteriuria. Strain analysis establishes a close strain level alignment between species found in the gut and in the urine in the same subjects. Our results support a gut microbiota-UTI axis, suggesting that modulating the gut microbiota may be a potential novel strategy to prevent UTIs.


Conflict of interest statement

The authors of this manuscript have the following competing interests to disclose. M.J.S. receives research support from Allergan, Merck, Contrafect, and BioFire Diagnostics, and received consulting fees from Acahogen, Inc. and Shionogi; L.F.W. receives research support from Accelerate Diagnostics, Inc and BioFire Diagnostics, LLC; C.C. receives support from Redhill, MERCK, Rebiotix, Seres, and Finch Therapeutics.; E.P. has received speaker honoraria from Bristol Myers Squibb, Celgene, Seres Therapeutics, MedImmune, Novartis and Ferring Pharmaceuticals and is an inventor on patent application #WPO2015179437A1, entitled Methods and compositions for reducing Clostridium difficile infection and #WO2017091753A1, entitled Methods and compositions for reducing vancomycin-resistant enterococci infection or colonization and holds patents that receive royalties from Seres Therapeutics, Inc.; J.R.L. receives research support from BioFire Diagnostics, LLC. D.D., P.B., I.D.V., M.S., and J.R.L. are inventors on patent application #W02018187521A2 entitled Methods of detecting cell-free DNA in biological samples.

Figures

Fig. 1
Fig. 1
Temporal dynamics of relative gut abundances and respective bacteriuria. The relative gut abundance of bacteria is on the y-axis (logarithmic scale) and the post-transplant days stool specimens were collected are on the x-axis. The 510 specimens are each represented by a magenta-colored point reflecting a specimen belonging to the respective Bacteriuria Group and a blue-colored point reflecting the respective No Bacteriuria Group. LOESS curves with 95% confidence intervals (in gray) were created by group status. Comparison of relative gut abundances by group status was performed using a Wilcoxon rank sum test. a Temporal dynamics of Escherichia relative gut abundance following kidney transplantation by Escherichia Bacteriuria Group status. b Temporal dynamics of Enterococcus relative gut abundance following kidney transplantation by Enterococcus Bacteriuria Group status. c Temporal dynamics of Klebsiella relative gut abundance following kidney transplantation by Klebsiella Bacteriuria Group status. d Temporal dynamics of Staphylococcus relative gut abundance following kidney transplantation by Staphylococcus Bacteriuria Group status. e Temporal dynamics of Streptococcus relative gut abundance following kidney transplantation by Streptococcus Bacteriuria Group status. Source data are provided as a source data file.
Fig. 2
Fig. 2
Strain analysis, uropathogenic genes, and antimicrobial resistance genes in paired urine-fecal specimens. a Among 34 urine and fecal specimens profiled, 20 consensus strains for E. coli could be constructed using StrainPhlAn. A phylogenetic tree was constructed based on the E. coli strain alignment (24 markers) and the proportion of sequences that are different between strains is noted on the x-axis. Each point represents an E. coli strain from a urine or fecal specimen with different colors representing different subjects. b Among 34 urine and fecal specimens profiled, 10 consensus strains for E. faecalis could be constructed using StrainPhlAn. A phylogenetic tree was constructed based on the E. faecalis alignment (200 markers) and the proportion of sequences that are different between strains is noted on the x-axis. Each point represents an E. faecalis strain from a urine or fecal specimen with different colors representing different subjects. c Among 34 urine and fecal specimens profiled, 5 consensus strains for E. faecium could be constructed using StrainPhlAn. A phylogenetic tree was constructed based on the E. faecium alignment (200 markers) and the proportion of sequences that are different between strains is noted on the x-axis. Each point represents an E. faecium strain from a urine or fecal specimen with different colors representing different subjects. d Bacterial genes were determined using HUMAnN2 and relative abundance was estimated for each of the following uropathogenic E. coli associated genes: FimH, PapG, CsgBAC, BarA, and UvrY. A heatmap was constructed with the uropathogenic genes on the X-axis and the E. coli associated urine specimens and paired stool specimens on the Y-axis. The abundance is colored by blue intensity, log scaled. e Antibiotic resistance genes were determined using Bowtie2 on the MEGARES antibiotic resistance database and RPKM was estimated for genes that confer resistance to beta-lactams, fosfomycin, glycopeptides, sulfonamides, and trimethoprim. A heatmap was constructed with antibiotic resistance gene classes on the X-axis and the E. coli associated urine specimens and paired stool specimens on the Y-axis. The abundance is colored by blue intensity, log scaled. Source data are provided as a source data file.

References

    1. Stamm WE, Norrby SR. Urinary tract infections: disease panorama and challenges. J. Infect. Dis. 2001;183:S1–S4. doi: 10.1086/318850. - DOI - PubMed
    1. Foxman B. Urinary tract infection syndromes: occurrence, recurrence, bacteriology, risk factors, and disease burden. Infect. Dis. Clin. North Am. 2014;28:1–13. doi: 10.1016/j.idc.2013.09.003. - DOI - PubMed
    1. Hollyer I, Ison MG. The challenge of urinary tract infections in renal transplant recipients. Transpl. Infect. Dis. 2018;20:e12828. doi: 10.1111/tid.12828. - DOI - PubMed
    1. Ariza-Heredia EJ, et al. Impact of urinary tract infection on allograft function after kidney transplantation. Clin. Transpl. 2014;28:683–690. doi: 10.1111/ctr.12366. - DOI - PubMed
    1. Abbott KC, et al. Late urinary tract infection after renal transplantation in the United States. Am. J. Kidney Dis.: Off. J. Natl. Kidney Found. 2004;44:353–362. doi: 10.1053/j.ajkd.2004.04.040. - DOI - PubMed

Publication types

MeSH terms