. 2019 Dec 4;10(1):5523.
doi: 10.1038/s41467-019-13447-0.

Photo-activated raster scanning thermal imaging at sub-diffraction resolution

Affiliations

Photo-activated raster scanning thermal imaging at sub-diffraction resolution

M Bouzin et al. Nat Commun. .

Abstract

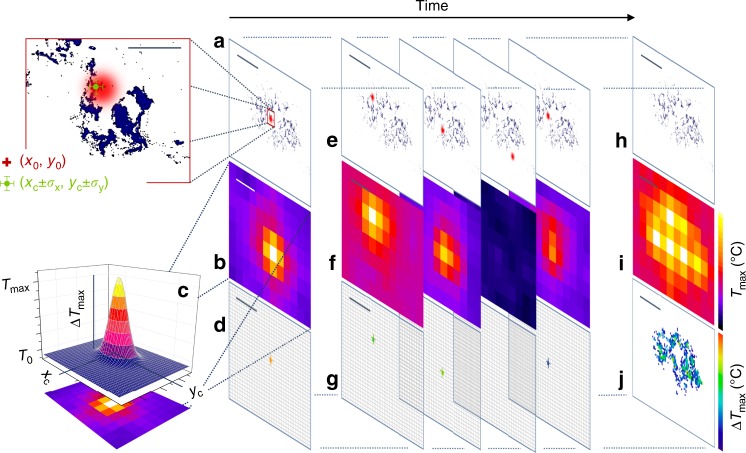
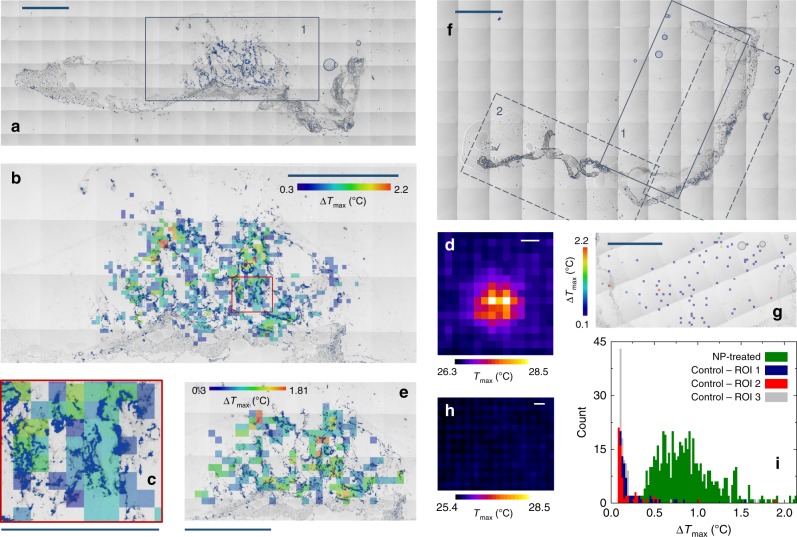
Active thermal imaging is a valuable tool for the nondestructive characterization of the morphological properties and the functional state of biological tissues and synthetic materials. However, state-of-the-art techniques do not typically combine the required high spatial resolution over extended fields of view with the quantification of temperature variations. Here, we demonstrate quantitative far-infrared photo-thermal imaging at sub-diffraction resolution over millimeter-sized fields of view. Our approach combines the sample absorption of modulated raster-scanned laser light with the automated localization of the laser-induced temperature variations imaged by a thermal camera. With temperature increments ∼0.5-5 °C, we achieve a six-time gain with respect to our 350-μm diffraction-limited resolution with proof-of-principle experiments on synthetic samples. We finally demonstrate the biological relevance of sub-diffraction thermal imaging by retrieving temperature-based super-resolution maps of the distribution of Prussian blue nanocubes across explanted murine skin biopsies.


Conflict of interest statement

The authors declare no competing interests.

Figures

Fig. 1
Fig. 1
Photo-activated thermal imaging at sub-diffraction resolution. A Gaussian laser beam (red spot in a) is focused on the sample at (x0, y0) with a square pulse of duration τon. Light absorbing entities (blue) induce a local temperature increase, which is measured by the thermal camera as an evolving 2D Gaussian peak. A Gaussian fit of the frame collected at time τon (b, c) provides the temperature variation ΔTmax = ΔTmaxT0 and the peak coordinates (xc ± σx, yc ± σy) that localize the center of the distribution of the absorbing objects within the laser spot size (magnified region in a). The procedure is repeated over sets of isolated points as exemplified in e, f. The center coordinates provided by the Gaussian fit of temperature peaks identify the position of the absorbing entities on the scan grid (d, g) with uncertainty σx,y and a color code assigned by the best-fit ΔTmax. A maximum projection of the signal across the raw thermo-camera image sequence provides a low (∼mm) resolution image of the sample (i), whereas a maximum projection of the stack containing all the localized absorptive centers provides the super-resolution image (j) of the scanned region (h). Scale bars (100 μm in the magnification of a, 1000 μm elsewhere) indicate the typical imaged fields of view; note that the ~50-μm laser spot and the whole magnified area in a lie within a single ~400-μm typical thermo-camera pixel on the sample plane. All panels have been derived from experimental data acquired on an explanted murine skin biopsy treated with 30-nm Prussian blue nano-cubes analogous to the one employed for Fig. 3.
Fig. 2
Fig. 2
Proof-of-principle experiments. a, f Transmitted-light images of microfiche samples. b, e Temporal maximum projection of the raw thermo-camera image stacks acquired with modulated illumination on the samples in a and f, respectively; acquisition parameters: NxxNy = 120 × 36, δx = 34.4 μm, Δx = 60, Δy = 6, τon = 300 ms, P = 4.6 mW, beam 1/e2 diameter 56 ± 2 μm in b, NxxNy = 160 × 42, δx = 15.3 μm, Δx = 160, Δy = 6, τon = 300 ms, P = 15 mW, beam diameter 22 ± 1 μm in e. c, g Super-resolution images of the samples in a and f, obtained from the image stacks employed for b and e, respectively; ΔTmin = 0.3 °C in c, 0.7 °C in gd Black: intensity profile along the dashed line in a upon a lookup-table inversion on the image; red: ΔTmax profile along the dashed line in c. h Black: average intensity profile along the vertical direction in f upon lookup-table inversion; red: average ΔTmax profile along the vertical direction in g with contrast percentages between adjacent peaks. In d, h, uncertainties on ΔTmax values equal the thermo-camera sensitivity 0.1 °C and x-axis error bars for non-zero ΔTmax values are extrapolated from the σx, y-versus-ΔTmax plot. Scale bars = 500 μm.
Fig. 3
Fig. 3
Sub-diffraction thermal imaging on murine biopsies. a Transmitted-light tile-scan image of an explanted murine skin biopsy treated with 30-nm PB nanocubes, which are highlighted in navy by an upper threshold on intensity counts. b Super-resolution image of ROI 1 in a (NxxNy = 100 × 48, δx = 37.6 μm, Δx = 50, Δy = 1, τon = 1 s, P = 15 mW, beam 1/e2 diameter 22 ± 1 μm, ΔTmin = 0.3 °C) overlaid to the transmitted-light image (nanocubes in navy as in a). c Magnification of the red boxed region in b. d Temporal maximum projection of the thermo-camera stack employed for b. e Same as b with doubled pixel size (NxxNy = 50 × 24, δx = 75.3 μm, Δx = 25, Δy = 2), overlaid to the transmitted-light image (nanocubes highlighted in navy as in a); only a 2.7 × 1.6 mm2 ROI is shown for the sake of display. f Transmitted-light tile-scan image of a nanoparticle-untreated explanted murine skin biopsy; pixels are highlighted in navy by the intensity upper threshold as in a. g Super-resolution image of ROI 1 in f (same acquisition parameters of b, ΔTmin = 0.1 °C); analogous results have been obtained in ROIs 2 and 3 in f (Supplementary Fig. 11). h Temporal maximum projection of the thermo-camera stack employed for g. i Histograms of the ΔTmax values of the super-resolution images of ROI1 in a and ROIs 1–3 in f. Scale bar = 345 μm in c, 1 mm elsewhere.

References

    1. Lahiri BB, et al. Quantification of defects in composites and rubber materials using active thermography. Infrared Phys. Technol. 2012;55:191–199. doi: 10.1016/j.infrared.2012.01.001. - DOI
    1. Herman C. The role of dynamic infrared imaging in melanoma diagnosis. Expert. Rev. Dermatol. 2013;8:177–184. doi: 10.1586/edm.13.15. - DOI - PMC - PubMed
    1. Okabe T, et al. First-in-human clinical study of novel technique to diagnose malignant melanoma via thermal conductivity measurements. Sci. Rep. 2019;9:3853. doi: 10.1038/s41598-019-40444-6. - DOI - PMC - PubMed
    1. Ciampa F, Mahmoodi P, Pinto F, Meo M. Recent advances in active infrared thermography for non-destructive testing of aerospace components. Sensors. 2018;18:609. doi: 10.3390/s18020609. - DOI - PMC - PubMed
    1. Lapierre-Landry M, Gordon AY, Penn JS, Skala MC. In vivo photothermal optical coherence tomography of endogenous and exogenous contrast agents in the eye. Sci. Rep. 2017;7:9228. doi: 10.1038/s41598-017-10050-5. - DOI - PMC - PubMed

Publication types