. 2019 Dec 4;10(1):5514.
doi: 10.1038/s41467-019-13454-1.

Dynamic and tunable metabolite control for robust minimal-equipment assessment of serum zinc

Affiliations

Dynamic and tunable metabolite control for robust minimal-equipment assessment of serum zinc

Monica P McNerney et al. Nat Commun. .

Abstract

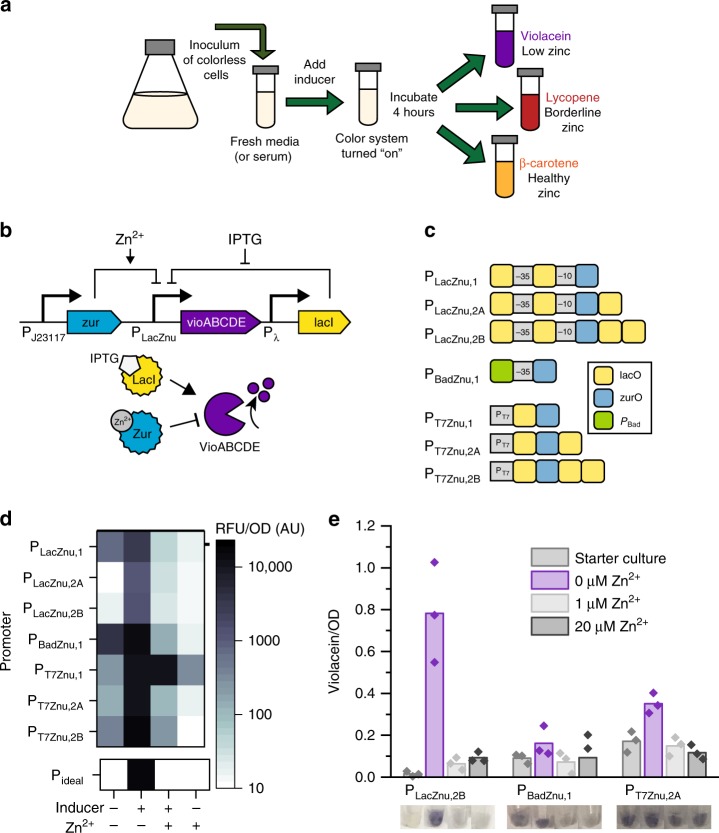
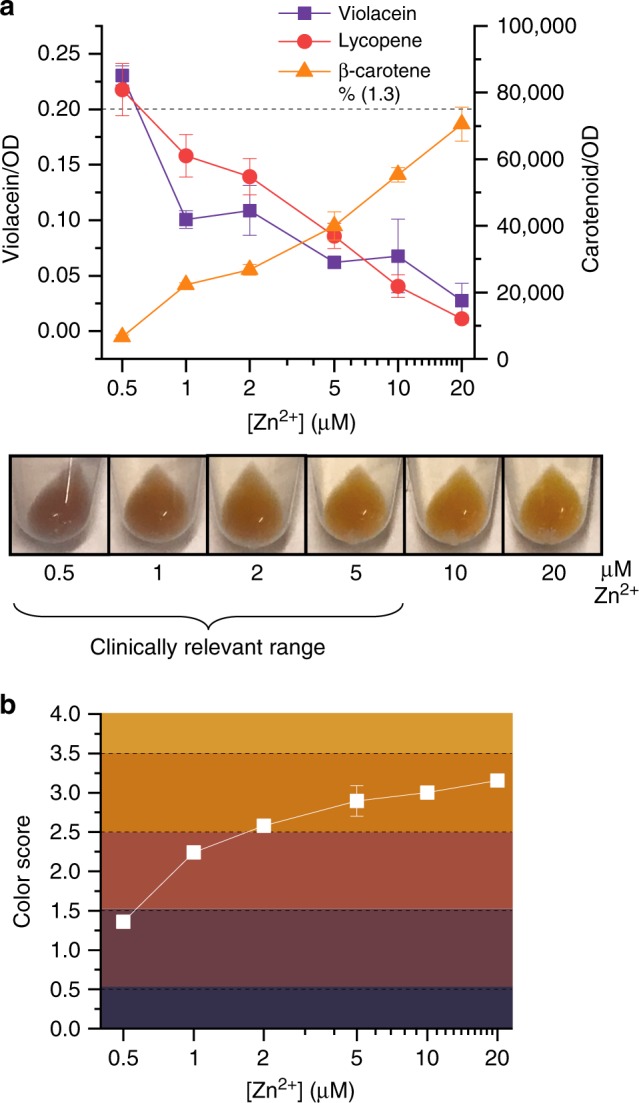
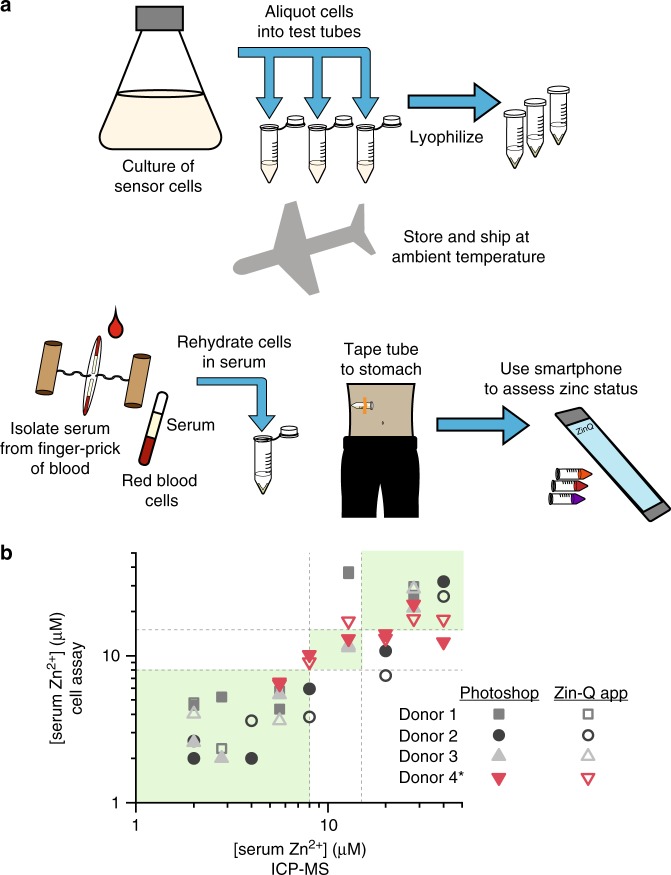
Bacterial biosensors can enable programmable, selective chemical production, but difficulties incorporating metabolic pathways into complex sensor circuits have limited their development and applications. Here we overcome these challenges and present the development of fast-responding, tunable sensor cells that produce different pigmented metabolites based on extracellular concentrations of zinc (a critical micronutrient). We create a library of dual-input synthetic promoters that decouple cell growth from zinc-specific metabolite production, enabling visible cell coloration within 4 h. Using additional transcriptional and metabolic control methods, we shift the response thresholds by an order of magnitude to measure clinically relevant zinc concentrations. The resulting sensor cells report zinc concentrations in individual donor serum samples; we demonstrate that they can provide results in a minimal-equipment fashion, serving as the basis for a field-deployable assay for zinc deficiency. The presented advances are likely generalizable to the creation of other types of sensors and diagnostics.


Conflict of interest statement

M.P.S. is founder and officer of a company, Chromanostics, previously formed for commercialization of micronutrient diagnostics. The authors declare no other competing interests.

Figures

Fig. 1
Fig. 1
Dual-input promoters decouple cell growth and pigment production. a Design of a dual-input system that decouples pigment production from cell growth. Colorless cells are added to fresh medium or to a serum sample at a density high enough that cells are visible, and a small-molecule inducer is added to activate the color-response circuit. After a short incubation, different pigments (either violacein, lycopene, or β-carotene) are produced to indicate different zinc concentrations. b Circuit diagram and schematic depicting the design of a dual-input promoter that regulates production of the violacein pathway genes, using IPTG/LacI-regulation as an example. Violacein should only be produced in low zinc conditions when IPTG is present. Analogous schematics for AraC- and T7 RNAP- mediated control are in Supplementary Fig. 1. c Promoter architecture for the library of synthetic promoters. The −10 and −35 σ70 binding domains are marked, and lac and zur operator sites are shown in yellow and blue, respectively. For the PBadZnu promoter, the −10 binding domain is not explicitly marked because it is embedded in the Zur operator site, and the green box indicates the entire PBad promoter sequence that is upstream of the −35 binding domain. For PT7 variants, the consensus T7 RNAP binding domain is marked in gray. Supplementary Table 1 contains annotated promoter sequences for all constructed promoters. d Fluorescent characterization of all engineered promoters. Ideally, eGFP should only be produced in the + inducer/−zinc state, as indicated by example output from a hypothetical ideal promoter (Pideal). Each box in the heat map is the average of three biological replicates. Supplementary Fig. 2 shows averages with standard deviations. e Violacein production from the best-responding hybrid promoters of each group. A starter culture (−inducer/−zinc) was used to inoculate cultures that contained the appropriate inducer and different concentrations of zinc. Bars represent the average of three biological replicates, which are depicted as overlaying points. Images below the graph show representative cell pellets from each condition. Source data for d and e are provided in the Source Data file.
Fig. 2
Fig. 2
Initial multi-color sensor cells. a Circuit diagram and schematic depicting the design of the three-color circuit. During the pre-assay culture stage, LacI represses all pigment production by repressing PLacZnu,2B (which controls violacein production) and PLac (which controls lycopene production). IPTG alleviates LacI repression, activating the pigment production module indicated by the dashed box in the schematic. The crtEBI genes, which control lycopene production, are produced at all zinc concentrations. In low zinc concentrations, violacein is produced, overpowering lycopene production and leading to visibly purple cells. At intermediate zinc concentrations, Zur binds zinc and represses violacein expression, leading to visibly red cells. At high zinc concentrations, ZntR also binds zinc and activates production of CrtY, which converts lycopene to β-carotene, leading to visibly orange cells. b Pigment quantification and visualization of sensor cells that were induced with IPTG and grown for four hours. At low zinc concentrations, cells produce violacein and lycopene and appear visibly purple. Cells grown in zinc concentrations between 0.2 and 10 µM are visibly red. At high zinc concentrations, β-carotene production overpowers lycopene production, and cells appear visibly orange. The dotted line indicates the threshold for visible violacein. Error bars indicate standard deviations. The bracket indicates the range of physiologically relevant zinc concentrations corresponding with cells grown in 25% human serum. Ideally, cells should appear three different colors within this bracketed concentration range. Source data for b are provided in the Source Data file.
Fig. 3
Fig. 3
Tuning color thresholds with an inverter. a Circuit diagram and schematic depicting inverter method to modulate PLacZnu,2B expression. During the pre-assay culture stage, LacI represses all pigment production. Upon IPTG addition, the activator ZntR controls expression of Zur: increasing concentrations of zinc correspond with increased amounts of Zur, which leads to decreasing expression from PLacZnu,2B, serving as an effective inverter of the expected output. The RBS and ssrA tag modulate the amount of Zur produced and thus the amount of zinc needed to activate full Zur repression. b Fluorescent characterization of Zur inverter circuits. A library of circuits was assembled with different relative levels of Zur. RBS values are the predicted relative RBS strength, and ssrA values indicate the relative strength of degradation (ssrA strength = 1 corresponds with no added degradation tag, and ssrA strength = 100 corresponds with the strongest degradation tag). Decreasing Zur expression levels correspond with cells that shut off expression at higher zinc concentrations. c Visual assessment of cells with tunable violacein expression. Overnight starter cultures were added to fresh media that contained IPTG and specified zinc concentrations and grown for four hours. Violacein quantification is shown in Supplementary Fig. 8. Source data for b are provided in the Source Data file.
Fig. 4
Fig. 4
Multi-color sensor cells respond to physiological zinc concentrations. a Circuit diagram and schematic depicting the design of tunable sensor cells. During the pre-assay culture stage, LacI represses all pigment production. IPTG addition activates the pigment production module, which is indicated by the dashed box. ZntR controls expression of both Zur and CrtY. At a threshold zinc concentration, Zur will repress expression of the violacein pathway, leading to cells that are red at intermediate zinc concentrations. Increasing amounts of zinc also lead to increased amounts of CrtY, which converts lycopene to beta-carotene. Modulation of the RBS and ssrA tag on CrtY can be used to tune the red to orange transition point. b Pigment quantification and visualization of sensor cells grown in minimal medium containing glycerol. All sensor cells have violacein off points between 1 and 2 µM, and the lycopene to β-carotene transition points vary based on the expression levels of CrtY. The best performing sensor cells (containing plasmid p3cI,2) have moderate CrtY expression and are visibly purple, red, and orange across a physiologically relevant range of zinc concentrations. The dotted line indicates the threshold for visible violacein. Source data for b are provided in the Source Data file.
Fig. 5
Fig. 5
Assessment of zinc concentration in human serum. a Pigment quantification and visualization of sensor cells grow in 25% serum with IPTG and specified zinc concentrations. Assessment was performed four hours after inoculation. Cells are visibly purple, red, or orange across a range of physiologically relevant zinc concentrations. The dotted line indicates the threshold for visible violacein. b Quantitative color assessment of sensor cells. Using RGB values taken from images of cell pellets, a color score was calculated for cells grown in each zinc concentration. As indicated by shading on the plot, scores between 0 and 1.5 indicate purple cells, scores between 1.5 and 2.5 indicate red cells, and scores between 2.5 and 4 indicate orange cells. By RGB score quantification, cells are classified as either purple, red, or orange across a range of 0.5 to 5 μM zinc. Data points show the average of three biological replicates, and error bars indicate standard deviation. Source data for a and b are provided in the Source Data file.
Fig. 6
Fig. 6
Accurate zinc assessment in a minimal-equipment setting. a Schematic of proposed workflow for in-field zinc assessment with sensor cells. During test manufacture, a large culture of repressed sensor cells is aliquoted into individual test tubes, and cells are lyophilized. Lyophilized tests can be shipped at ambient temperature to the site of testing, where serum will be isolated from a finger stick of blood and used to rehydrate the lyophilized sensor cells. Sensor cells can be incubated at ~37 °C by taping tubes to the body. After incubation, the test can be interpreted with an easy-to-use smartphone app. b Assessment of zinc status from color quantification. Images containing pellets of standards and a test reaction were processed either with Photoshop or with the Zin-Q smartphone app. A calibration curve was calculated from each image, and this was used to assess the concentration of zinc in the test reaction. When results are processed both with Photoshop and with the Zin-Q app, the test accurately classifies all serum samples with low zinc levels. Accurate classification of low, borderline, and high serum zinc is indicated by points in the green area of the plot. The asterisk indicates that serum from Donor 4 was not used in test standards. Source data for b are provided in the Source Data file.

References

    1. Nielsen AA, et al. Genetic circuit design automation. Science. 2016;352:aac7341. doi: 10.1126/science.aac7341. - DOI - PubMed
    1. Andrews Lauren B., Nielsen Alec A. K., Voigt Christopher A. Cellular checkpoint control using programmable sequential logic. Science. 2018;361(6408):eaap8987. doi: 10.1126/science.aap8987. - DOI - PubMed
    1. Wu G, et al. Metabolic burden: cornerstones in synthetic biology and metabolic engineering applications. Trends Biotechnol. 2016;34:652–664. doi: 10.1016/j.tibtech.2016.02.010. - DOI - PubMed
    1. Yoon S-H, et al. Enhanced lycopene production in Escherichia coli engineered to synthesize isopentenyl diphosphate and dimethylallyl diphosphate from mevalonate. Biotechnol. Bioeng. 2006;94:1025–1032. doi: 10.1002/bit.20912. - DOI - PubMed
    1. McNerney MP, Watstein DM, Styczynski MP. Precision metabolic engineering: the design of responsive, selective, and controllable metabolic systems. Metab. Eng. 2015;31:123–131. doi: 10.1016/j.ymben.2015.06.011. - DOI - PMC - PubMed

Publication types

MeSH terms